Graph theoretical analysis of developmental patterns of the white matter network
 Zhang Chen
 Min Liu
 Donald W. Gross
 Christian Beaulieu
- 1Department of Biomedical Engineering, Faculty of Medicine and Dentistry, University of Alberta, Edmonton, AB, Canada
- 2Division of Neurology, Department of Medicine, Faculty of Medicine and Dentistry, University of Alberta, Edmonton, AB, Canada
Understanding the development of human brain organization is critical for gaining insight into how the enhancement of cognitive processes is related to the fine-tuning of the brain network. However, the developmental trajectory of the large-scale white matter (WM) network is not fully understood. Here, using graph theory, we examine developmental changes in the organization of WM networks in 180 typically-developing participants. WM networks were constructed using whole brain tractography and 78 cortical regions of interest were extracted from each participant. The subjects were first divided into 5 equal sample size (n = 36) groups (early childhood: 6.0–9.7 years; late childhood: 9.8–12.7 years; adolescence: 12.9–17.5 years; young adult: 17.6–21.8 years; adult: 21.9–29.6 years). Most prominent changes in the topological properties of developing brain networks occur at late childhood and adolescence. During late childhood period, the structural brain network showed significant increase in the global efficiency but decrease in modularity, suggesting a shift of topological organization toward a more randomized configuration. However, while preserving most topological features, there was a significant increase in the local efficiency at adolescence, suggesting the dynamic process of rewiring and rebalancing brain connections at different growth stages. In addition, several pivotal hubs were identified that are vital for the global coordination of information flow over the whole brain network across all age groups. Significant increases of nodal efficiency were present in several regions such as precuneus at late childhood. Finally, a stable and functionally/anatomically related modular organization was identified throughout the development of the WM network. This study used network analysis to elucidate the topological changes in brain maturation, paving the way for developing novel methods for analyzing disrupted brain connectivity in neurodevelopmental disorders.
Introduction
Neuroimaging studies have demonstrated widespread and regionally specific structural and functional brain changes during development from infancy to adulthood. Structural magnetic resonance imaging (MRI) studies have reported age-related changes in brain volumes (Giedd et al., 1999; Good et al., 2001), areas (Thompson et al., 2000), cortical thickness (Sowell et al., 2004; Shaw et al., 2008), and regional gray matter (GM) and white matter (WM) density (Paus et al., 1999; Gogtay et al., 2004). The developmental changes in GM and WM on gross scale MRI may reflect synaptic pruning and myelination occurring at the neuronal level (Gogtay et al., 2004). Functional neuroimaging studies have demonstrated increased connectivity among distant regions and decreased connectivity among neighboring regions in brain maturation which suggests a mechanism of segregation of local regions and integration of distant regions into disparate subnetworks for the developing brain (Fair et al., 2008, 2009; Vogel et al., 2010). Diffusion tensor imaging (DTI) studies of WM have shown age-related increases in fractional anisotropy (FA) and decrease in overall diffusion with development [many studies but some include (Snook et al., 2005; Lebel et al., 2008; Tamnes et al., 2010)], including into young adulthood (Giorgio et al., 2008; Lebel and Beaulieu, 2011).
The recent advent of modern network analysis based on graph theory (Strogatz, 2001), has enabled the investigation of the large-scale topological organization of various structural and functional brain networks such as the small-world property, network efficiency and modularity (He et al., 2007; Bullmore and Sporns, 2009; He and Evans, 2010). The network metrics have also proven useful in modeling the large-scale functional and structural organization of the developing brain. Several functional brain network studies have reported age-related increases in the small-worldness (Wu et al., 2013) and a progression from local to distributed organization (Fair et al., 2009) in brain development. The analysis of the structural brain network constructed from regional cortical thickness correlations has revealed a non-linear developmental pattern in network metrics and that most topological changes happen at the late childhood stage (Khundrakpam et al., 2013).
Recently, there has been an increasing interest in the study of how graph metrics of the anatomical brain network change during development. Using DTI, Yap et al. (2011) examined WM networks of 39 healthy pediatric subjects with longitudinal data collected at average ages of 2 weeks, 1 year, and 2 years and demonstrated that the small-world architecture exists at birth with efficiency that increases in later stages of development. Two recent brain connectivity studies of WM maturation pattern using diffusion MRI tractography demonstrated linear and non-linear patterns of increasing structural efficiency with age between ages 2 and 18 years in 30 patients scanned clinically and otherwise deemed normal post-MRI (Hagmann et al., 2010) and between ages 12 and 30 years in 439 healthy subjects (Dennis et al., 2013). However, those studies were limited by different constraints such as a binarized brain network, limited sample size, or restricted age range (early adolescence to early adulthood), thus the developmental trajectory of the WM network from early childhood to adulthood remains unclear.
Therefore, the main goal of this study was to map the developmental changes of the structural brain network based on WM connectivity in 180 typically-developing subjects from 6 to 30 years of age. We hypothesized (i) non-linear age-related developmental trajectories of network metrics as most changes would be expected to happen at late childhood and adolescent stages, and (ii) altered modular organization in different age groups that reflects a process of fine-tuning in structural brain development.
Materials and Methods
Subjects
This study included 180 healthy right-handed subjects aged from 6 to 30 years. Health was verified by asking participants a series of questions to ensure there was no history of neurological or psychiatric disease or brain injury. All subjects gave informed consent; child assent and parent/guardian consent was obtained for volunteers under 18 years. The subjects were divided into 5 age groups with equal numbers of subjects and demographics of all groups are shown in Table 1.
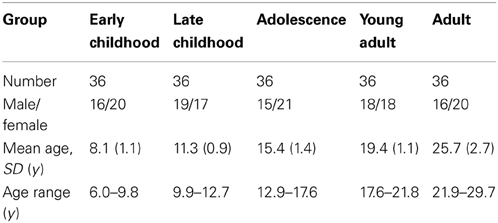
Table 1. Group demographics.
Image Acquisition
All data were acquired on a 1.5-T Siemens Sonata MRI scanner. Standard DTI was acquired using a dual spin-echo, single shot echo-planar imaging sequence with the following parameters: 40 3-mm-thick slices with no inter-slice gap, TR = 6400 ms, TE = 88 ms, 6 non-collinear diffusion sensitizing gradient directions with b = 1000 s/mm2, 8 averages, field-of-view 220 × 220 mm2, matrix of 96 × 128 zero-filled to 256 × 256, and scan time of 6:06 min. T1-weighted images were also acquired using MPRAGE with TE = 4.38 ms, TR = 1870 ms, TI = 1100 ms, and scan time of 4:29 min.
Structural Brain Network Construction
Image preprocessing steps including motion and eddy current corrections were performed using FSL 5.0 for all DTI images (http://fsl.fmrib.ox.ac.uk/fsl/fslwiki). The T1-weighted (MPRAGE) image of each subject was first linearly coregistered (Figures 1A,B) to its corresponding b0 image. Each transformed T1 image was then non-linearly registered to a pre-segmented and validated volumetric template, the automated anatomical labeling (AAL) atlas (Tzourio-Mazoyer et al., 2002) as shown in Figures 1B,C. This parcellation divided the cortical surface into 78 regions (39 per hemisphere). See Table 2 for the name of the regions and their corresponding abbreviations. The resulting inverse deformation map (T−1) for each subject was then applied to warp the AAL template to the DTI native space of each subject using nearest neighbor interpolation method (Figures 1E,F) as each AAL region was defined as a brain network node. Whole brain WM tractography was performed using a brute-force streamline-tracking method (Basser et al., 2000) with a FA threshold of 0.2 and primary eigenvector turning angle of 45 degrees (Figures 1A,D). To limit false positive connections, two cortical regions were deemed connected if at least 10 connecting fibers with two end points were located between them; the same threshold was also applied in a recent brain network study (van den Heuvel et al., 2012). The effects of different node-connecting fiber number (FN) thresholds ranging from 3 to 10 were determined for our network analysis. We quantified the weight of each valid connection between two cortical regions (i and j) as the product of the connecting FN and mean FA of the connecting fiber, normalized by dividing the average volume of the two connecting regions to counteract the bias where larger cortical regions inherently project/receive more “virtual” fibers (wij = FN*FA/Volume). Several diffusion brain network studies have applied this weighting function (Lo et al., 2010; Brown et al., 2011). As a result, the structural brain network of each participant was represented by a symmetric 78 × 78 matrix (Figure 1G).
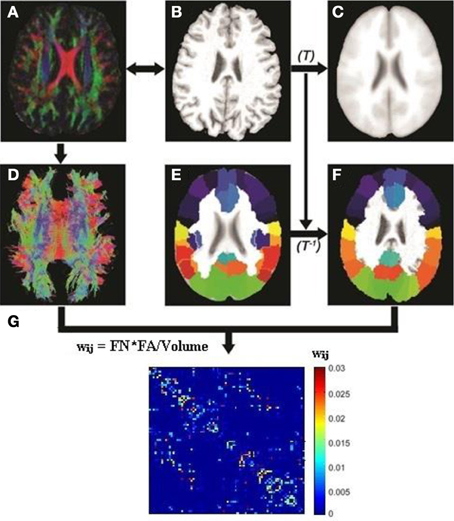
Figure 1. Flowchart for the construction of the DTI white matter (WM) network for each subject. The T1-weighted image of each subject (B) was first coregistered into DTI native space (A) using rigid transformation to the b0 image (not shown). The resultant T1 image was then non-linearly registered to the ICBM 152 template (C) in the MNI space to obtain transformation matrix T. The AAL template (E) was then inversely warped back to the individual DTI space (F) using the inverse transformation (T−1). Whole brain white matter fibers were reconstructed using a deterministic tractography method in native DTI space (D). The WM fibers connecting any pair of regions were located and the edge weight between the two regions was calculated from the FA, fiber number (FN) and average volume of the two cortical regions. (G) A sample white matter network for one subject.
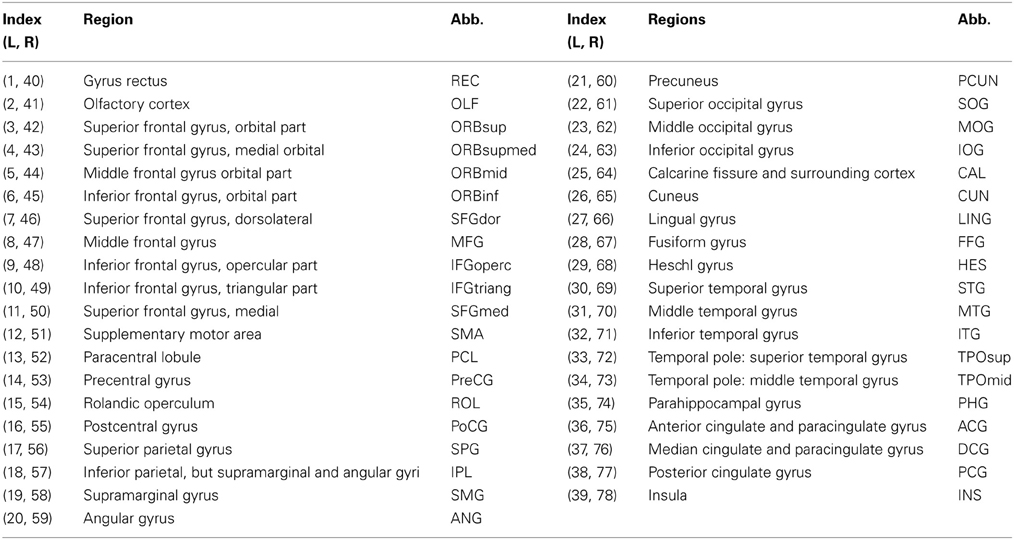
Table 2. Seventy eight cortical regions of interest defined in the study and their abbreviations (L: left hemisphere, R: right hemisphere).
To examine the small-worldness and modular organization of the WM networks for all different age groups, one weighted backbone network for each age group was generated to capture the underlying anatomical connectivity patterns using a previously published method by our group (Gong et al., 2009). In summary, to identify the highly consistent cortical connections, a non-parametric one-tailed sign test was applied. For each pair of cortical regions, the sign test was performed with the null hypothesis that there is no existing connection. The Bonferroni method was applied to correct for multiple comparisons at P < 0.05. The use of this conservative statistical criterion generated a symmetric weighted matrix as each edge weight was calculated as the mean of all existing edges in all subjects that captured underlying anatomical connectivity patterns in the human cerebral cortex (Gong et al., 2009).
Network Analysis
Several network topological properties were applied for the weighted anatomical brain network derived from each participant, including small-worldness, efficiency and modularity (Watts and Strogatz, 1998; Latora and Marchiori, 2001; Newman, 2006). The connection weights of all edges (wij) were normalized by the mean weight of the whole network to keep network cost at the same level for all subjects.
For a weighted network G with N nodes and K edges, the total strength S was defined as the mean of all edge weights in the network, where i and j are two distinct nodes in graph G. The clustering coefficient (CC) of the weighted network G quantifies the likelihood whether the neighboring nodes of any network nodes are connected with each other (Onnela et al., 2005), which was defined as: , where ki is the number of connected neighbors of node i. The weighted characteristic path length L of a network is the average minimum connectional weights that link any two nodes of the network. To avoid the issue of disconnected nodes, L was measured here by using a “harmonic mean” distance between any pair of nodes such as the reciprocal of the average of the reciprocals (Newman, 2003). A real network would be considered small world if it meets the following criteria: γ = Crealp/Crandp > 1 and λ = Lrealp/Lrandp ~ 1 (Watts and Strogatz, 1998), where Crandp and Lrandp are the mean CC and L of matched random networks that preserve the same number of nodes, edges and degree distribution as the real network (Maslov and Sneppen, 2002). In this study, we generated 1000 matched random networks for each group network.
The global efficiency Eglob of a weighted network G is defined as , where wij is the smallest connectional weight between node i and j and N is the number of nodes. It characterizes the efficiency of a system transporting information in parallel (Latora and Marchiori, 2003). The local efficiency Eloc of a weighted network G is defined as: , where Gi denotes the subgraph composed of the nearest neighbors of node i. The local efficiency represents the fault tolerance level of the network in response to the removal of a node (Latora and Marchiori, 2003).
The regional global efficiency Ereg of a given node i is defined as: , as it measures the average smallest path weight between given node i and all other nodes in the network. The node i was considered as a hub if its regional global efficiency was at least one standard deviation (SD) greater than the mean nodal efficiency of the whole network.
The modularity Q(p) for a given partition p of a weighted brain structural network is defined as , where NM is the number of modules, W is the total weight of the network, ws is the sum of the connectional weights between all nodes in module s, and Ws is the sum of the nodal weights in module s. The modularity index quantifies the difference between the weight of intra-module links of the actual network and that of a random network in which connections are weighted at random (Newman, 2004). The aim of this module identification process is to find a specific partition p which yields the largest network modularity, Q(p). Here a modified greedy optimization algorithm (Clauset et al., 2004; Danon et al., 2006) is used to find the modules of the network. The advantage of this modularity optimization method is that it takes into account the heterogeneity of module size observed in real networks (Danon et al., 2006).
We also determined the participation coefficient (PC) for each cortical region in terms of their inter-modular connection density (Guimera and Amaral, 2005; Guimera and Nunes Amaral, 2005; Sales-Pardo et al., 2007). The PC, Pi, measures the inter-modular connectivity of node i, and is defined as: , where NM is the number of modules and wis is inter-modular connectional weight between the node i and module s. wi is the total weight of node i in the network. The PC of node i will be close to 0 if all weights are within its module. The node i was considered as an inter-modular hub if its PC value was at least one SD greater than the mean PC of the whole network.
Statistical Analysis
Between-group differences analysis of all the global network metrics (S, CC, L, Eglob, Eloc, Ereg, Q) was performed between adjacent age groups using the General linear model (GLM) with age and gender included as covariates. The nodal properties (Ereg, z, P) were corrected by false discovery rate at q = 0.05 (Genovese et al., 2002; Zeisel et al., 2011).
Results
Age-Related Changes in Fiber Number and Network Sparsity
To examine the age effect on the tractography results, we mapped age-related changes in the FN and sparsity of white matter network as shown in Figures 2A,B. We found that age has an incremental effect on both the FN and sparsity, where both increase by a factor of ~1.6 and ~1.2, respectively, from age 6 to 30 years. These increases are presumably due to the known elevations of FA in WM with age. Given the fact that our network edge weighting function depends on FN and FA, it is expected that the connectivity strength of the network would also increase with age.
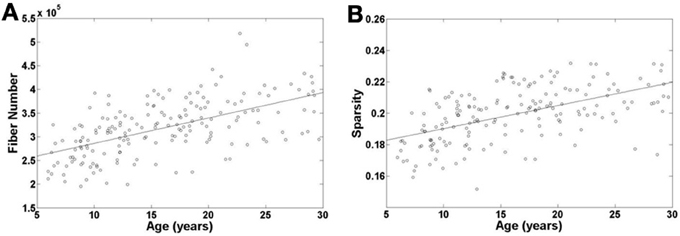
Figure 2. Age-related changes in fiber number and sparsity of white matter network in all the individual subjects. Both fiber number and sparsity demonstrate increases with age.
Small-World Efficiency of Developing WM Networks
To examine the small-worldness of the WM networks for all different age groups, using a previously published method by our group (Gong et al., 2009), one weighted backbone network for each age group was generated to capture the underlying anatomical connectivity patterns as shown in Figure 3. Compared with their corresponding 1000 random networks, all five age groups showed strong small-worldness (σearly childhood = 3.54, σlate childhood = 3.19, σadolescence = 3.25, σyoung adult = 3.12, σadult = 3.19).
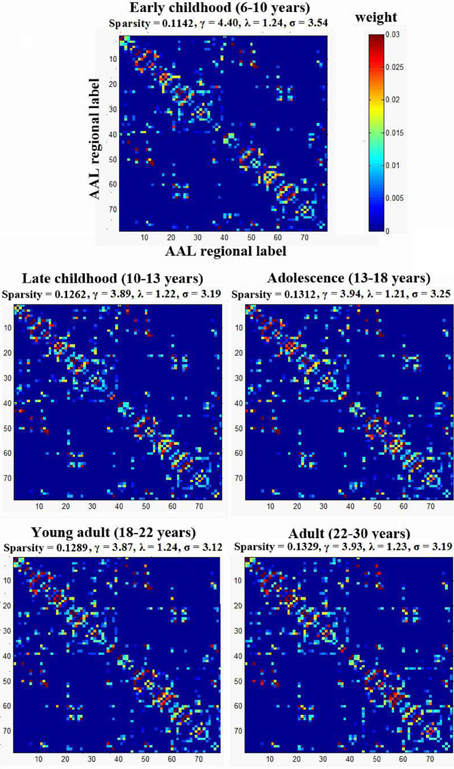
Figure 3. The small-worldness of the WM networks for the five age groups. Each group was represented by one weighted backbone network to capture the underlying anatomical connectivity patterns. Compared with their corresponding random networks, all age groups showed strong small-worldness (i.e., σ > > 1). The numbers reflect the structural indices indicated in Table 2.
Global Network Properties and their Age-Related Trajectories
Over all subjects in each age group, the total network weight, CC, Lp, modularity (Q), Eglob and Eloc was calculated for the WM network and the age-related trajectories are shown in Figure 4. The total network weight displayed significant increases in three of the four developing stages, whereas the other metrics such as Lp, Q, Eglob, and Eloc demonstrated non-linear alteration patterns where most changes happened from young childhood to late childhood that then leveled off. Both Lp and Q decreased significantly from young childhood to late childhood but stabilized at older ages. Global network efficiency increased significantly from young childhood to late childhood but also stabilized later. Local network efficiency increased significantly from late childhood to adolescence and stabilized afterwards.
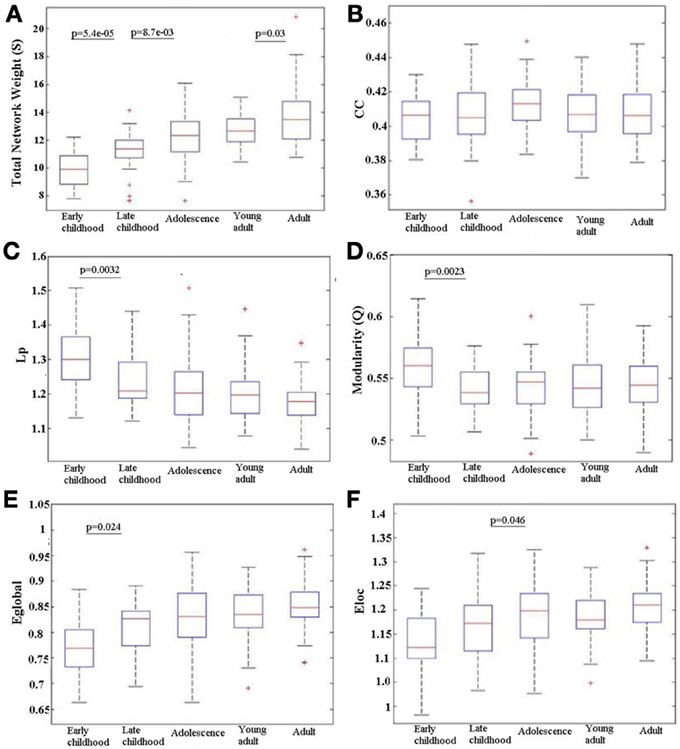
Figure 4. Age-related changes in different network metrics for the developing WM network from early childhood to adult. (A) Total network strength (S), (B) Clustering coefficient (CC), (C) Shortest path length (Lp), (D) Modularity (Q), (E) Global efficiency (Eglob), and (F) Local efficiency (Eloc). Significant changes between any adjacent age groups are indicated by their p value. An increase with age is observed in S over the full age span. Eglob increases only between the two youngest age groups and Eloc only between late childhood and adolescence; in both cases, the efficiency values then stay elevated. Reductions are observed in Lp and Q from early to late childhood that is then maintained low. There is no change in CC between any adjacent age groups. The + signs indicate outliers.
Regional Efficiency of the Developing WM Networks
We found consistent hubs regions, measured here as the AAL areas with highest regional global efficiency, such as bilateral PCUN, SFGdor, and SFGmed, that are shared by all age groups as shown in Figure 5. Comparing the regional efficiency changes from group to group in these hubs, seven regions had increased nodal efficiency (P < 0.05, FDR corrected) from early childhood to late childhood and two regions from late childhood to adolescence (Figure 6). Most regional changes from early to late childhood are in the default-mode system, including bilateral PCUN and left DCG. Left STG and right INS were found to have increased efficiency from late childhood to adolescence.
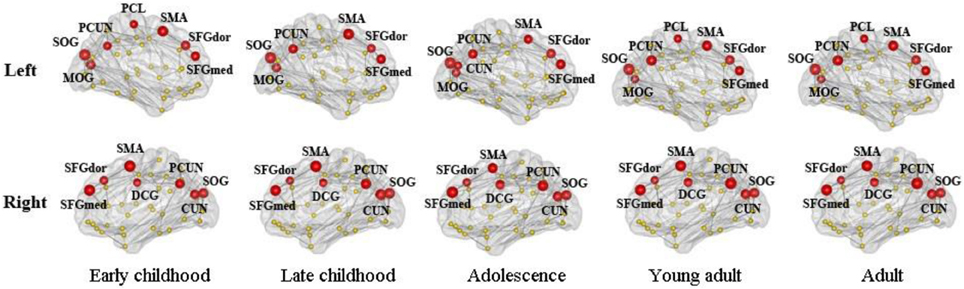
Figure 5. Global hubs of the developing WM network defined by their nodal efficiency. Association hub regions such as bilateral PCUN, SFGdor, and SFGmed are consistent over all age groups. Note that all brain images are viewed from the medial side (also for Figures 6, 7).
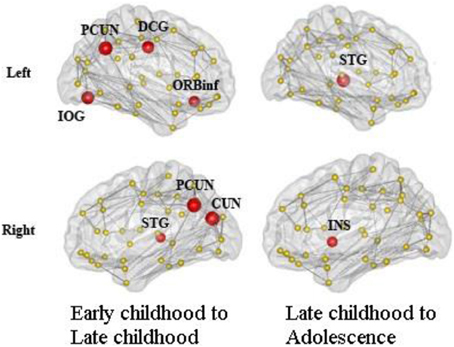
Figure 6. Regions with significantly increased nodal efficiency from early childhood to late childhood and late childhood to adolescence. Seven regions had increased nodal efficiency (P < 0.05, FDR corrected) from early childhood to late childhood and two regions from late childhood to adolescence. Most regional changes from early to late childhood are in the default-mode system, including bilateral PCUN and left DCG. Left STG and right INS have increased efficiency from late childhood to adolescence.
Modular Organization and Connector Hubs of the Developing WM Networks
The modular organization of the developing structural brain networks for the five different age groups is shown in Table 3 and Figure 7. Six modules (1–6) were detected in all age groups indicating strong stability (Greicius et al., 2003) in the modularity of the developing brain network. Despite decreased modularity from early to late childhood, the modular structures of both groups were almost identical. Module 1 was mostly composed of bilateral orbitofrontal regions (ORBsup, ORBsupmed, ORBmid, REC) in early and late childhood that becomes more lateralized in adolescence. Right orbitofrontal regions become connected with right temporal and occipital regions that resembles the ventral visual system (Grill-Spector et al., 2008) and left orbitofrontal regions become part of lateral frontal system. Module 2 consists of mostly occipital regions (SOG, CAL, CUN) throughout the youngest age groups except at adulthood when the left occipital regions become part of left ventral visual system (Grill-Spector et al., 2008). Lateralized modules 3 (left hemisphere) and 4 (right hemisphere) consist of regions mostly across frontal, parietal and temporal lobes from each hemisphere from early to late childhood. However, module 4 is pruned to a mainly frontal-parietal system from adolescence onwards and module 3 doesn't reach a similar outcome until adulthood. Modules 5 and 6 are two of the most consistent modules during development and include mostly bilateral frontal (SFG, MFG) and posterior parietal (PCUN, DCG, SMA) regions, respectively.
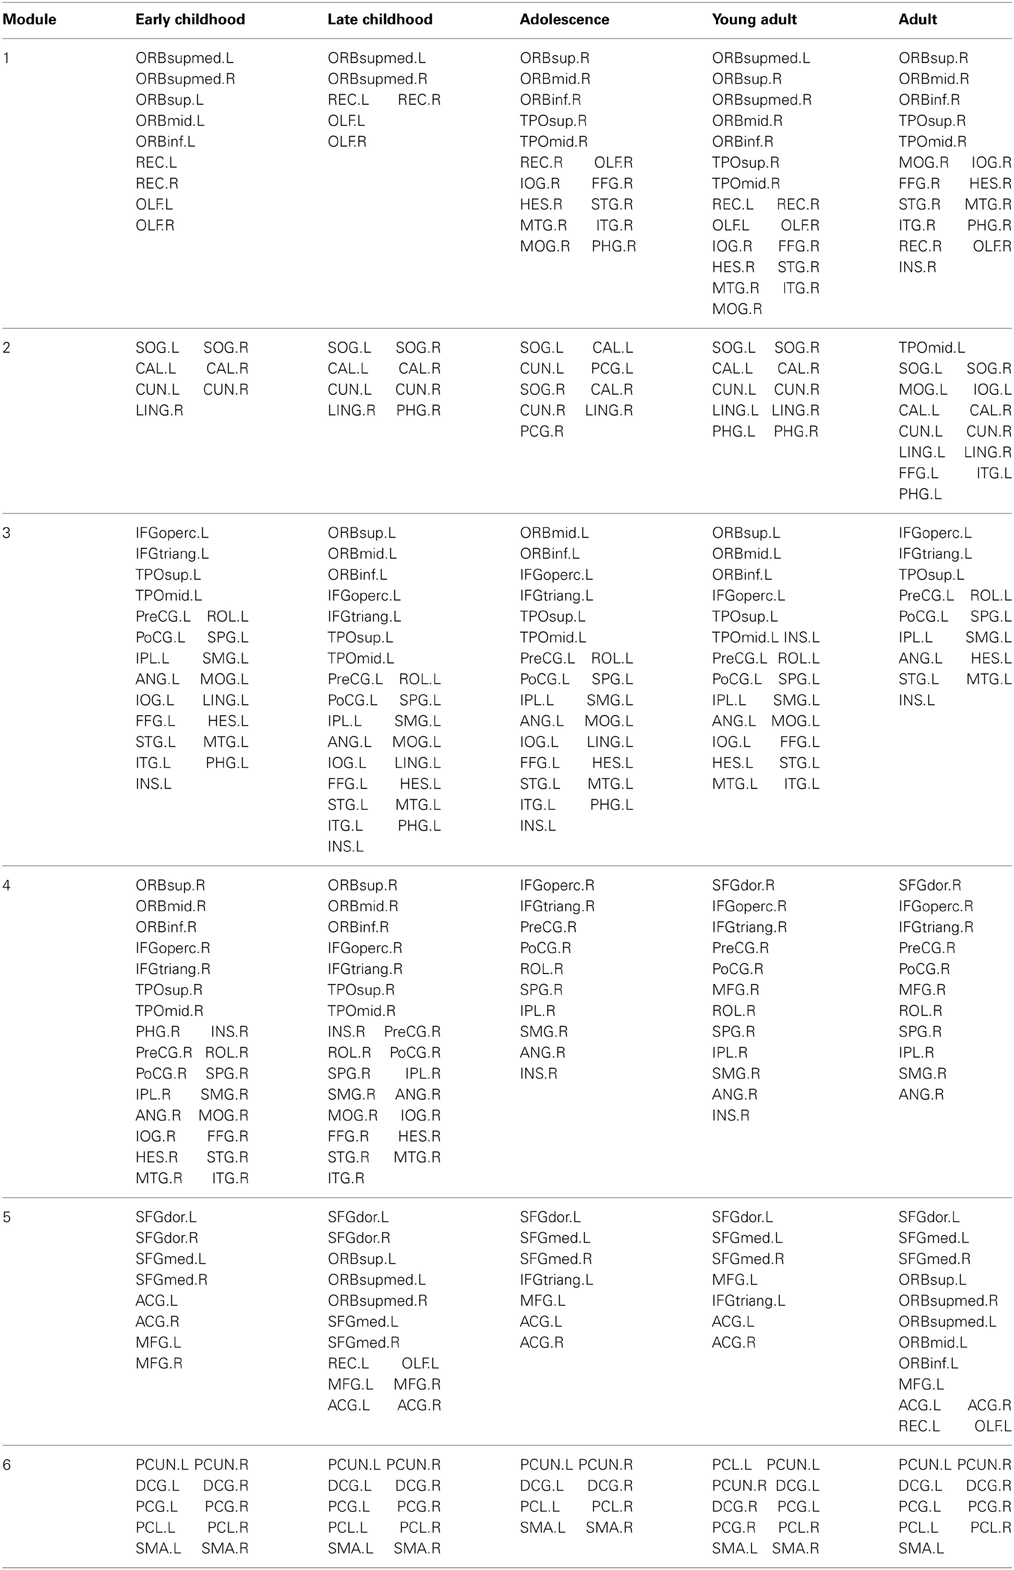
Table 3. Cortical regions in each module of developing white matter network.
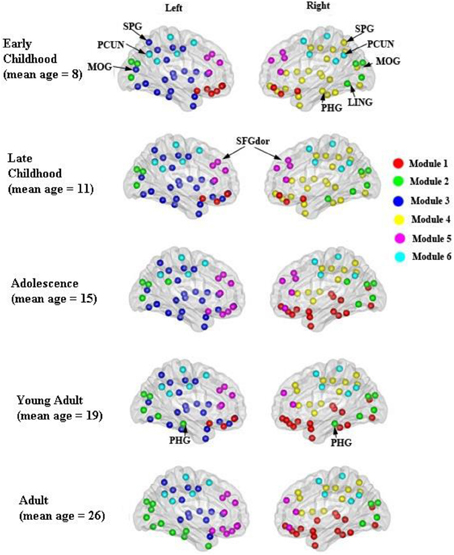
Figure 7. Modular organization of the developing WM networks. Six modules (1–6) were detected in all age groups and are represented by red, green, purple, yellow, pink, and blue colors. See Table 3 for a detailed list of modular regions. Module 1 was mostly composed of bilateral orbitofrontal regions (ORBsup, ORBsupmed, ORBmid, REC) in early and late childhood and becomes more lateralized from adolescence onwards. Module 2 consists of mostly occipital regions (SOG, CAL, CUN) bilaterally. Lateralized modules 3 (left hemisphere) and 4 (right hemisphere) consist of regions mostly across frontal, parietal and temporal lobes within each hemisphere. Modules 5 and 6 are two of the most consistent modules during development that include mostly bilateral frontal (SFG, MFG) and posterior parietal (PCUN, DCG, SMA) regions, respectively.
The distribution of inter-modular hubs based on PC of each region for different age groups was very consistent (Figure 8). They were mostly located within posterior cortex, including bilateral PCUN, SPL, and MOG. Large frontal hubs such as bilateral SFGdor appeared in late childhood and remained significant afterwards.
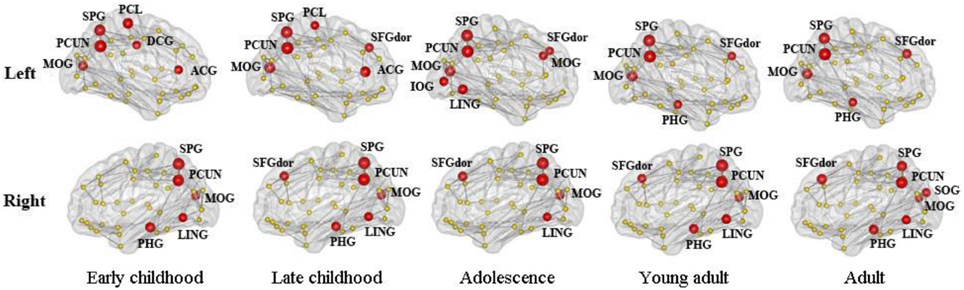
Figure 8. The distribution of inter-modular hubs based on participation coefficient (PC) of each region for different age groups. They were mostly located within posterior cortex, including bilateral PCUN, SPL, and MOG. Large frontal hubs such as bilateral SFGdor appeared in late childhood and remained significant afterwards.
To ensure the change of modular organization didn't result from the different sparsity of the five age groups, an additional analysis was performed where we normalized all group networks sparsity to the lowest sparsity at 0.1142 (early childhood) as weaker connections were removed from the other networks with higher sparsity (late childhood, 0.1262, adolescence, 0.1312, young adult, 0.1289, adult, 0.1329) and re-examined the modularity of the networks. We found extremely consistent modularity (0.56 previous vs. 0.56 with normalized sparsity in late childhood, 0.56 vs. 0.56 in adolescence, 0.55 vs. 0.56 in young adults, and 0.58 vs. 0.56 in adults) and modular organization compared with our original networks. Thus, we could presume that changes in the backbone network and its modular organization were not due to different matrix densities.
Discussion
The present study utilized DTI tractography and network theory to characterize changes to the global structural WM network with age from early childhood to adulthood. Our main results are demonstrations of (1) a non-linear age effect on most network topological properties of brain WM network in development where most changes happen at late childhood stage (10–13 years), such as increased global network efficiency and decreased modularity, suggesting a shift of organization toward a more randomized configuration, (2) consistent hubs involving several major functional systems across all age groups and significant nodal changes only happening from early childhood to adolescence, (3) anatomically localized modules in the development of brain WM network, and (4) key connector hubs during development of the WM network.
First, using graph theoretical analysis, small-world network architecture was demonstrated in the WM networks of all age groups. During the last decade, graph theoretical analysis has been widely applied to both the functional (Stam, 2004; Bassett et al., 2006; Achard and Bullmore, 2007) and anatomical (He et al., 2007; Hagmann et al., 2008; Gong et al., 2009) brain networks and one common finding is the existence of “small-worldness” in all types of network, as defined by high CC and low characteristic path length. Recent structural brain network studies have also revealed that small-world topology and modular organization are established during early brain development (<2 years) to support rapid synchronization and information transfer with minimal rewiring cost (Fan et al., 2011; Yap et al., 2011). Thus, our results are in agreement with previous findings that the WM network maintains small-world efficiency at all stages of development.
Total network weight shows increases in three of the four developing stages, although the greatest change is between the two youngest groups pre-adolescence. Our finding is consistent with a previous WM network study that reported a significant increase in the average node strength in a group of subjects aged from 18 months to 18 years where it was suggested that increased network weight indicates increased nodal strength and greater physiological efficacy, particularly of long pathways (Hagmann et al., 2010). A functional network study has also reported increased functional integration due to a decrease of average path length during the same period and suggested it was related to increased axonal diameter and myelin thickness of long association fiber tracts (Supekar et al., 2009). We also found significant age-related decreases in the shortest path length and modularity and increase in the global efficiency of the developing WM network from early childhood to late childhood indicating greater integration among distant brain regions and a shift of topological organization to a more randomized configuration. Previous WM network (Hagmann et al., 2010) and cortical thickness network (Khundrakpam et al., 2013) studies of brain development also demonstrated a similar pattern of network metrics evolution between age 2 and 18 years and between 5 and 18 years, respectively. However, the WM network study had applied a linear fit for all the network metrics vs. age even though network metrics such as efficiency and clustering seemed to have leveled off after late childhood in their paper (Hagmann et al., 2010). Using a similar approach to ours, (Khundrakpam et al., 2013) demonstrated a leveling off of various cortical thickness network metrics after the early adolescence stage.
Consistent global hub regions, indicated by higher regional efficiency, are observed across all age groups. Hub regions are predominately association cortices that receive convergent inputs from multiple cortical regions. Regions such as SFG and PCUN have been constantly identified as the hub regions in both structural (He et al., 2007; Gong et al., 2009) and functional brain networks (Achard and Bullmore, 2007). A recent structural brain network study also identified them as the hub regions from age 2 years suggesting that they are established at a very early age (Hagmann et al., 2010). We also found that the regions with the most age-related increases in efficiency are in the default-mode system, including bilateral PCUN and left DCG. A functional brain network study has reported a less well-developed default mode network connectivity in early childhood compared with adults, especially within posterior regions such as PCUN (Fair et al., 2008). However, evidence from structural covariance network analysis has demonstrated significant pruning in the default mode system from early childhood to late childhood (Zielinski et al., 2010). Thus, we could speculate that nodal efficiency of default mode regions might plateau by late childhood.
In this study, a stable and functionally/anatomically related modular organization was demonstrated in the developing WM network. Six modules comprising regions with known functions or connections were identified in the developing WM network. Modules 1, 2, 5 and 6 were mostly composed of orbitofrontal, occipital, frontal, and posterior parietal regions that could correspond to sensory integration, visual, executive function, and default mode network, respectively, (Duncan and Owen, 2000; Raichle et al., 2001; Kringelbach, 2005). Modular network analysis has provided rich quantitative insights into the organization of complex brain networks. Studies in mammalian anatomical brain networks have revealed clusters that overlap with many known brain functions (Hilgetag et al., 2000; Zhou et al., 2006). Previous neuroimaging studies have also demonstrated anatomically- and functionally-related modules in the human brain structural network using diffusion spectrum imaging (Hagmann et al., 2008) and the functional network using resting-state functional MRI (Salvador et al., 2005; Ferrarini et al., 2009; He et al., 2009; Meunier et al., 2009; Valencia et al., 2009). Also, network modules identified by cortical thickness network analysis are comprised of brain regions known to subserve distinct brain functions such as executive function, vision, and default mode network (Chen et al., 2008, 2011). Two recent DTI studies also revealed non-random and dynamic modular organization of structural brain network in the first 2 years of brain development (Fan et al., 2011; Yap et al., 2011). Two lateralized modules (3 and 4) that correspond to the frontal-parietal network were also observed in the developing WM network. The adult human brain exhibits distinct hemispheric asymmetries in both structure and function. These asymmetries are thought to originate from evolutionary, developmental, hereditary, experiential, and pathological factors (Toga and Thompson, 2003). Thus, we could speculate that the lateralized network modules might result from the functional and structural hemispheric asymmetries.
Taken together, our results suggest an efficient modular organization in the WM network from early childhood and are consistent with modular behavior reported in previous structural and functional brain network studies and more importantly, a lateralized developmental pattern in some of the modules. The inter-modular hubs are the main connectors between modules and their existence in frontal and posterior cortex in the developing brain are consistent with previous WM network (Yap et al., 2011) and cortical thickness network (Khundrakpam et al., 2013) analysis. Resting state functional networks have also reported a high density of strong functional connections in posterior cortex (Achard et al., 2006). Thus, we could speculate that the inter-modular hubs uncovered in this study are well-established at childhood and are responsible for the connections between different functional systems of the developing brain.
A few methodological issues need to be addressed. Two drawbacks of our study include the acquisition of DTI data with six diffusion directions at low b values of 1000 s/mm2 and the use of deterministic tractography which will give errors in such an unsupervised tractography method given abrupt terminations at low FA crossing fiber regions or erroneous connections due to errors in the primary eigenvector direction. Multiple gradient directions can reduce the uncertainty of the primary eigenvector direction and limit potential bias as a function of tract orientation, both concerns for deterministic tractography of WM tracts (Landman et al., 2007). However, a recent study from our group has demonstrated six-direction data can also provide average diffusion measures like FA over a specific tract with comparable robustness to 30- or 60-direction data and yield appropriate parameter values for many major WM tracts (Lebel et al., 2012), which is encouraging as our edge weights were calculated based on the average FA of all voxels over the whole tract connecting two nodes. However, this does not overcome potential false positive connections or missed connections from the deterministic tractography algorithm. We attempted to minimize the former by invoking a minimum FN between regions but an incorrect connection that is consistent among the subjects within a group would still be included in the network analysis. DTI data with more than six directions also permit other advantages such as alternative analysis methods (e.g., probabilistic tractography) (Dennis et al., 2013). Higher b values than typically acquired are also advantageous for resolving crossing fibers and increasing the accuracy of tractography derived connections (Tournier et al., 2008). Another limitation of the study is that the age ranges of the groups covered a 3.1 to 4.7 year age range for the four youngest groups. In this study, a general linear model was applied to remove those age effects within all groups before performing the between-group comparison. In future study, smaller age ranges within groups may provide more specific indices of timing for the WM network maturation. Third, a FN threshold of 10 was applied to minimize the inclusion of random connections between two cortical regions. Currently, there are no standard approaches in determining the threshold value for the number of connecting fibers between regions as small thresholds such as 3 streamlines (Shu et al., 2011) produced networks with large sparsity with many spurious connections. Thus, our choice of higher threshold reduces, but does not eliminate, the risk of false-positive connections due to noise or the limitations in deterministic tractography. Recently, a threshold of 10 connecting streamlines or more was also applied in a brain network study (van den Heuvel et al., 2012) in which they considered that edges comprising fewer than 10 streamlines were potentially spurious and were deleted from the connection matrix. To examine the influence of the threshold, we tested a range of thresholds from 3 to 10 fibers and results including all network parameters are shown in Table A1. Although the network efficiency decreased as the sparsity decreased, the small worldness of the network remained intact. Most importantly, the group differences among adjacent age groups also remained consistent across all applied thresholds which indicates that the network comparison results are not sensitive to the threshold choices. Cortical regions in our study are defined by an a priori volumetric template (AAL) that was employed to automatically parcellate the entire cerebral cortex into different regions. Different templates used in various studies might cause discrepancy in the specific results, though the main trend of the network properties is expected to remain intact.
Various weighting functions for cortical-cortical connections have been applied in previous brain network analyses of brain development including 1/mean diffusivity (Hagmann et al., 2010) and proportional FN (Dennis et al., 2013), whereas we used the product of tract FA (known to increase exponentially with development over this age range but at unique rates per tract—Lebel et al., 2008) and AAL regional volume-normalized FN that has been used by others in studies of Alzheimer's Disease and aging (Lo et al., 2010; Brown et al., 2011). Other diffusion indices such as mean diffusivity (MD), axial diffusivity (AD) or radial diffusivity (RD) could have been examined instead of FA as a basis of “weighting” the network connections. However, to our best knowledge, while a few studies have applied MD as an edge weighting function (Hagmann et al., 2010; Li et al., 2012), none have used AD or RD. While changes in MD and FA for the WM typically occur together during maturation, with MD values decreasing and FA values increasing, the processes by which the two parameters change are theoretically different (Schmithorst et al., 2002; Huppi and Dubois, 2006) and they do not change at the same rate (Lebel et al., 2008). Axial and RD, under certain circumstances, may be more specific to underlying biological processes, such as myelin and axonal changes (Song et al., 2002). A recent study has demonstrated changes of FA in corticospinal tract and anterior corona radiata during development (2 to 40 years) that were attributed to the different rate changes in AD and RD (Faria et al., 2010). Thus, one would expect different WM network organization if using different weighting functions. Therefore, future studies could consider using multiple diffusion tensor measures such as FA, MD, AD and RD.
In conclusion, a graph theoretical approach was used to demonstrate age-related alterations in the large scale network properties of the developing WM network from early childhood (6 years) to adulthood (30 years). It was shown that increased network weight signifies a reshaping of the WM network from early childhood to late childhood with increased integration and decreased segregation. These findings are compatible with the notion that structural and functional brain networks become stable after late childhood. Our results also have implications for understanding how the modular organizational alterations in the large-scale structural brain networks underlie maturation of cognitive function in brain development. This study may pave the way for developing novel methods for analyzing disrupted brain connectivity in neurodevelopmental disorders.
Conflict of Interest Statement
The authors declare that the research was conducted in the absence of any commercial or financial relationships that could be construed as a potential conflict of interest.
Acknowledgments
Operating funding from the Canadian Institutes of Health Research, and salary awards from the China Scholarship Council (Min Liu) and Alberta Innovates—Health Solutions (Christian Beaulieu).
References
Achard, S., and Bullmore, E. (2007). Efficiency and cost of economical brain functional networks. PLoS Comput. Biol. 3:e17. doi: 10.1371/journal.pcbi.0030017
Achard, S., Salvador, R., Whitcher, B., Suckling, J., and Bullmore, E. (2006). A resilient, low-frequency, small-world human brain functional network with highly connected association cortical hubs. J. Neurosci. 26, 63–72. doi: 10.1523/JNEUROSCI.3874-05.2006
Basser, P. J., Pajevic, S., Pierpaoli, C., Duda, J., and Aldroubi, A. (2000). In vivo fiber tractography using DT-MRI data. Magn. Reson. Med. 44, 625–632. doi: 10.1002/1522-2594(200010)44:4<625::AID-MRM17>3.0.CO;2-O
Bassett, D. S., Meyer-Lindenberg, A., Achard, S., Duke, T., and Bullmore, E. (2006). Adaptive reconfiguration of fractal small-world human brain functional networks. Proc. Natl. Acad. Sci. U.S.A. 103, 19518–19523. doi: 10.1073/pnas.0606005103
Brown, J. A., Terashima, K. H., Burggren, A. C., Ercoli, L. M., Miller, K. J., Small, G. W., et al. (2011). Brain network local interconnectivity loss in aging APOE-4 allele carriers. Proc. Natl. Acad. Sci. U.S.A. 108, 20760–20765. doi: 10.1073/pnas.1109038108
Bullmore, E., and Sporns, O. (2009). Complex brain networks: graph theoretical analysis of structural and functional systems. Nat. Rev. 10, 186–198. doi: 10.1038/nrn2575
Chen, Z. J., He, Y., Rosa-Neto, P., Germann, J., and Evans, A. C. (2008). Revealing modular architecture of human brain structural networks by using cortical thickness from MRI. Cereb. Cortex 18, 2374–2381. doi: 10.1093/cercor/bhn003
Chen, Z. J., He, Y., Rosa-Neto, P., Gong, G., and Evans, A. C. (2011). Age-related alterations in the modular organization of structural cortical network by using cortical thickness from MRI. Neuroimage 56, 235–245. doi: 10.1016/j.neuroimage.2011.01.010
Clauset, A., Newman, M. E., and Moore, C. (2004). Finding community structure in very large networks. Phys. Rev. E 70, 066111. doi: 10.1103/PhysRevE.70.066111
Danon, L., Diaz-Guilera, A., and Arenas, A. (2006). The effect of size heterogeneity on community identification in complex networks. J. Stat. Mech. Theory Exp. P11010. doi: 10.1088/1742-5468/2006/11/P11010
Dennis, E. L., Jahanshad, N., McMahon, K. L., de Zubicaray, G. I., Martin, N. G., Hickie, I. B., et al. (2013). Development of brain structural connectivity between ages 12 and 30: a 4-Tesla diffusion imaging study in 439 adolescents and adults. Neuroimage 64, 671–684. doi: 10.1016/j.neuroimage.2012.09.004
Duncan, J., and Owen, A., M. (2000). Common regions of the human frontal lobe recruited by diverse cognitive demands. Trends Neurosci. 23, 475–483. doi: 10.1016/S0166-2236(00)01633-7
Fair, D. A., Cohen, A. L., Dosenbach, N. U., Church, J. A., Miezin, F. M., Barch, D. M., et al. (2008). The maturing architecture of the brain's default network. Proc. Natl. Acad. Sci. U.S.A. 105, 4028–4032. doi: 10.1073/pnas.0800376105
Fair, D. A., Cohen, A. L., Power, J. D., Dosenbach, N. U., Church, J. A., Miezin, F. M., et al. (2009). Functional brain networks develop from a “local to distributed” organization. PLoS Comput. Biol. 5:e1000381. doi: 10.1371/journal.pcbi.1000381
Fan, Y., Shi, F., Smith, J. K., Lin, W., Gilmore, J. H., and Shen, D. (2011). Brain anatomical networks in early human brain development. Neuroimage 54, 1862–1871. doi: 10.1016/j.neuroimage.2010.07.025
Faria, A. V., Zhang, J., Oishi, K., Li, X., Jiang, H., Akhter, K., et al. (2010). Atlas-based analysis of neurodevelopment from infancy to adulthood using diffusion tensor imaging and applications for automated abnormality detection. Neuroimage 52, 415–428. doi: 10.1016/j.neuroimage.2010.04.238
Ferrarini, L., Veer, I. M., Baerends, E., van Tol, M. J., Renken, R. J., van der Wee, N. J., et al. (2009). Hierarchical functional modularity in the resting-state human brain. Hum. Brain Mapp. 30, 2220–2231. doi: 10.1002/hbm.20663
Genovese, C. R., Lazar, N. A., and Nichols, T. (2002). Thresholding of statistical maps in functional neuroimaging using the false discovery rate. Neuroimage 15, 870–878. doi: 10.1006/nimg.2001.1037
Giedd, J. N., Blumenthal, J., Jeffries, N. O., Castellanos, F. X., Liu, H., Zijdenbos, A., et al. (1999). Brain development during childhood and adolescence: a longitudinal MRI study. Nat. Neurosci. 2, 861–863. doi: 10.1038/13158
Giorgio, A., Watkins, K. E., Douaud, G., James, A. C., James, S., De Stefano, N., et al. (2008). Changes in white matter microstructure during adolescence. Neuroimage 39, 52–61. doi: 10.1016/j.neuroimage.2007.07.043
Gogtay, N., Giedd, J. N., Lusk, L., Hayashi, K. M., Greenstein, D., Vaituzis, A. C., et al. (2004). Dynamic mapping of human cortical development during childhood through early adulthood. Proc. Natl. Acad. Sci. U.S.A. 101, 8174–8179. doi: 10.1073/pnas.0402680101
Gong, G., He, Y., Concha, L., Lebel, C., Gross, D. W., Evans, A. C., et al. (2009). Mapping anatomical connectivity patterns of human cerebral cortex using in vivo diffusion tensor imaging tractography. Cereb. Cortex 19, 524–536. doi: 10.1093/cercor/bhn102
Good, C. D., Johnsrude, I. S., Ashburner, J., Henson, R. N., Friston, K. J., and Frackowiak, R. S. (2001). A voxel-based morphometric study of ageing in 465 normal adult human brains. Neuroimage 14, 21–36. doi: 10.1006/nimg.2001.0786
Greicius, M. D., Krasnow, B., Reiss, A. L., and Menon, V. (2003). Functional connectivity in the resting brain: a network analysis of the default mode hypothesis. Proc. Natl. Acad. Sci. U.S.A. 100, 253–258. doi: 10.1073/pnas.0135058100
Grill-Spector, K., Golarai, G., and Gabrieli, J. (2008). Developmental neuroimaging of the human ventral visual cortex. Trends Cogn. Sci. 12, 152–162. doi: 10.1016/j.tics.2008.01.009
Guimera, R., and Amaral, L. A. (2005). Cartography of complex networks: modules and universal roles. J. Stat. Mech. 2005, nihpa35573. doi: 10.1088/1742-5468/2005/02/P02001
Guimera, R., and Nunes Amaral, L. A. (2005). Functional cartography of complex metabolic networks. Nature 433, 895–900. doi: 10.1038/nature03288
Hagmann, P., Cammoun, L., Gigandet, X., Meuli, R., Honey, C. J., Wedeen, V. J., et al. (2008). Mapping the structural core of human cerebral cortex. PLoS Biol. 6:e159. doi: 10.1371/journal.pbio.0060159
Hagmann, P., Sporns, O., Madan, N., Cammoun, L., Pienaar, R., Wedeen, V. J., et al. (2010). White matter maturation reshapes structural connectivity in the late developing human brain. Proc. Natl. Acad. Sci. U.S.A. 107, 19067–19072. doi: 10.1073/pnas.1009073107
He, Y., Chen, Z. J., and Evans, A. C. (2007). Small-world anatomical networks in the human brain revealed by cortical thickness from MRI. Cereb. Cortex 17, 2407–2419. doi: 10.1093/cercor/bhl149
He, Y., and Evans, A. (2010). Graph theoretical modeling of brain connectivity. Curr. Opin. Neurol. 23, 341–350. doi: 10.1097/WCO.0b013e32833aa567
He, Y., Wang, J., Wang, L., Chen, Z. J., Yan, C., Yang, H., et al. (2009). Uncovering intrinsic modular organization of spontaneous brain activity in humans. PLoS ONE 4:e5226. doi: 10.1371/journal.pone.0005226
Hilgetag, C. C., O'Neill, M. A., and Young, M. P. (2000). Hierarchical organization of macaque and cat cortical sensory systems explored with a novel network processor. Philos. Trans. R. Soc. Lond. B 355, 71–89. doi: 10.1098/rstb.2000.0550
Huppi, P. S., and Dubois, J. (2006). Diffusion tensor imaging of brain development. Semin. Fetal Neonatal Med. 11, 489–497. doi: 10.1016/j.siny.2006.07.006
Khundrakpam, B. S., Reid, A., Brauer, J., Carbonell, F., Lewis, J., Ameis, S., et al. (2013). Developmental changes in organization of structural brain networks. Cereb. Cortex 23, 2072–2085. doi: 10.1093/cercor/bhs187
Kringelbach, M. L. (2005). The human orbitofrontal cortex: linking reward to hedonic experience. Nat. Rev. 6, 691–702. doi: 10.1038/nrn1747
Landman, B. A., Farrell, J. A., Jones, C. K., Smith, S. A., Prince, J. L., and Mori, S. (2007). Effects of diffusion weighting schemes on the reproducibility of DTI-derived fractional anisotropy, mean diffusivity, and principal eigenvector measurements at 1.5T. NeuroImage 36, 1123–1138. doi: 10.1016/j.neuroimage.2007.02.056
Latora, V., and Marchiori, M. (2001). Efficient behavior of small-world networks. Phys. Rev. Lett. 87, 198701. doi: 10.1103/PhysRevLett.87.198701
Latora, V., and Marchiori, M. (2003). Economic small-world behavior in weighted networks. Eur. Phys. J. B 32, 249–263. doi: 10.1140/epjb/e2003-00095-5
Lebel, C., and Beaulieu, C. (2011). Longitudinal development of human brain wiring continues from childhood into adulthood. J. Neurosci. 31, 10937–10947. doi: 10.1523/JNEUROSCI.5302-10.2011
Lebel, C., Walker, L., Leemans, A., Phillips, L., and Beaulieu, C. (2008). Microstructural maturation of the human brain from childhood to adulthood. Neuroimage 40, 1044–1055. doi: 10.1016/j.neuroimage.2007.12.053
Lebel, C., Benner, T., and Beaulieu, C. (2012). Six is enough? Comparison of diffusion parameters measured using six or more diffusion-encoding gradient directions with deterministic tractography. Magn Reson Med 68, 474–483. doi: 10.1002/mrm.23254
Li, Y., Jewells, V., Kim, M., Chen, Y., Moon, A., Armao, D., et al. (2012). Diffusion tensor imaging based network analysis detects alterations of neuroconnectivity in patients with clinically early relapsing-remitting multiple sclerosis. Hum. Brain Mapp. doi: 10.1002/hbm.22158. [Epub ahead of print].
Lo, C. Y., Wang, P. N., Chou, K. H., Wang, J., He, Y., and Lin, C. P. (2010). Diffusion tensor tractography reveals abnormal topological organization in structural cortical networks in Alzheimer's disease. J. Neurosci. 30, 16876–16885. doi: 10.1523/JNEUROSCI.4136-10.2010
Maslov, S., and Sneppen, K. (2002). Specificity and stability in topology of protein networks. Science 296, 910–913. doi: 10.1126/science.1065103
Meunier, D., Achard, S., Morcom, A., and Bullmore, E. (2009). Age-related changes in modular organization of human brain functional networks. Neuroimage 44, 715–723. doi: 10.1016/j.neuroimage.2008.09.062
Newman, M. E. (2003). The structure and function of Complex Networks. SIAM Rev. 45, 167–256. doi: 10.1137/S003614450342480
Newman, M. E. (2004). Analysis of weighted networks. Phys. Rev. E 70, 056131. doi: 10.1103/PhysRevE.70.056131
Newman, M. E. (2006). Modularity and community structure in networks. Proc. Natl. Acad. Sci. U.S.A. 103, 8577–8582. doi: 10.1073/pnas.0601602103
Onnela, J. P., Saramaki, J., Kertesz, J., and Kaski, K. (2005). Intensity and coherence of motifs in weighted complex networks. Phys. Rev. 71, 065103. doi: 10.1103/PhysRevE.71.065103
Paus, T., Zijdenbos, A., Worsley, K., Collins, D. L., Blumenthal, J., Giedd, J. N., et al. (1999). Structural maturation of neural pathways in children and adolescents: in vivo study. Science 283, 1908–1911. doi: 10.1126/science.283.5409.1908
Raichle, M. E., MacLeod, A. M., Snyder, A. Z., Powers, W. J., Gusnard, D. A., and Shulman, G. L. (2001). A default mode of brain function. Proc. Natl. Acad. Sci. U.S.A. 98, 676–682. doi: 10.1073/pnas.98.2.676
Sales-Pardo, M., Guimera, R., Moreira, A. A., and Amaral, L. A. (2007). Extracting the hierarchical organization of complex systems. Proc. Natl. Acad. Sci. U.S.A. 104, 15224–15229. doi: 10.1073/pnas.0703740104
Salvador, R., Suckling, J., Coleman, M. R., Pickard, J. D., Menon, D., and Bullmore, E. (2005). Neurophysiological architecture of functional magnetic resonance images of human brain. Cereb. Cortex 15, 1332–1342. doi: 10.1093/cercor/bhi016
Schmithorst, V. J., Wilke, M., Dardzinski, B. J., and Holland, S. K. (2002). Correlation of white matter diffusivity and anisotropy with age during childhood and adolescence: a cross-sectional diffusion-tensor MR imaging study. Radiology 222, 212–218. doi: 10.1148/radiol.2221010626
Shaw, P., Kabani, N. J., Lerch, J. P., Eckstrand, K., Lenroot, R., Gogtay, N., et al. (2008). Neurodevelopmental trajectories of the human cerebral cortex. J. Neurosci. 28, 3586–3594. doi: 10.1523/JNEUROSCI.5309-07.2008
Shu, N., Liu, Y., Li, K., Duan, Y., Wang, J., Yu, C., et al. (2011). Diffusion tensor tractography reveals disrupted topological efficiency in white matter structural networks in multiple sclerosis. Cereb. Cortex 21, 2565–2577. doi: 10.1093/cercor/bhr039
Snook, L., Paulson, L. A., Roy, D., Phillips, L., and Beaulieu, C. (2005). Diffusion tensor imaging of neurodevelopment in children and young adults. Neuroimage 26, 1164–1173. doi: 10.1016/j.neuroimage.2005.03.016
Song, S. K., Sun, S. W., Ramsbottom, M. J., Chang, C., Russell, J., and Cross, A. H. (2002). Dysmyelination revealed through MRI as increased radial (but unchanged axial) diffusion of water. Neuroimage 17, 1429–1436. doi: 10.1006/nimg.2002.1267
Sowell, E. R., Thompson, P. M., Leonard, C. M., Welcome, S. E., Kan, E., and Toga, A. W. (2004). Longitudinal mapping of cortical thickness and brain growth in normal children. J. Neurosci. 24, 8223–8231. doi: 10.1523/JNEUROSCI.1798-04.2004
Stam, C. J. (2004). Functional connectivity patterns of human magnetoencephalographic recordings: a ‘small-world’ network. Neurosci. Lett. 355, 25–28. doi: 10.1016/j.neulet.2003.10.063
Supekar, K., Musen, M., and Menon, V. (2009). Development of large-scale functional brain networks in children. PLoS Biol. 7:e1000157. doi: 10.1371/journal.pbio.1000157
Tamnes, C. K., Ostby, Y., Fjell, A. M., Westlye, L. T., Due-Tonnessen, P., and Walhovd, K. B. (2010). Brain maturation in adolescence and young adulthood: regional age-related changes in cortical thickness and white matter volume and microstructure. Cereb. Cortex 20, 534–548. doi: 10.1093/cercor/bhp118
Thompson, P. M., Giedd, J. N., Woods, R. P., MacDonald, D., Evans, A. C., and Toga, A. W. (2000). Growth patterns in the developing brain detected by using continuum mechanical tensor maps. Nature 404, 190–193. doi: 10.1038/35004593
Toga, A. W., and Thompson, P. M. (2003). Mapping brain asymmetry. Nat. Rev. 4, 37–48. doi: 10.1038/nrn1009
Tournier, J. D., Yeh, C. H., Calamante, F., Cho, K. H., Connelly, A., and Lin, C. P. (2008). Resolving crossing fibres using constrained spherical deconvolution: validation using diffusion-weighted imaging phantom data. Neuroimage 42, 617–625. doi: 10.1016/j.neuroimage.2008.05.002
Tzourio-Mazoyer, N., Landeau, B., Papathanassiou, D., Crivello, F., Etard, O., Delcroix, N., et al. (2002). Automated anatomical labeling of activations in SPM using a macroscopic anatomical parcellation of the MNI MRI single-subject brain. Neuroimage 15, 273–289. doi: 10.1006/nimg.2001.0978
Valencia, M., Pastor, M. A., Fernandez-Seara, M. A., Artieda, J., Martinerie, J., and Chavez, M. (2009). Complex modular structure of large-scale brain networks. Chaos 19, 023119. doi: 10.1063/1.3129783
van den Heuvel, M. P., Kahn, R. S., Goni, J., and Sporns, O. (2012). High-cost, high-capacity backbone for global brain communication. Proc. Natl. Acad. Sci. U.S.A. 109, 11372–11377. doi: 10.1073/pnas.1203593109
Vogel, A. C., Power, J. D., Petersen, S. E., and Schlaggar, B. L. (2010). Development of the brain's functional network architecture. Neuropsychol. Rev. 20, 362–375. doi: 10.1007/s11065-010-9145-7
Watts, D. J., and Strogatz, S. H. (1998). Collective dynamics of ‘small-world’ networks. Nature 393, 440–442. doi: 10.1038/30918
Wu, K., Taki, Y., Sato, K., Hashizume, H., Sassa, Y., Takeuchi, H., et al. (2013). Topological organization of functional brain networks in healthy children: differences in relation to age, sex, and intelligence. PLoS ONE 8:e55347. doi: 10.1371/journal.pone.0055347
Yap, P. T., Fan, Y., Chen, Y., Gilmore, J. H., Lin, W., and Shen, D. (2011). Development trends of white matter connectivity in the first years of life. PLoS ONE 6:e24678. doi: 10.1371/journal.pone.0024678
Zeisel, A., Zuk, O., and Domany, E. (2011). Fdr control with adaptive procedures and fdr monotonicity. Ann. Appl. Stat. 5, 943–968. doi: 10.1214/10-AOAS399
Zhou, C., Zemanova, L., Zamora, G., Hilgetag, C. C., and Kurths, J. (2006). Hierarchical organization unveiled by functional connectivity in complex brain networks. Phys. Rev. Lett. 97, 238103. doi: 10.1103/PhysRevLett.97.238103
Zielinski, B. A., Gennatas, E. D., Zhou, J., and Seeley, W. W. (2010). Network-level structural covariance in the developing brain. Proc. Natl. Acad. Sci. U.S.A. 107, 18191–18196. doi: 10.1073/pnas.1003109107
Appendix
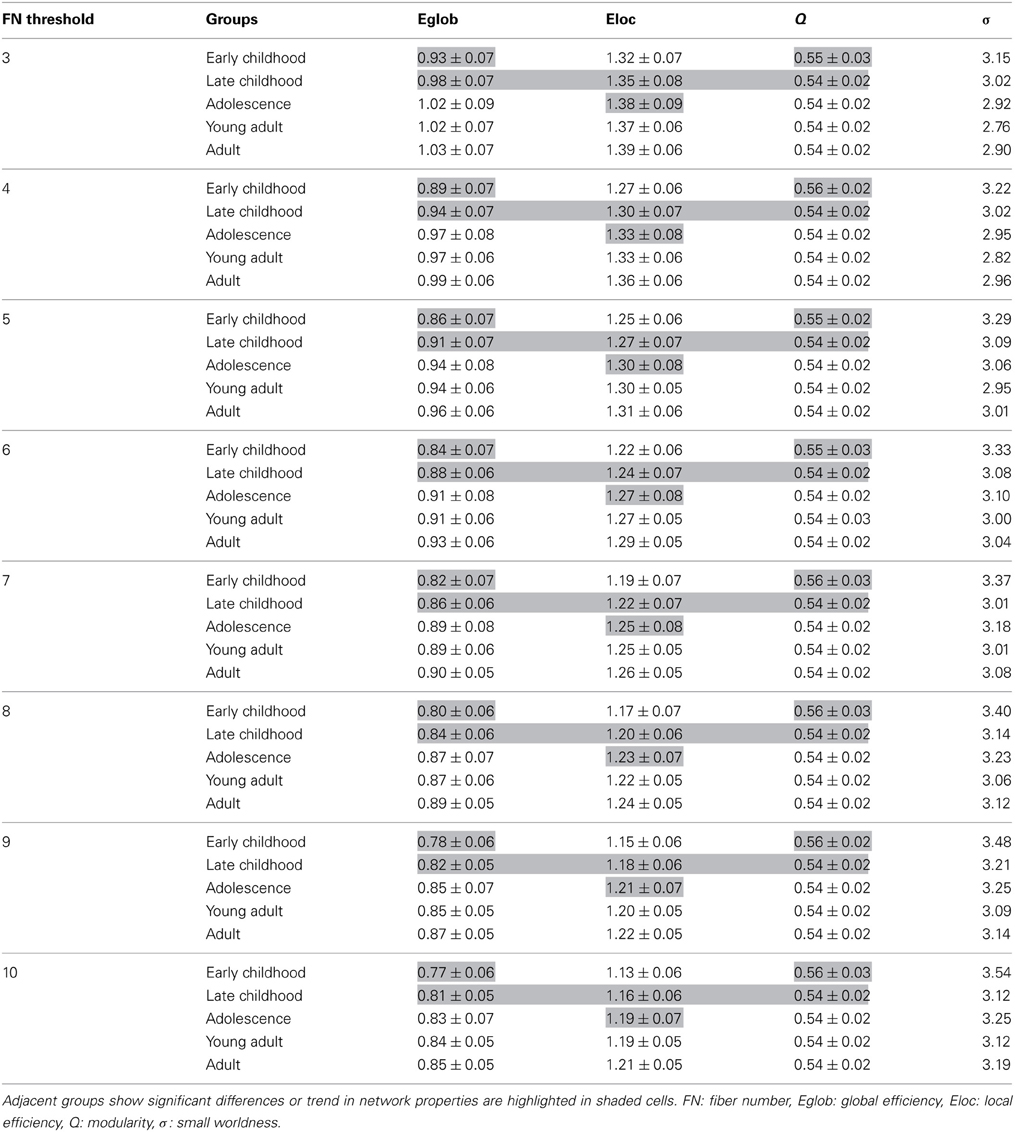
Table A1. White matter network parameters derived from different fiber-number node-to-node connection thresholds in all age groups.
Keywords: graph theory, neurodevelopment, anatomical connectivity, modular networks, small world network
Citation: Chen Z, Liu M, Gross DW and Beaulieu C (2013) Graph theoretical analysis of developmental patterns of the white matter network. Front. Hum. Neurosci. 7:716. doi: 10.3389/fnhum.2013.00716
Received: 01 June 2013; Accepted: 09 October 2013;
Published online: 01 November 2013.
Edited by:
Yong He, Beijing Normal University, ChinaReviewed by:
Hao Huang, University of Texas Southwetern Medical Center, USAPew-Thian Yap, University of North Carolina, USA
Copyright © 2013 Chen, Liu, Gross and Beaulieu. This is an open-access article distributed under the terms of the Creative Commons Attribution License (CC BY). The use, distribution or reproduction in other forums is permitted, provided the original author(s) or licensor are credited and that the original publication in this journal is cited, in accordance with accepted academic practice. No use, distribution or reproduction is permitted which does not comply with these terms.
*Correspondence: Christian Beaulieu, Department of Biomedical Engineering, 1098 Research Transition Facility, University of Alberta, 8308-114 Street, Edmonton, AB T6G 2V2, Canada e-mail: christian.beaulieu@ualberta.ca