
- 1 State Key Laboratory of Brain and Cognitive Science, Institute of Psychology, Chinese Academy of Sciences, Beijing, China
- 2 Department of Psychology, Washington University, St. Louis, MO, USA
In the present study subjects viewed streams of rapid serially presented characters and searched for a target digit. After presentation of the target digit, a second target consisting of an orientation singleton (Experiment 1) or a second digit (Experiment 2) was presented at one of several distances from the first target. The attentional blink (AB) impaired performance on the second target with the effect being strongest at distances somewhat removed from the first target location. These results are consistent with lateral inhibition theory and help to resolve some fundamental questions about the spatial distribution of the AB.
Introduction
Visual attention plays a critical role in selecting important information from the environment. Several models such as Posner’s spotlight metaphor of attention (Posner, 1980), the zoom-lens model (Eriksen and St. James, 1986), and the gradient structure of attention (LaBerge and Brown, 1989) have been proposed to explain the empirical results of cuing studies. All of them assume that the spatial component of attention is a facilitative mechanism at the focus of attention, which make the processing of stimuli faster and more accurate.
It also is clear that an important component of attentional selection involves inhibitory mechanisms. For example, inhibition of return prevents people from re-sampling recently attended locations (Posner et al., 1985), presumably in order to improve the efficiency of visual search. Of interest in the present study is the dynamic deployment of the attentional blink (AB). The AB is an impairment in the detection or identification of a second target that follows within about 500 ms of an earlier target (Shapiro et al., 1994, 1997; Chun and Potter, 1995; Raymond et al., 1995). Recent studies on the AB have focused on the spatial distribution of the associated impairment and that is the focus of the present study.
Some early insights into the dynamic distribution of the AB have come from studies of “lag-1 sparing.” Lag-1 sparing refers to the fact that perception of the second of two targets in a rapid stream is often not suppressed if the second target follows immediately after the first (“lag 1”). Visser et al. (1999 conducted a meta-analysis of previous AB work and found that typical Lag-1 sparing would disappear when the first target (T1) and the second target (T2) appeared in different locations. This result suggests that the impairment caused by the AB may be greatest away from the previously attended location (i.e., T1’s location), at least initially. Consistent with that conclusion, Juola et al. (2004) showed a location switch cost in the AB paradigm: bigger impairment in detecting the second target if it appeared in a location different from the first. Using the line motion illusion, Kawahara (2002) found perceptual facilitation at the first target’s location. And Olivers (2004) found that the AB induced a systematic localization bias toward the fovea (T1 location) – at greater eccentricities, the suppression induced by the AB was stronger. Jefferies et al. (2007) asked participants to identify two letters embedded in two streams of digits with 3.5° of spatial separation. They found that performance on T2 was better when the two targets were in the same stream than when the two targets were in different streams, at least within first 300 ms of AB (Jefferies et al., 2007).
The above results just reviewed provide a consistent view of the spatial distribution of AB as being strongest at locations away from the location of the first target (T1) shortly after T1, and being evenly distributed across the scene at long lags after T1 (in other words, attention was focused on the T1 location at a short lag and diffused homogeneously across the scene at long lags). Such a spatial distribution may be beneficial because it allows an observer to continue to acquire potentially relevant information from an initially attended location, while at the same time suppressing distracting information from nearby peripheral locations. To explain such a spatial distribution of AB, a dynamic zoom-lens model was proposed. More specifically, participants are thought to automatically narrow down their focal attention to the T1 location once they detect T1, resulting in higher T2 accuracy at the T1 location than that at other locations initially. This attentional bias toward the T1 location lasts about 300–600 ms depending on participants’ expectation (Jefferies et al., 2007) and the spatial separation between T1 and T2 (Jefferies and Di Lollo, 2009).
Nevertheless, some results from Kristjansson and Nakayama (2002) appear to be inconsistent with these conclusions. Those researchers presented seven streams of rapidly changing letters on a circle centered on fixation. Two digits were to be identified. These digits were slightly brighter than the other ones, and could occur in the same location on a subset of the trials. Kristjansson and Nakayama (2002) found that the AB did indeed extend beyond the location of T1 because detection of T2 was impaired across the whole visual field at short lags. However, subjects were poorest to detect T2 when it appeared in the same location as T1. In other words, the AB was the strongest at the previously attended location. More importantly, they found that T2 performance was best at location which was 12° separated from T1, indicating weakest AB at location far away from T1 location. Based on that result, Kristjansson and Nakayama proposed that lateral inhibition account for the strong suppression at T1 location and surrounding area. And they also suggested that early selection by spatial attention was at least one of most important causes of AB effects.
The Kristjansson and Nakayama (2002) results just described are inconsistent with other results mentioned earlier that suggested that AB was weakest at the location of T1. Most previous AB studies showed that T2 performance decrease as T1–T2 distance increase which was consistent with dynamic zoom-lens model. In sharp contrast, Kristjansson and Nakayama (2002) found that T2 performance increase monotonously as T1–T2 distance increase and proposed a lateral inhibition model. This discrepancy was the focus of the present study. Present study re-examined spatial distribution of AB in order to test two fore-mentioned models. In particular, we consider here the possibility that one aspect of the Kristjansson and Nakayama method – the use of the identical task for T1 and T2, may have led to the pattern of results that they reported. In Experiment 1 of the Kristjansson and Nakayama (2002) study, both T1 and T2 were digits and were signaled by an increase in luminance compared to the other elements in the RSVP streams. These two physically similar targets might cause an enhanced masking effect on each other when they share the same location compared with when they appear at different locations (Maki et al., 2003). As a result, the strongest impairment observed by Kristjansson and Nakayama (2002) at the T1 location may be contaminated by increased visual masking at T1 location and not pure effects of the AB. To reduce strong visual interference between T1 and T2, the two target-detection tasks in Experiment 1 of present study were made to be very different from one another. However, the use of two different tasks might induce a task switch cost (Juola et al., 2004) which might also change the spatial distribution of AB. Hence, Experiment 2 also used two identical tasks to study the spatial distribution of AB without task switch costs.
Experiment 1
The experiment design was similar to that of Kristjansson and Nakayama’s (2002) study but with some key differences. In the present study, we used 12 multiple RSVP streams on a virtual circle with a diameter of 15° to test dynamic deployment of attention during the AB. T1 required identification of a digit. Since an orientation singleton can be affected by the AB (Joseph et al., (1997, 1998; Braun, 1998), we adopted detection of an orientation singleton as the T2 task. Orientation singleton detection, instead of a digit identification task used in Kristjansson and Nakayama’s study, was adopted in the present experiment for two reasons. First, an orientation singleton (T2) is distinctive from a bright digit (T1), thus reducing the possibility of confusion between two targets when they share same location. More importantly, the detection of an orientation singleton relies on detecting a textural anomaly in the scene, which encourages subjects to distribute their attention diffusely over a broad area rather than focus on one specific location. Especially when the orientation singleton is absent from the visual scene, subjects have to expand their attention to encompass all 12 streams of stimuli to confirm the absence of an orientation singleton. We mainly used accuracy of T2 when the orientation singleton was present (the hit rate of T2) as the measure of attentional allocation during AB. In the present experiment T1 and T2 were separated by one of four physical separations, and one of three temporal lags.
Methods
Subjects
Thirty-six undergraduates from Washington University participated in this experiment for course credit. They had no prior experience in similar experiments. Subjects did not receive extensive practice in the present task because such practice has been shown to reduce the magnitude of the AB (Braun, 1998). All observers had normal or corrected to normal vision.
Apparatus, stimuli, and procedure
Stimuli were presented on a 19″ CRT at a resolution of 1024 × 768 pixels with a 100 Hz refresh rate. The viewing distance was 60 cm. The sequence of events on each trial is illustrated in Figure 1. Each trial began with the presentation of a fixation cross for 600 ms. The fixation cross was followed by 12 upper-case gray letters (1.3° in height) presented at 12 evenly spaced locations on a virtual circle with a diameter of 15°. Letters were randomly chosen from all letters in the alphabet except the letter I. Each of the letters was part of an RSVP stream. All letters were changed simultaneously every 140 ms. The first target, T1, was a white digit randomly chosen between 2 and 9. It could appear in the 10, 11, or 12th frame in the stream, and had an equal chance of appearing at one of four locations: 12 o’clock (top), 9 o’clock (left), 6 o’clock (bottom), and 3 o’clock (right).
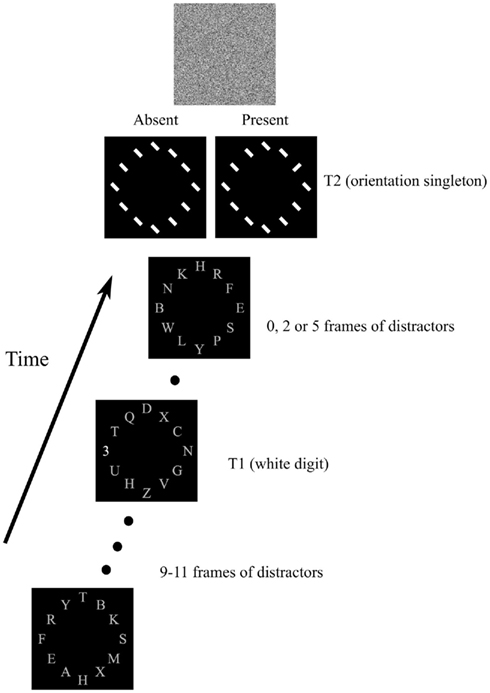
Figure 1. Sequence of events in the experiment. Twelve streams of gray capital letters were presented on a virtual circle. T1 was a white digit (shown at 6 o’clock in the example). The array of tilted white bars would sometimes contain an orientation singleton (T2). See text for additional details.
The letters continued to change at the same rate after T1 was presented. Either one, three, or six frames after T1 the array of letters was replaced by a display that contained 12 line segments (width 0.2° and height of 1.7°), with each line segment occupying a location previously occupied by a letter. The line segments were oriented 45° to the right or left of vertical. One-half of the trials contained an orientation singleton – one line segment that differed in orientation from all of the others. On the other trials all line segments had the same orientation. The location of the orientation singleton depended on the first target’s location. In particular, if T1 was at an even-numbered clock location (i.e., 12 o’clock or 6 o’clock) then T2 could be located at any even-numbered clock location (i.e., 2 o’clock, 4 o’clock, 6 o’clock, 8 o’clock, 10 o’clock, and 12 o’clock). If T1 was in an odd-numbered location then T2 would appear at one of the odd-numbered clock locations. This arrangement resulted in visual angles between T1 and T2 of 0°, 7.5°, 13°, and 15°.
The T2 line segments were presented for 80 ms and then immediately followed by a mask that consisted of random white squares on the black background. After the mask subjects were asked first to report the identity of T1, and they were then asked whether an orientation singleton had or had not been present. Subjects provided their responses using the computer keyboard.
Design
One group of 12 subjects served in a session in which the lag between T1 and T2 was either one or three elements (short lag group, SL group). Another group of 12 served with lags of one and six elements (long lag group, LL group). Each of these groups participated in 48 trials as practice followed by 384 test trials. The orientation singleton was presented in half of the trials. The other half consisted of the singleton absent condition. Lag and distance between T1 and T2 were two within-subject variables. Sixteen trials were assigned to each combination of lag (Lag 1 or Lag 3 in the SL group; Lag 1 or Lag 6 in the LL group) and T2 location (six possible locations). Thus there were 32 trials at each of the intermediate distances (7.5° and 13°) and 16 trials at the 0° and 15° distances. The test trials were randomly ordered and divided into four blocks, with a short break between each block.
A third group of 12 observers served with lags of 1, 3, and 6 but reported only the presence or absence of the orientation singleton. These subjects served as the control group. Participants in this group received 48 practice trials and 432 test trials divided into four blocks.
Results
Mean accuracy for T1 in the SL and LL groups was 92.6 and 92.7% respectively. For the SL and LL groups, T1 accuracy was 92.2 and 92.6%, respectively, when the orientation singleton was present and 93.3 and 92.9% when the orientation singleton was absent from the T2 task. T-tests showed that the presence of an orientation singleton in T2 did not significantly change T1 accuracy in the SL or the LL group, t(11) = 0.823, p > 0.05; t(11) = 0.266, p > 0.05, respectively. T1 accuracy was also analyzed using a repeated measures ANOVA for trials on which an orientation singleton was present. Results showed no main effects or interactions involving the distance between T1 and T2 or the lag. In the LL group, the main effects of lag and distance were not significant, F(1,11) < 1; F(3,33) = 1.74, p > 0.05 respectively. Nor did the two factors interact, F(3,33) < 1. In the SL group there was also no main effect of lag or distance, F(1,11) < 1.; F(3,33) = 2.517, p > 0.05 respectively, or an interaction, F(3,33) < 1. Thus, accuracy of T1 discrimination was high, and did not depend on the experimental manipulation.
Most importantly, we examined the ability of subjects to detect T2 (when it was present) given correct identification of T1. Those results are shown in Figure 2A,B where T2 accuracy is plotted as a function of lag and distance between T1 and T2, respectively for the LL and SL groups. For the LL group (Figure 2A) there was a main effect of lag F(1,11) = 17.335, p = 0.002,  , with performance poorer at lag-1 compared to lag-6. This reveals the presence of a large AB effect. The main effect of distance was also significant, F(3,33) = 24.718, p < 0.001,
  . Post hoc tests revealed that performance at T1–T2 separations of 0° and 15° was significantly better than that at distances of 7.5° and 13°. There were significant differences in the proportion correct between 0° and 7.5° (mean difference = 0.167, SE = 0.025, p < 0.005), and 0° and 13° (mean difference = 0.148, SE = 0.025, p < 0.005). There were also significant differences between 15° and 7.5° (mean difference = 0.129, SE = 0.018, p < 0.005), and 15° and 13° (mean difference = 0.110, SE = 0.027, p < 0.005). And, the interaction between lag and distance was also significant. F(3,33) = 7.333, p = 0.001,
  , mainly due to a more even distribution of attention across the different locations at lag 6 than at lag 1. Most importantly, this interaction indicates a greater AB effect for intermediate as opposed to short distances from T1. The correct rejection rate of T2 (when the orientation singleton is absent) for the LL group is also illustrated by open symbols in Figure 2A. The correct rejection rate of T2 at lag 1 was significantly lower than that at lag 6, F(1,11) = 9.443, p = 0.011,
  .
.
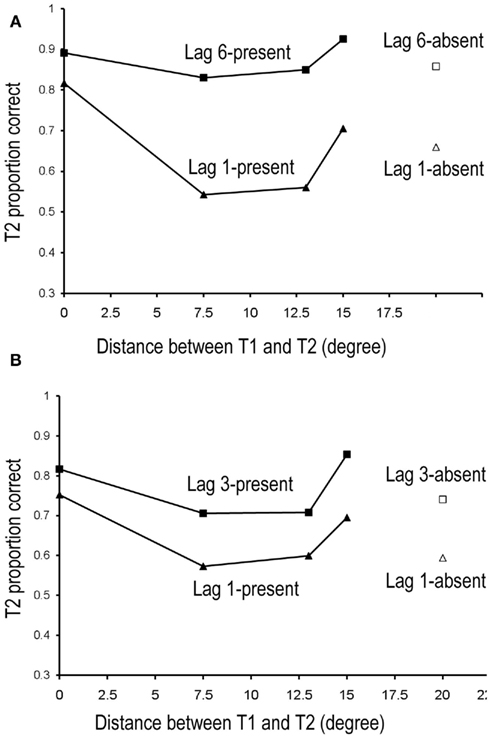
Figure 2. Mean detection accuracy of T2 when participants correctly reported T1 for LL (A) and SL (B) groups in Experiment 1.
Accuracy of T2 for the SL group who served in lag-1 and lag-3 conditions is shown in Figure 2B. As with the LL group, there was a large AB effect with accuracy better at lag 3 than lag 1, F(1,11) = 10.861, p = 0.007,  . The distance between T1 and T2 also yielded a main effect, F(3,33) = 6.569, p = 0.001,
  , with performance at distances of 0° and 15° significantly better than that at distances of 7.5° and 13°. Pairwise comparisons indicated significant differences in the proportion correct between 0° and 7.5° (mean difference = 0.145, SE = 0.054, p < 0.05), and 0° and 13° (mean difference = 0.131, SE = 0.044, p < 0.05). Moreover, there was a significant difference between 15° and 7.5° (mean difference = 0.135, SE = 0.053, p < 0.05), and between 15° and 13° too (mean difference = 0.121, SE = 0.035, p < 0.05). The interaction between Lag and Distance was not significant, F(3,33) = 0.984, p > 0.05,
  , in part because T2 detection at lag 3 may still be affected by the AB. The correct rejection rate of T2 (when orientation singleton was absent) is illustrated by open symbols in Figure 2B. The difference between the correct rejection rate at lag 1 and that at lag 3 approached significance, F(1,11) = 3.472, p = 0.089,
  .
.
The control group served with T1–T2 lags of one, three, and six elements but these subjects detected T2 only. Their hit rate and correct rejection rate for T2 are shown in Figure 3. The hit rate was submitted to ANOVA with T1–T2 lag and T1–T2 distance as two within-subject variables. There was neither a main effect of Lag, F(2,16) = 1.638, p > 0.05; nor a main effect of T1–T2 distance, F(3,24) = 1.202, p > 0.05. The interaction between Lag and Distance was also not significant, F(6,48) = 1.547, p > 0.05.
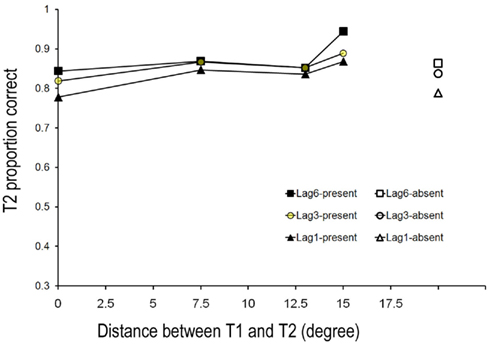
Figure 3. Mean detection accuracy of T2 when participants correctly reported T1 for control groups in Experiment 1.
Discussion
Experiment 1 showed that accuracy at the T1 location was better than that at locations either 7° or 13° away from T1, indicating weakest suppression at the T1 location during the AB. Thus the results of Experiment 1 were partially consistent with an earlier finding that AB was weakest at the T1 location (e.g., Kawahara, 2002; Juola et al., 2004; Olivers, 2004; Jefferies et al., 2007; Jefferies and Di Lollo 2009), and challenge the claim that AB is accompanied by “vigorous suppression of information from the attended site” (Kristjansson and Nakayama, 2002, p. 2047). However, Experiment 1 also demonstrated that detection of an orientation singleton peaked at a distant location 15° from T1 (it was as good as the detection of an orientation singleton at the T1 location). This finding of a U-shaped spatial distribution of AB also challenges an earlier model which suggested that the focus of attention is triggered by T1 to narrow down to the T1 location (Olivers, 2004; Jefferies et al., 2007; Jefferies and Di Lollo 2009).
The U-shaped distribution of AB might be due to two characteristic of Experiment 1. First, Experiment 1 used two quite different tasks for T1 and T2 whereas Kristjansson and Nakayama (2002) used the same task for T1 and T2. Thus in the results from Experiment 1 might reflect a task switch cost (Juola et al., 2004) rather than AB per se. Secondly, in Experiment 1, T2 could appear at one of the four possible T1 locations (12 o’clock, 9 o’clock, 6 o’clock, and 3 o’clock) when the T1–T2 distance was either 0° or 15°, while T2 never appeared at those locations when the T1–T2 distance was 7° or 13°. Thus, participants might simply have prioritized the four T1 locations, resulting in better T2 performance when T1 and T2 were either 0° or 15° apart compared with when they were separated by 7° or 13°. To rule out these two possibilities, we replicated the Kristjansson and Nakayama (2002) study by using exactly the same task for T1 and T2. In Experiment 2a, we slightly reduced the physical saliency of T2 (T2 was brighter than the distractors but less bright than T1) so that we could minimize any visual masking effect of T2 on T1. In Experiment 2b, we set T1 as bright as T2 to closely replicate Kristjansson and Nakayama (2002) study. In addition, T2 could appear at any one of the six T1 locations in Experiment 2a and 2b to ensure that no location would be prioritized.
Experiment 2a
In Experiment 1, we made T1 different from T2 (T1 was a slightly bright digit and T2 was an orientation singleton) in order to reduce visual interference between T1 and T2. However this aspect of Experiment 1 might introduce a task switch cost, making it difficult to assess the AB. Experiment 2a aims to test whether AB remains a U-shaped function of distance when the same task is required for both T1 and T2. In addition, another potential flaw in Experiment 1 was addressed in Experiment 2a. As noted earlier, in Experiment 1 T1 could only appear at four locations (12 o’clock, 9 o’clock, 6 o’clock, and 3 o’clock). When the T1–T2 distance was either 0° or 15°, T2 only appeared at those four T1 locations also. But when T1 and T2 were separated by either 7.5° or 13°, T2 could appeared at locations other than the four T1 locations. Participants in Experiment 1 might have prioritized the T1 locations in order to detect T1 accurately, resulting in better T2 performance when T2 appeared at one of those locations (T1–T2 distance was 0° or 15°) compared with when T2 appeared at another location (T1–T2 distance was 7.5° or 13°). Experiment 2 was designed to rule out this potential confound by randomly presenting T1 and T2 at any of six locations with equal probability.
Methods
Subjects
Eight undergraduates from Beifang Traffic University participated in this experiment for monetary compensation. They had no prior experience in similar experiments. Subjects received 36 trials as practice in the present task. All observers had normal or corrected to normal vision.
Apparatus, stimuli, and procedure
Stimuli were presented on a 19″ monitor. The viewing distance was about 60 cm. The sequence of events on each trial was similar to that of Experiment 1 except that only six upper-case dark gray letters (1.3° in height) were presented at six evenly spaced locations (11 o’clock, 9 o’clock, 7 o’clock, 5 o’clock, 3 o’clock, and 1 o’clock) on a virtual circle with a diameter of 15°. Letters were randomly chosen from all letters in the alphabet except the letter I. Each of the letters was part of an RSVP stream. All letters were changed simultaneously every 160 ms. The first target, T1, was a white digit randomly chosen between 2 and 9. It could appear in the 11, 12, or 13th frame in the stream, and had an equal chance of appearing at any one of six locations.
The letters continued to change at the same rate after T1 was presented. Either one, three, or six frames after T1, the second target, T2, was another light gray digit, whose identity was different from T1. We set T2 to be a light gray digit which was slightly brighter than the distracting letters (dark gray) but less bright than T1 (white) in order to reduce visual interference between T1 and T2. Participants were told to identify two digits slightly brighter than any distracting letters to guarantee that T1 and T2 were essentially the same task for the participants. The T2 location was randomly decided and had an equal probability of appearing at any one of the six locations. This arrangement resulted in visual angles between T1 and T2 of 0°, 7.5°, 13°, and 15°. At the end of each trial, subjects were asked to report the identity of T1 and T2. Subjects provided their responses using the computer keyboard.
Design
Lag and distance between T1 and T2 were two within-subject variables. Eighteen trials were assigned to each combination of lag (Lag 1, Lag 3, or Lag 6) and T2 location (6 possible locations), altogether 324 trials. Thus there were 36 trials at each of the intermediate distances (7.5° and 13°) and 18 trials at the 0° and 15° distances for each lag. The test trials were randomly ordered and divided into nine blocks, with a short break between each block.
Results
Grand mean accuracy for T1 in Experiment 2a was 84%. The mean accuracy for T1 was 80.9% at lag 1, 86.6% at lag 3, and 83.9% at lag 6. Thus using the same task for T1 and T2 here did reduce T1 performance somewhat relative to that in Experiment 1 (92%). T1 accuracy was analyzed using a repeated measures ANOVA with distance between T1 and T2 and the lag as two within-subject variables. Results showed a significant main effect of lag, F(2,14) = 8.749, p = 0.003,  ; but there was no main effect of distance between T1 and T2, F(3,21) = 1.062, p > 0.05; nor did the distance between T1 and T2 and lag interact, F(6,42) = 1.95, p > 0.05. Further pairwise comparison indicated that T1 performance at lag 1 was lower than that at lag 3 (mean difference = 0.057, SE = 0.012, p < 0.005) and lag 6 (mean difference = 0.031, SE = 0.013, p < 0.05). The results of Experiment 2 indicated that T1 performance was impaired when T2 immediately followed T1.
Most importantly, we examined the ability of subjects to detect T2 (when it was present) given correct identification of T1. Those results are shown in Figure 4 where T2 accuracy is plotted as a function of lag and distance between T1 and T2. There was a main effect of lag F(2,14) = 66.112, p < 0.001,  , with performance severely impaired at lag 1 (43.3%), recovered at lag 3 (69.1%), and peaked at lag 6 (74.3%). This reveals the presence of a large AB effect. The main effect of distance was also significant, F(3,21) = 5.022, p = 0.009,
  . Post hoc tests revealed that performance at T1–T2 separations of 0° and 15° was significantly better than that at distances of 7.5° and 13°. There were significant differences in the proportion correct between 0° and 7.5° (mean difference = 0.143, SE = 0.048, p < 0.05), and 0° and 13° (mean difference = 0.148, SE = 0.025, p < 0.005). There were also significant differences between 15° and 7.5° (mean difference = 0.133, SE = 0.03, p < 0.005), and 15° and 13° (mean difference = 0.076, SE = 0.021, p < 0.01). And, the interaction between lag and distance was also significant. F(6,42) = 4.991, p = 0.001,
  , mainly due to a more even distribution of attention across the different locations at lag 6 or lag 3 than at lag 1. Most importantly, this interaction indicates a greater AB effect for intermediate as opposed to short distances from T1.
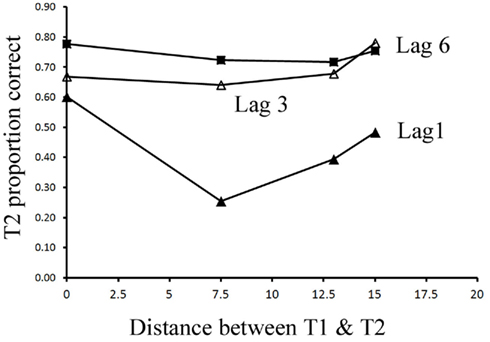
Figure 4. Mean discrimination accuracy of T2 when participants correctly reported T1 in Experiment 2a.
Discussion
Experiment 2a replicated the U-shaped spatial distribution of AB even when T1 and T2 were the same task. At a short lag (lag 1), T2 performance was much higher at T1–T2 distances of 0° and 15° relative to distances of 7.5° and 13°. Even at lag 3 and lag 6, T2 performance was relatively lower at the distances of 7.5° and 13°compared with that at distances of 0° and 15°, though performance was more evenly distributed across the whole visual field than that at lag 1. Thus Experiment 2a further rules out two possible explanations of the results of Experiment 1. First, the results of Experiment 1 cannot be attributed to task switch costs because Experiment 2a showed the same U-shaped distribution of AB when T1 and T2 required exactly the same task. Second, participants had no reason to prioritize any subset of the six locations because T1 and T2 randomly appeared at each location with equal probability. In conclusion, Experiment 2a along with Experiment 1 demonstrated that the AB is strongest at locations somewhat removed from the T1 location and is weakest at the T1 location and locations very far from T1 (T1–T2 distance of 15° in this case).
Experiment 2b
Consistent with Experiment 1, Experiment 2a showed a U-shaped distribution of AB even when T1 and T2 are two bright digits. We also confirmed that using same task for T1 and T2 did cause strong masking effect on T1. T1 accuracy at lag 1 (when T2 immediately follow T1) was significantly lower than those at lag 3 and 6, indicating that T1 is strongly interfered by T2 at lag 1 (Even though we set T2 to be less bright than T1 to reduce visual interference in Experiment 2a). However, what can account for the discrepancy between the results of current study and that of Kristjansson and Nakayama’s (2002) study is still open to question. If the discrepancy was due to stronger visual masking on T1 caused by T2 in Kristjansson and Nakayama’s (2002) study, we should be able to replicate their results (strong suppression at T1 location) when we set T1 and T2 to be white digits as they did. Thus we made both T1 and T2 white digits in order to closely replicate Kristjansson and Nakayama’s (2002) study.
Methods
Subjects
Eight undergraduates from Chinese Agriculture University participated in this experiment for monetary compensation. They had no prior experience in similar experiments. Subjects received 36 trials as practice in the present task. All observers had normal or corrected to normal vision.
Apparatus, stimuli, procedure, and design
Experiment 2b was exactly same as Experiment 2a except one thing. T2 was a white digit which was as bright as T1 in Experiment 2b.
Results
Grand mean accuracy for T1 in Experiment 2b was 70% which is 14% lower than Experiment 2a, indicating stronger visual masking effect on T1 in Experiment 2b than that in Experiment 2a. The mean accuracy for T1 was 65.6% at lag 1, 73.0% at lag 3, and72.4% at lag 6. T1 accuracy was analyzed using a repeated measures ANOVA with distance between T1 and T2 and the lag as two within-subject variables. Results showed a significant main effect of lag, F(2,14) = 7.181, p = 0.007,  ; and more importantly, there was a main effect of distance between T1 and T2, F(3,21) = 4.048, p = 0.02,
  ; the distance between T1 and T2 and lag also interact, F(6,42) = 3.539, p = 0.006,
  . The results of Experiment 2b indicated that T1 performance when T2 and T1 were at a same location (52.9%) was most severely impaired compared with those at other locations at lag 1 (average T1 performance was 65.6% at lag 1).
Again, we examined the ability of subjects to detect T2 (when it was present) given correct identification of T1. Those results are shown in Figure (5 where T2 accuracy is plotted as a function of lag and distance between T1 and T2. There was a main effect of lag F(2,14) = 19.168, p < 0.001,  , with performance severely impaired at lag 1 (45.8%), recovered at lag 3 (62.5%), and peaked at lag 6 (67.8%). This reveals the presence of a large AB effect. The main effect of distance was also significant, F(3,21) = 5.387, p = 0.007,
  . Post hoc tests revealed that performance at T1–T2 separations of 0°, 13°, and 15° was significantly better than that at distances of 7.5°. There were significant differences in the proportion correct between 0° and 7.5° (mean difference = 0.158, SE = 0.039, p = 0.005), and between 13° and 7.5° (mean difference = 0.093, SE = 0.028, p < 0.05). There were also significant differences between 15° and 7.5° (mean difference = 0.118, SE = 0.029, p = 0.005). And, the interaction between lag and distance was not significant. F(6,42) = 1.804, p > 0.05,
  , probably due to a similar U-shaped distribution of attention across the different locations at all lags.
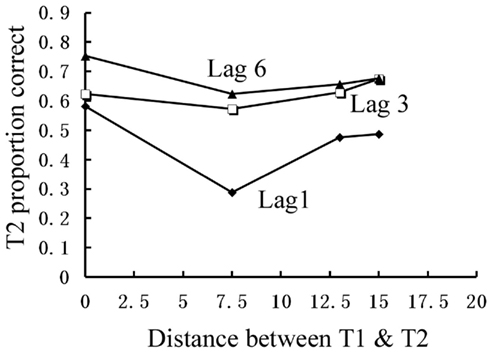
Figure 5. Mean discrimination accuracy of T2 when participants correctly reported T1 in Experiment 2b.
Discussion
Experiment 2b showed that T2 performance was much higher at T1–T2 distances of 0°, 13°, and 15° relative to distances of 7.5° at lag 1. Even at lag 3 and lag 6, T2 performance was relatively lower at the distances of 7.5°compared with those at distances of 0°, 13°, and 15°. Experiment 2b along with Experiment 2a demonstrated that the AB is strongest at locations somewhat removed from the T1 location and is weakest at the T1 location and locations very far from T1 (T1–T2 distance of 13° and 15° in this case) even when T1 and T2 are same tasks.
Experiment 2b also confirmed that T2 had a strong visual masking effect upon T1 when they shared a same location at lag 1. However, Experiment 2b replicated the U-shaped spatial distribution of AB as Experiment 2a, indicating that strong visual interference between T1 and T2 was unable to directly explain the discrepancy between the U-shaped distribution of AB in current study and results of Kristjansson and Nakayama’s (2002) study.
General Discussion
In the Experiment 1, multiple RSVP streams were used to examine the distribution of attention during AB. The detection of an orientation singleton was found to be relatively unimpaired at the location of T1 relative to other locations. The accuracy of detecting an orientation singleton declined as the distance between T1 and T2 increased, and it then recovered at a distance of 15°. A similar U-shaped distribution of AB was found in Experiment 2a and 2b in which both T1 and T2 are bright digits. Thus our results are partially consistent with earlier studies (e.g., weakest AB at the T1 location in Kawahara, (2002; Juola et al., 2004; Olivers, 2004) and inconsistent with the results of Kristjansson and Nakayama(2002; strongest AB at the T1 location). More specifically, we showed that accuracy at the T1 location was better than that at locations either 7° or 13° away from T1, indicating weakest suppression at the T1 location during the AB. Thus our results challenge the claim that AB is accompanied by “vigorous suppression of information from the attended site” (Kristjansson and Nakayama, 2002, p. 2047).
What can account for the different pattern of results between ours and Kristjansson and Nakayama (2002)? As noted in the introduction, Kristjansson and Nakayama used T1 and T2 tasks that were identical – subjects were required to identify two slightly brighter digits. In this case T1 would be expected to cause much stronger visual masking on T2 when the two share the same location compared to when they have a physical separation of more than 10°. This stronger visual masking at the T1 location might account for the suppression they observed in their task. In Experiment 1 of the present study, the T1 and T2 stimuli were very different from each other – thus, visual masking at the T1 location would be expected to affect the present results to a much lower extent, and as a result we reached a different conclusion. But this visual masking account cannot explain results of Experiment 2a and 2b. Since T1 and T2 were essentially the same in Experiment 2a and 2b (they were required to detect two slightly brighter digits among other dark gray letters), vigorous suppression at T1 location in Kristjansson and Nakayama (2002) study should be replicated in Experiment 2a and 2b. However, both Experiment 2a and 2b did not observe any inhibitory effect at T1’s location as Kristjansson and Nakayama (2002) did. Thus what cause discrepancy between the present study and Kristjansson and Nakayama (2002) is still unknown. But one thing worth noting was that T2 had a strong masking effect upon T1 when T1 and T2 shared a same location in Experiment 2b (Lower T1 performance when T1 and T2 were at a same location compared with when they are spatially separated). Since researchers only analyze T2 accuracy given T1 is correct in all studies on AB, spatial distribution of T2 performance might be influenced by an uneven spatial distribution of T1. However, we cannot confirm this because Kristjansson and Nakayama (2002) did not report spatial distribution of T1 in their study.
On the other hand, our results are also partially consistent with Kristjansson and Nakayama’s (2002) findings in that the detection of an orientation singleton or a digit peaked at a distant location 15° from T1 (it was as good as the detection of an orientation oddball at the T1 location). This finding also challenges the model of the spatial distribution of AB proposed in earlier studies (Olivers, 2004; Jefferies et al., 2007; Jefferies and Di Lollo 2009). Those studies suggested that the focus of attention is triggered by T1 to narrow down to the T1 location. The implication is that available attentional resources should decrease as the distance between T1 and T2 increases (or remain uniformly low for locations removed from T1). But the present results, along with the Kristjansson and Nakayama (2002) finding, indicate that some remotely distant locations (15° from T1) may receive as much attentional priority as the T1 location.
But why did so few earlier studies on spatial aspects of AB find enhanced performance at distant locations? One self-evident answer is that the distance between T1 and T2 in many studies was not great enough to observe enhanced performance at distant locations. Another possibility is that many studies presented T1 at fixation. As a result, higher visual acuity at the fovea could explain at least a part of the enhanced performance at the T1 location, and reduced performance for more eccentric locations. For example, Olivers (2004) found that performance in a localization task declined monotonically as the eccentricity of T2 increased during the dwell time of the AB. However, because T1 was always presented at fixation in the Olivers study, those results may be due in part to effects of retinal eccentricity. In the present experiment we held constant the retinal eccentricity of T1 and T2 while manipulating the separation between T1 and T2. Thus our method eliminated any potential contribution of retinal eccentricity.
Some authors have recently proposed a dynamic zoom-lens model to account for the dynamic distribution of AB. The model suggests that the focus of attention automatically zooms in to the T1 location about 100 ms after T1 appears. An additional 400 ms is then needed to re-expand the focus of attention to encompass all stimuli in the scene (Jefferies and Di Lollo, 2009). The model predicts an attentional gradient at lag 1 with the most accurate detection of T2 at the T1 location and decreasing performance as the T1–T2 distance increases. But at longer lags, such as Lags 3 and 6 in the present study, performance should recover to a homogenous level across the whole visual scene. In contrast to those predictions, our results present some challenges to such a dynamic zoom-lens model. First, we found a non-linear, U-shaped allocation of attention at lag 1 (a distant location received as much attentional priority as the T1 location). Second, the U-shaped distribution of attention lasts at least until lag 3 (420 ms). These results indicate that focal attention does not always shrink to the T1 location during AB, instead spatial attention appears to remain allocated diffusely across the whole visual scene to prioritize both the T1 location and more distant locations. Thus current results are actually consistent with lateral inhibition theory brought up in the Kristjansson and Nakayama (2002) study. The present study, however, did not address why intermediate locations are vigorously suppressed during AB. More work will be needed to explore this question.
Conflict of Interest Statement
The authors declare that the research was conducted in the absence of any commercial or financial relationships that could be construed as a potential conflict of interest.
References
Chun, M. M., and Potter, M. C. (1995). A two-stage modal for multiple target detection in rapid serial visual presentation. J. Exp. Psychol. Hum. Percept. Perform. 21, 109–127.
Eriksen, C. W., and St. James, J. D. (1986). Visual attention within and around the field of focal attention: a zoom lens model. Percept. Psychophys. 40, 225–240.
Jefferies, L. N., and Di Lollo, V. (2009). Linear changes in the spatial extent of the focus of attention across time. J. Exp. Psychol. Hum. Percept. Perform. 35, 1020–1031
Jefferies, L. N., Ghorashi, S., Kawahara, J., and Di Lollo, V. (2007). Ignorance is bliss: the role of observer expectation in dynamic spatial tuning of the attentional focus. Percept. Psychophs. 69, 1162–1174.
Joseph, J. S., Chun, M. M., and Nakayama, K. (1997). Attentional requirements in a ‘preattentive’ feature search task. Nature 387, 805–807.
Joseph, J. S., Chun, M. M., and Nakayama, K. (1998). Reply to vision and attention: the role of training. Nature 393, 425–426.
Juola, J. F., Botella, J., and Palacios, A. (2004). Task- and location-switching effects on visual attention. Percept. Psychophys. 66, 1303–1317.
Kawahara, J. (2002). Facilitation of local information processing in the attentional blink as indexed by the shooting line illusion. Psychol. Res. 66, 116–123.
Kristjansson, A., and Nakayama, K. (2002). The attentional blink in space and time. Vision Res. 42, 2039–2050.
LaBerge, D., and Brown, V. (1989). Theory of attentional operations in shape identification. Psychol. Rev. 96, 101–124.
Maki, W. S., Bussard, G., Lopez, K., and Digby, B. (2003). Sources of interference in the attentional blink: target–distractor similarity revisited. Percept. Psychophys. 65, 188–201.
Olivers, C. N. L. (2004). Blink and shrink: the effect of the attentional blink on spatial processing. J. Exp. Psychol. Hum. Percept. Perform. 30, 613–631.
Posner, M. I., Rafal, R. D., Choate, L. S., and Vaughan, J. (1985). Inhibition of return: Neural basis and function. Cogn. Neuropsychol. 2, 211–228.
Raymond, J. E., Shapiro, K. L., and Arnell, K. M. (1995). Similarity determines the attentional blink. J. Exp. Psychol. Hum. Percept. Perform. 21, 653–662.
Shapiro, K. L., Caldwell, J., and Sorensen, R. E. (1997). Personal names and the attentional blink: a visual “cocktail party” effect. J. Exp. Psychol. Hum. Percept. Perform. 23, 504–514.
Shapiro, K. L., Raymond, J. E., and Arnell, K. M. (1994). Attention to visual pattern information produces the attentional blink in rapid serial visual presentation. J. Exp. Psychol. Hum. Percept. Perform. 20, 357–371.
Keywords: attention, attentional blink, spatial attention
Citation: Du F, Abrams RA and Zhang K (2011) Spatial distribution of the attentional blink. Front. Psychology 2:360. doi: 10.3389/fpsyg.2011.00360
Received: 29 March 2010;
Accepted: 15 November 2011;
Published online: 07 December 2011.
Edited by:
Kimron Shapiro, Bangor University, UKReviewed by:
Christian N. L. Olivers, Vrije Universiteit, NetherlandsIrina M. Harris, University of Sydney, Australia
Copyright: © 2011 Du, Abrams and Zhang. This is an open-access article distributed under the terms of the Creative Commons Attribution Non Commercial License, which permits non-commercial use, distribution, and reproduction in other forums, provided the original authors and source are credited.
*Correspondence: Feng Du, State Key Laboratory of Brain and Cognitive Science, Institute of Psychology, Chinese Academy of Sciences, Beijing 100101, China. e-mail: duf@psych.ac.cn; Richard A. Abrams, Department of Psychology, Washington University, St. Louis, MO 63130, USA. e-mail: rabrams@wustl.edu