
- 1 Max Planck Institute for Psycholinguistics, Nijmegen, Netherlands
- 2 Donders Institute for Brain, Cognition, and Behaviour, Radboud University, Nijmegen, Netherlands
- 3 Centre of Behavioral and Cognitive Sciences, University of Allahabad, Allahabad, India
The influence of formal literacy on spoken language-mediated visual orienting was investigated by using a simple look and listen task which resembles every day behavior. In Experiment 1, high and low literates listened to spoken sentences containing a target word (e.g., “magar,” crocodile) while at the same time looking at a visual display of four objects (a phonological competitor of the target word, e.g., “matar,” peas; a semantic competitor, e.g., “kachuwa,” turtle, and two unrelated distractors). In Experiment 2 the semantic competitor was replaced with another unrelated distractor. Both groups of participants shifted their eye gaze to the semantic competitors (Experiment 1). In both experiments high literates shifted their eye gaze toward phonological competitors as soon as phonological information became available and moved their eyes away as soon as the acoustic information mismatched. Low literates in contrast only used phonological information when semantic matches between spoken word and visual referent were not present (Experiment 2) but in contrast to high literates these phonologically mediated shifts in eye gaze were not closely time-locked to the speech input. These data provide further evidence that in high literates language-mediated shifts in overt attention are co-determined by the type of information in the visual environment, the timing of cascaded processing in the word- and object-recognition systems, and the temporal unfolding of the spoken language. Our findings indicate that low literates exhibit a similar cognitive behavior but instead of participating in a tug-of-war among multiple types of cognitive representations, word–object mapping is achieved primarily at the semantic level. If forced, for instance by a situation in which semantic matches are not present (Experiment 2), low literates may on occasion have to rely on phonological information but do so in a much less proficient manner than their highly literate counterparts.
Introduction
In many situations we are faced with information arriving simultaneously through visual and speech channels. To understand how the linguistic system and the visual system interact in determining behavior it is crucial to establish what and when different types of information are retrieved when someone is confronted simultaneously with input from the speech signal and the visual environment. One way to examine this issue is to investigate how individuals’ visual orienting behavior (i.e., their eye gaze) is influenced by the processing of the visual environment and the concurrent processing of spoken language during language-mediated visual search (Huettig et al., 2011, for review; see also Cooper, 1974; Wolfe, 1994; Desimone and Duncan, 1995). The question we explore here is whether there are crucial differences in this language–vision mapping behavior among distinct groups of language users. Specifically, we contrast language-mediated visual orienting behavior in individuals with very poor and very good literacy skills.
Mapping Language-Derived and Vision-Derived Cognitive Representations
Cooper (1974) was the first to explore how language users integrate lexical information retrieved during spoken language processing (e.g., knowledge about a word’s referent) with information retrieved from the visual environment (e.g., the properties of co-present visual objects) to guide eye gaze. Cooper’s participants listened to short narratives while their eye movements were monitored on an array of spatially distinct line drawings of common objects, some of which were referred to in the spoken sentences. He observed that his participants, for instance when listening to a story about a safari in Africa, very quickly shifted their eye gaze to objects which were referred to, often already during the acoustic duration of the respective word (e.g., half way during the acoustic unfolding of the word “lion” participants started to shift their eye gaze to the drawing of the lion). He also observed that semantically related objects were looked at more (e.g., on hearing “Africa” participants were more likely to look at a snake, a lion, and a zebra than at semantically unrelated objects). In short, D:Coopers:1974] results suggested that there is a tight link between spoken language processing and eye gaze to objects in the concurrent visual environment. Though Cooper recognized the potential of the new experimental technique “for the real-time investigation of perceptual and cognitive processes” (p. 84) he did not use the method to explore these issues any further. Only recently has the mapping of language-derived and vision-derived representations begun to be explored in a more systematic manner.
Here we focus on the mapping of phonological and semantic information (see Huettig et al., (2011, for discussion of other relevant levels of representation). Note that the fact that a language user looks at a fully matching named referent (e.g., hearing “lion” resulting in looks to the lion) does not indicate the type of knowledge she has retrieved from hearing the spoken word and from seeing the visual object. It also does not indicate which of the language-derived and vision-derived representations are involved in the mapping process. Language–vision mapping could take place at several representational levels. D:Coopers:1974] results suggested the possibility of semantic mapping. He did not however explore the semantic relationships between spoken words and visual objects in a systematic manner. The words “Africa” and “lion” for instance are semantically and associatively (Nelson et al., (1998) related and thus it is unclear whether Cooper’s semantic effects were driven by semantic relatedness or mere association. Huettig and Altmann (2005) controlled items for associative relationships and found that their participants directed increased overt attention toward displayed objects (e.g., a trumpet) when they were semantically (but not associatively) related to concurrently heard spoken words (e.g., “piano”). The probability to fixate the semantic competitors correlated significantly with the semantic similarity between critical pairs (e.g., piano/trumpet) as derived from production feature norms (Cree and McRae, 2003). Further evidence was provided by Huettig et al., 2006, see also Yee et al., 2009) who found that corpus-based measures of semantic similarity (e.g., Latent Semantic Analysis, Landauer and Dumais, 1997; Contextual Similarity, McDonald, 2000) correlated well with fixation behavior. Overall, these data thus demonstrate that language-mediated eye movements can be driven by semantic similarity rather than by mere associations or all-or-none categorical knowledge (see also Dunabeitia et al., 2009).
The mapping between language-derived and vision-derived representations however could also take place at the level of phonological representations. This is because participants could retrieve stored phonological knowledge on viewing the visual objects in the display (i.e., retrieval of the names of the objects, see Meyer et al., 2007; and Meyer and Damian, 2007; for experimental evidence that participants retrieve the name of objects even in tasks which do not require explicit object naming) and match it with the phonological representations retrieved on hearing the spoken words.
The most direct evidence that language users use can map language-derived and vision-derived representations at the phonological level comes from a study by Huettig and McQueen (2007). Dutch participants listened to neutral spoken Dutch sentences including a critical word which was not predictable in the context (e.g., beker “beaker,” in the sentence “Uiteindelijk keek ze naar de beker die voor haar stond,” “Eventually she looked at the beaker that was in front of her”). While listening to the sentences participants looked at four spatially distinct common objects on a computer screen (e.g., a bobbin, a fork, a beaver, and an umbrella). In their Experiments 1 and 2, the spoken sentences and visual displays were identical across experiments. All that changed was the relative timing of the presentation of the visual information. In Experiment 1, when participants had 1 s preview of the visual display before the spoken sentences started to acoustically unfold, attentional shifts to phonological competitors of the critical spoken words (e.g., to a beaver, bever in Dutch, on hearing beker; beaker and beaver have a similar phonological form at word onset) preceded attentional shifts to shape competitors (e.g., a bobbin; beaker and bobbin have a similar global shape) and semantic competitors (e.g., a fork; beakers and forks are semantically related, they are both kitchen things). Importantly, with only 200 ms of preview of the same picture displays prior to onset of the critical word (Experiment 2), participants did not look preferentially at the phonological competitors, and instead made more fixations to the shape competitors and then the semantic competitors. Thus, when there was ample time to view the display (Experiment 1), picture processing did advance as far as retrieval of the pictures’ names: There were fixations to all three types of competitor. But when there was only 200 ms of preview before the onset of the critical spoken word (Experiment 2), picture processing still involved retrieval of visual and semantic features to a degree sufficient to influence eye movements, but insufficient retrieval of the pictures’ names to influence behavior. Huettig and McQueen (2007) concluded that there were no preferential fixations to the phonological competitors under these conditions because, by the time a picture’s name could have been retrieved, there was no longer any online match between the speech signal and these vision-derived phonological representations. These results thus strongly suggest that shifts in eye gaze during language-mediated visual search are co-determined by the timing of cascaded processing in the word- and object-recognition systems, and the temporal unfolding of the speech signal. Language users thus appear to participate in a tug-of-war among multiple types of (language-derived and vision-derived) cognitive representations (Huettig and McQueen, 2007).
It is noteworthy that almost all data investigating language–vision mapping have been obtained in experiments using undergraduate students. It is an open empirical question how much one can generalize from the sophisticated behavior of highly educated university students and draw inferences about mind and behavior beyond these narrow samples (a pervasive problem in psycholinguistics and related fields, see Arnett, 2008; Henrich et al., 2010; for further discussion). In the present research we focus on phonological and semantic mapping processes during language-mediated visual orienting behavior in distinct participant populations: we compare eye gaze behavior of high literates (Indian university students) with that of low literates (Indian workers who received on average 2 years of formal schooling)1.
Literacy and Phonological Processing
Even today about one in five humans is considered to be low literate or “illiterate,” i.e., a person “who cannot with understanding both read and write a short simple statement on his (her) everyday life” (UNESCO, 2008). Though enormous challenges impede the eradication of illiteracy, the literacy rate in India, according to the latest census, has risen to 74% in 2011 from a mere 12% when the country became independent in 1947. Nevertheless, it means that even today one in four Indians is illiterate or low literate (with the situation in Nepal and Bangladesh with one in two people illiterate and in Pakistan with one in three people illiterate being even more dramatic). These figures make clear that illiteracy remains a very tangible problem in spite of massive changes in the cultural and socio-economical orders in these countries in the last few decades. Note however that low literates and illiterates in India are fully integrated in Indian society. Illiteracy and low literacy levels in India are essentially due to widespread poverty, entrenched hierarchical social divisions, and a lack of a close link between educational attainment and job opportunities rather than any cognitive impairments of the individuals. This makes India an ideal testing ground for the present research.
How likely is it that low literates’ and high literates’ language-mediated visual orienting behavior differs? Though it may seem counterintuitive, it is now well-established that orthography is strongly involved in speech perception in literate adults (e.g., Dijkstra et al., 1995; Ziegler and Ferrand, 1998; Hallé et al., 2000; Ventura et al., 2004; Chéreau et al., 2007). There have been many reports that illiterates’ phonological awareness is poor. Morais et al. (1979) conducted a seminal study on this issue. They explored whether the conscious understanding that speech consists of a sequence of phones/phonemes (i.e., phonemic awareness) arises spontaneously during development. Morais et al. asked 30 Portuguese illiterates (aged 38–60) and 30 Portuguese late-literates (aged 26–60; individuals who had taken part in adult literacy programs after the age of 15) to add or delete one phoneme (e.g., “p”) of an utterance. This meant that words produced by the experimenter became another word or a non-word (e.g., “alcaho” became “palcaho” or “purso” became “urso”). The correct response in word trials thus could be found by searching memory for a similar sounding word and only non-word trials provided information about participants’ segmentation abilities and phonological awareness. Mean correct responses on non-word trials were 19% for illiterates but 72% for late-literates. Morais et al. thus concluded that the “ability to deal explicitly with the phonetic units of speech is not acquired spontaneously” (p. 330). Further studies have replicated these results (e.g., Morais et al., 1986) but shown that illiterates perform much better when tested on other metaphonological abilities such as syllable detection (Morais et al., 1989), rhyme awareness (Morais et al., 1986; Adrian et al., 1995), and phonological length (Kolinsky et al., 1987). Morais et al. (1986) concluded that “while sensitivity to rhyme and analysis into syllables can develop up to some point in the absence of the experience normally provided by reading instruction, analysis into phonetic segments requires that experience” (p. 45)2.
Interestingly, speech perception abilities appear to be little influenced by formal literacy. Serniclaes et al. (2005) investigated categorical perception in illiterates using /ba–da/ contrasts. Illiterates and literates did not differ as such in their categorical perception. However, illiterates showed a less precise categorical boundary but a stronger lexical bias (in Portuguese /ba/ is a non-word but /da/ is a frequent word: “give me”). Morais et al. (1991) have also reported that performance between illiterate and literates is similar on the McGurk effect (i.e., the illusion that hearing “ba” and seeing visual lip-movements saying “ga” resembles “da,” cf. MacDonald and McGurk, 1978) and feature blendings (Morais et al., 1987). In sum, illiterates tend to perform very poorly in phonemic awareness tasks but do well in speech perception tasks.
Though these results are illuminating the question arises to what extent tasks which tap explicit phonological processing are relevant for the present research on language–vision mapping. Phonological awareness appears not to be necessary for speech communication and although low literates do not have orthographic representations available to support spoken word recognition, they have no apparent difficulties in understanding and producing spoken language in conversational dialog. Assessing the performance in tasks that require no or less explicit phonological processing is therefore particularly informative. Pseudoword repetition is a task that is likely to require both explicit and implicit phonological processing. Reis and Castro-Caldas (1997) found that illiterates performed much worse than literates in repeating pseudowords. Interestingly, illiterates performed as well as literates when they had to repeat real (i.e., existing) words (see also Kosmidis et al., 2004).
Literacy and Semantic Processing
Studies with illiterates and low literates suggest that semantic processing is less influenced by formal literacy than phonological processing. Reis and Castro-Caldas (1997) found illiterates to be worse at memorizing pairs of phonologically related than pairs of semantically related words. They also reported a significant difference in a semantic fluency task (which required to produce as many members of a pre-specified category as possible within 1 min) between high literates (9 mean years of formal education) and illiterates on two semantic categories (animals and furniture). Manly et al. (1999) found no difference between low literates (3 mean years of formal education) and illiterates on three semantic categories (animals, clothing, and food). Kosmidis et al. (2004) compared illiterates, low literates (5 mean years of formal education), and high literates (14 mean years of formal education) on three categories (animals, fruits, objects). They found that number of years of formal education improved performance in the semantic fluency task (total number of words generated for the 3 categories were 31 for the illiterates, 40 for the low literates, and 50 for the high literates). Kosmides et al. suggested that this improvement may be due to general factors associated with schooling such as increased vocabulary, more efficient memory strategies, abstract thinking skills, increased motivation, and appreciation of the importance of examinations on artificial tasks. Da Silva et al. (2004) compared performance of illiterates and literates on an (arguably) ecologically more valid semantic category (edible things that can be bought at a supermarket) and a semantic control category (animals). Da Silva et al. found no differences between the control groups on the supermarket category but literates performed better than illiterates on the animal category. Overall, these results suggest that differences in semantic fluency tasks between literates and illiterates depend on the precise semantic category.
Literacy and Visual Processing
Illiterates’ and low literates’ visual processing abilities are also relevant for the present research since claims have been put forward about illiterates’ apparent poor visual abilities. Morais and Kolinsky, 2001, p. 474) for instance quote Luria (1976) stating that in illiterates “neither the processing of elementary visual information nor the analysis of visual objects conforms to the traditional laws of psychology.” Luria’s strong conclusions about illiterates’ visual abilities however do not survive close scrutiny. There is no evidence that illiterates’ low level visual processing is impaired (cf. Kolinsky et al., 1994). Though formal schooling appears to have little impact on low level visual processing it seems to exert some influences on performance in tasks which are thought to tap higher level visual cognition. Reis et al. (2001) found no differences between illiterates and literates in naming real (3D) objects but illiterates performed poorer than literates when naming drawings and photos. It is however important to note that these differences for drawings and photos, though significant, were far from dramatic. Accuracy scores of illiterates in block 1 for drawings were 14.9 compared to 17.2 for high literates (block 2: 16.3 vs. 18). Reaction time differences were about 200 ms on average. In a later study, Reis et al. (2006) observed that if color was present, naming accuracy in illiterates increased independent of presentation mode (line drawing or photograph). Furthermore, when color was present object naming accuracy between illiterates and literates was similar. Reis et al. concluded that “color has a stronger influence on performance than photographic detail in non-literate subjects” and that “literacy, entailing the acquisition and subsequent practice in processing 2D information, modulates the skill for naming 2D representations of real objects but has limited effect on real object naming” (p. 53).
In sum, the studies investigating phonological abilities and phonological processing in illiterates have revealed that metaphonological awareness measures show the biggest influence of formal literacy. Speech perception tasks, in contrast, have shown that illiterates have little difficulty with phonetic discrimination. Thus far very few online methods have been used which focus on moment-by-moment phonological processing, i.e., while a person is understanding or producing a sentence (but see Ventura et al., 2007, for a picture–word interference study). Such methods are important because much of phonetic and phonological processing happens over very short periods of time (milliseconds rather than seconds) and many effects are transitory and dynamic in nature. The behavioral studies investigating semantic processing in illiterates and low literates suggest that it is qualitatively similar to (high) literates especially in ecologically valid tasks. Some caution is warranted though when interpreting these results with regard to the present research on language–vision mapping as it is apparent that behavioral studies on semantic processing also have relied almost exclusively on offline tasks. The studies involving picture naming suggest that illiterates may be somewhat slower than literates in naming 2D representations of real objects.
The Present Study
The literature reviewed above indicates that it is by no means clear that phonological mapping processes during language-mediated visual orienting behavior will be similar in high and low literates. In the present research we test whether low literates’ language-mediated eye gaze involves, as in high literates, (at least temporarily) mapping of representations at the phonological level. Given the studies reviewed above, we predict that literacy levels will have little impact on semantically mediated eye gaze. In the present research, participants listened to simple spoken sentences (e.g., “Today he saw a crocodile”) while concurrently looking at a visual display of four objects. As low literates may be slower in retrieving (semantic and phonological) representations from line drawings, participants were given on average 2 s preview of the visual display before the critical word (e.g., “crocodile”) acoustically unfolded. As discussed above, looks to phonological competitors in the visual display (e.g., a crocus, both crocus and crocodile share the same word-initial phonology) tend to precede looks to semantic competitors (e.g., a turtle, both crocodiles and turtles are from the same semantic category: reptiles) because, in the speech recognition system, information flows continuously from the speech signal via a phonological level of lexical representation, to levels of processing where knowledge about semantic features can be retrieved and used (Huettig and McQueen, 2007). Thus, if mapping between language-derived and vision-derived representations in the tested participant populations (high literates vs. low literates) takes place partly at the phonological level, they should look at phonological competitors more than at completely unrelated distractors and earlier than at the semantic competitors. If visual orienting is not mediated by phonological information, they should only look at semantic competitors.
Experiment 1
Method
Participants
Forty-two high literates (mean age = 24.3 years, SD = 2.6 years; 15 mean years of formal education, SD = 1.13, range = 13–17) and 32 low literates (mean age = 27.5, SD = 3.2; 2 mean years of formal education, SD = 2.72, range = 0–9) participated. All participants were from the city of Allahabad in the Uttar Pradesh region of India and had Hindi as their mother tongue. All participants had normal vision, none had known hearing problems. The ethics committee of Allahabad University approved the study and informed consent was obtained from all participants.
The assignment of the participants to the two groups, low literates and high literates was based on mean number years of formal education. Highly literate participants were mostly students of Allahabad university. Low literates were recruited on or around Allahabad university campus. They were asked whether they had received any formal education and whether they could read or write. All low literates were engaged in public life and supported themselves by working, for instance, in food and cleaning services. We did not assign any participant to the low literacy group who had taken part in adult literacy education programs. Note that an average of 2 years of formal schooling in Uttar Pradesh tends to result in very rudimentary reading skills only (i.e., reading abilities only slightly above complete illiterates). To confirm appropriate assignment of participants to the respective participant groups a reading test was administered. Ninety-six words of words of varying syllabic complexity were presented. High literates on average read aloud 93.8 words correctly (SD = 2.04, range = 90–96) whereas low literates only read aloud 6.3 words correctly (SD = 9.81, range = 0–35).
Materials and stimulus preparation
There were 70 displays, each paired with a spoken sentence containing a critical word. Thirty-five trials were experimental trials, the other 35 trials were filler trials. Each critical word (e.g., “magar,” crocodile) was placed in a neutral sentence in which it was not predictable (e.g., “Aaj usne magar dekha hai,” Today he saw a crocodile). Sentences were recorded by a female native speaker of Hindi who was unaware of the purpose of the experiment. The sentences were read with neutral intonation contour such that in particular critical words were not highlighted. The mean onset time of the target words in the spoken sentences was 942.43 ms (SD = 272.4). Since visual displays were presented 1000 ms before the spoken sentences, participants had on average 1942.43 ms preview of the visual display before the critical target word acoustically unfolded.
Visual displays in the experimental trials (see Figure 1 for an example) consisted of four line drawings: a phonological competitor of the critical word, a semantic competitor of the critical word, and two unrelated distractors. The referents of the spoken target words and the objects presented in the visual displays were all frequent common objects known to both literates and illiterates. All phonological competitors (e.g., “matar,” peas) overlapped at least two phonemes at word onset with the spoken target word (e.g., “magar,” crocodile). The semantic competitors (e.g., “kachuwa,” turtle) were from the same semantic category as the spoken target word (e.g., “magar,” crocodile; crocodiles and turtles are both reptiles).
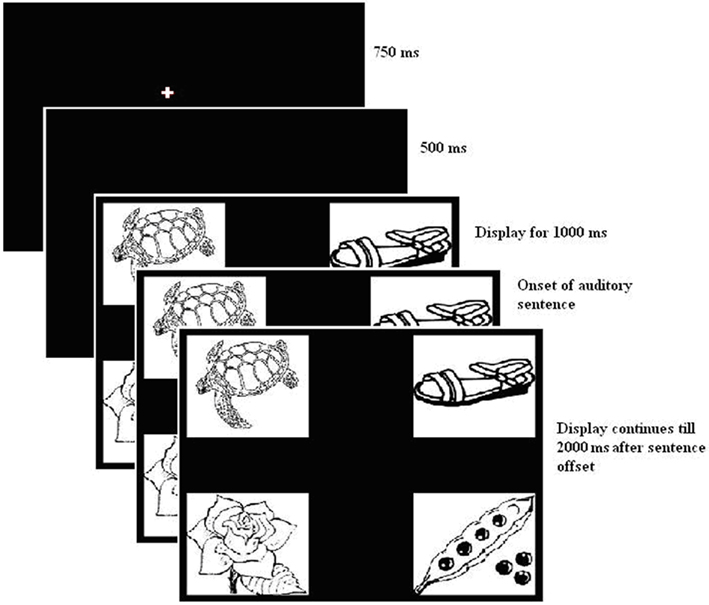
Figure 1. Sequence of events during each trial.
Rating studies
Ten different Hindi native speakers were asked to judge the similarities of the names of these objects with the target word on a 8 point scale with “7” representing “highly similar sounding” and “0” representing “highly dissimilar sounding.” They were also asked to judge the similarity in meaning of the objects with the concepts of the target word on a 8 point scale with “7” representing “highly similar in meaning” and “0” representing “highly dissimilar in meaning.” The mean phonological similarity ratings were 5.89 (SD = 0.42) for the phonological competitors, 0.10 (SD = 0.22) for the semantic competitors, and 0.01 (SD = 0.06) for the unrelated distractors. Paired t-tests showed that there was a significant difference between phonological and semantic competitors (t = 63.21, p = < 0.001) and between phonological competitors and unrelated distractors (t = 80.30, p = < 0.001). Thus phonological competitors were judged to be phonologically more similar to the critical words than any other visual stimuli. The phonological similarity ratings between semantic competitors and unrelated distractors also differed significantly (t = 2.40, p = 0.022). However, despite the small difference in ratings it is extremely unlikely that a mean phonological similarity rating of 0.1 on a scale from 0 to 7 influences eye movement behavior. Note that effects of non-onset phonological overlap are very small and only marginally statistically significant (or not at all) even when all phonemes of a word are identical except the initial one (as in beaker vs. speaker, Allopenna et al., 1998; McQueen and Viebahn, 2007; McQueen and Huettig, in press, for discussion). We can thus rule out with confidence that a tiny judged similarity of 0.1 will influence fixation behavior. The mean semantic similarity ratings with the target words were 5.58 (SD = 0.41) for the semantic competitors, 0.08 (SD = 0.21) for the phonological competitors, and 0.07 (SD = 0.16) for the unrelated distractors. Paired t-tests showed that there was a significant difference between semantic and phonological competitors (t = 65.78, p = < 0.001) and between semantic competitors and unrelated distractors (t = 72.36, p = < 0.001) but no significant difference between phonological competitors and unrelated distractors (t = 0.18, p = > 0.1) Thus semantic competitors were considered to be more similar in meaning to the critical words than any of the other stimuli.
Visual displays in the filler trials consisted of line drawings of the referent of the spoken critical word (e.g., the picture of a plate if the spoken target word was “plate”) and three unrelated distractors. Therefore in half the trials (the filler trials) the spoken target was depicted whereas in the other half of trials (the experimental trials) there were only phonological and semantic competitors of the target word present in the display. Such an experimental set-up (i.e., the entity mentioned in the spoken sentence not being present in the visual display on critical trials) has repeatedly been shown to maximize the opportunity to observe competitor effects and their time-course (e.g., Figure 2 in Huettig and Altmann, 2005, which shows that competition effects are much stronger in a target-absent condition than in a condition where both targets and competitors were present).
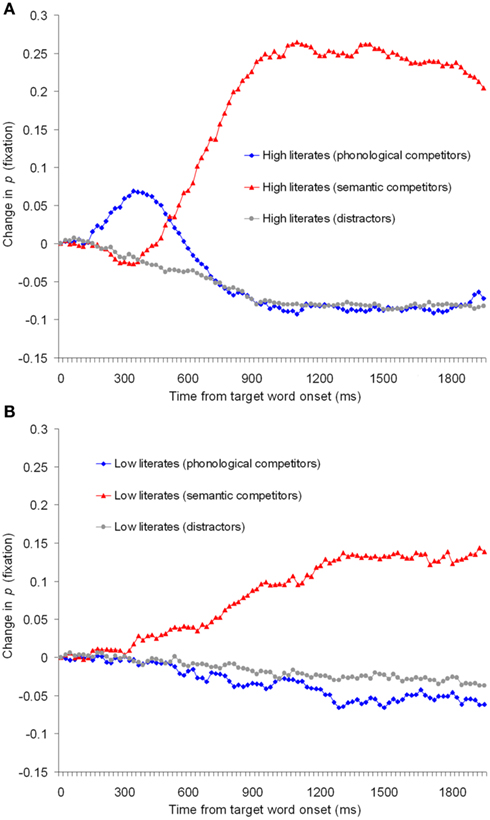
Figure 2. Change in fixation proportions in Experiment 1 for (A) high literates and (B) low literates.
Procedure
Participants were seated at a comfortable distance from a 17″ LCD color monitor with 1024 × 768 pixel resolution and a screen refresh rate of 75 Hz. Eye movements were monitored with an SMI High Speed eye-tracking system with a sampling rate of 1250 Hz. The eye-tracker was calibrated until the system accepted the calibration. Spoken sentences were presented through two speakers that were equidistant from the monitor.
The parameters of each trial (see Figure 1) were as follows. First, a central fixation point appeared on the screen for 750 ms, followed by a blank screen for 500 ms. Then four pictures appeared on the screen. The positions of the pictures were randomized across four fixed positions on every trial. The auditory presentation of a sentence was initiated 1000 ms after the pictures appeared on the screen.
Participants were asked to perform a “look and listen” task. They were told that they should listen to the sentences carefully, that they could look at whatever they wanted to, but that they should not take their eyes off the screen throughout the experiment (Huettig and Altmann, 2005; see Huettig and McQueen, 2007, for discussion). Participants’ fixations for the entire trial were thus completely unconstrained and participants were under no time pressure to perform any action.
Data coding procedure
The data from each participant’s right eye were analyzed and coded in terms of fixations, saccades, and blinks. Blinks were not considered as part of fixations. The timing of the fixations was established relative to the onset of the critical word in the spoken utterance. The visual displays were treated as being composed of four quadrants and gaze position was categorized by quadrant. Fixations were coded as directed to the phonological competitor picture, the semantic competitor picture, or to the unrelated distractor pictures.
Results
Figure 2 shows a time-course-graph of proportion of trials with a fixation on the phonological competitors, semantic competitors, or averaged distractors. The upper panel shows performance of the high literates, the lower panel shows performance of the low literacy group. The curves are synchronized to the acoustic onset of the spoken target word (e.g., “magar,” crocodile). The x-axis shows the time in milliseconds from this onset for 2000 ms. The calculation excluded all movements prior to the acoustic onset and therefore negative values reflect that (on average) participants moved their eyes away from objects fixated at this onset. Each data point reflects the proportion of trials with a fixation at that point in time minus the proportion of trials at the acoustic onset of the spoken target word (see Huettig and Altmann, 2005).
As can be seen from Figure 2A, as information from the spoken target word acoustically unfolded, high literates first shifted their eye gaze toward the phonological competitors. This is because the phonological competitor word (e.g., “matar,” peas) begins in the same way (i.e., “ma”) as the word that is actually spoken (e.g., “magar,” crocodile). As phonological information arrives which mismatches with the phonological competitor (e.g., the t in “matar” mismatches with the “g” of “magar”) participants move their eyes away from the phonological competitor and toward the semantic competitors (e.g., turtle). This pattern of results with Indian high literates replicates previous results with Dutch high literates (Huettig and McQueen, 2007). Performance of the low literacy group however was radically different (Figure 2B). There was no hint of a difference in looks between phonological competitors and unrelated distractors. Low literates did shift their eye gaze toward the semantic competitors but Figure 2B suggests that there was a difference in magnitude between the fixation proportions to the semantic competitors in the low literacy group and the high literacy control group.
For the analyses we computed mean fixation proportions for each type of object. We calculated the ratio between the proportion of fixations to a particular competitor (phonological or semantic) and the sum of the particular competitor- and distractor-fixation proportions (cf. Huettig and McQueen, 2007). A ratio greater than 0.5 shows that, of all the fixations directed toward a particular type of competitor and the unrelated distractors, the competitors attracted more than half of those fixations. We computed mean ratios per participant (t1) and item (t2) over a time interval starting from the acoustic onset of the critical spoken word to 100 ms after this onset (as an estimate of the earliest point in time at which a fixation could reflect a response based on information in the critical word, Altmann, 2011; cf. Saslow, 1967; Matin et al., 1993), in order to obtain a baseline of competitor/distractor-fixation ratios per type of object. We can assume that fixations during this baseline time region were not influenced by information from the critical spoken word because of the time considered necessary for programming and initiating an eye movement.
We calculated mean ratios during the baseline region to adjust for any bias in overt attention to a type of object before information from the critical word became available. Calculating a mean ratio for the baseline time regions (and then comparing these ratios with the mean competitor/distractor ratios during later time regions) allows us to test for any shifts in overt attention to particular types of objects during the time of interest. Thus we also computed mean ratios per participant and item for the subsequent 100 ms time regions. Figure 3 shows the mean phonological competitor and semantic competitor fixation ratios for the first eight 100 ms time bins after the acoustic onset of the target word.
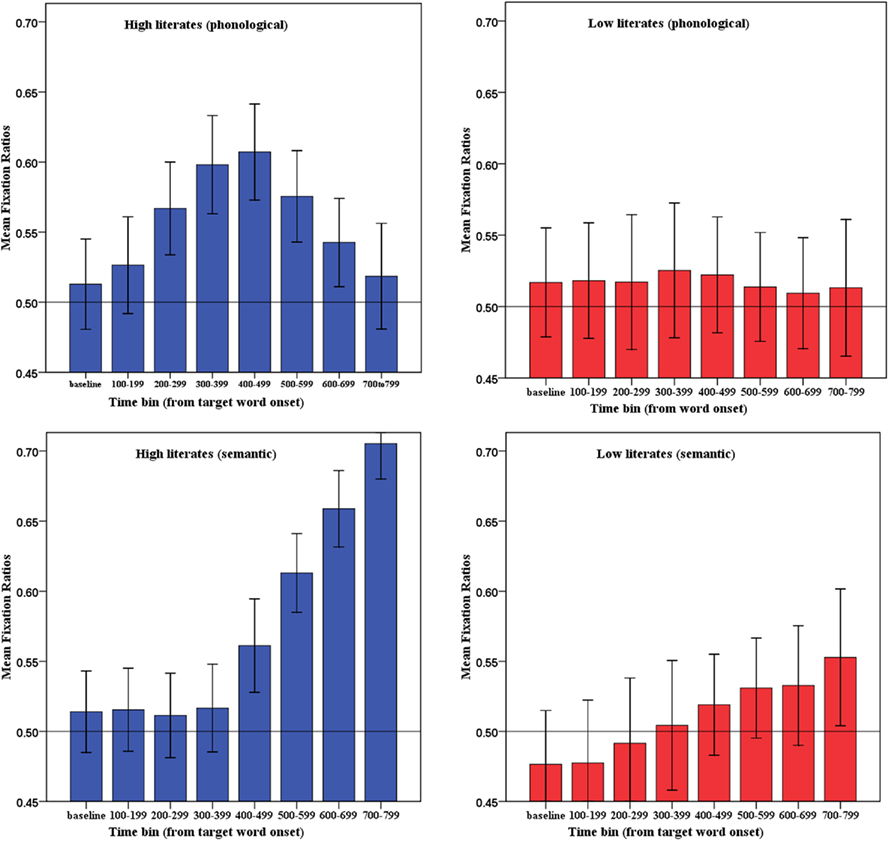
Figure 3. Mean fixation ratios (upper panels: phonological; lower panels: semantic) in Experiment 1. Error bars represent 95% confidence intervals.
We tested whether the competitor/distractor ratios during the baseline time window were significantly different from the competitor/distractor ratios during these time windows. For the highly literate participants, paired t-tests showed that the phonological competitor/distractor ratios during the baseline time window (0.51) first differed significantly from the phonological competitor/distractor ratios during the 200- to 299-ms time window (0.57), mean difference = 0.054, 95% CI: 0.081 to 0.027, d = 0.26; t1(1, 41) = 4.01, p < 0.001; t2(1, 34) = 2.54, p = 0.016. This difference remained statistically robust during the 300- to 399-ms time window (0.60), mean difference = 0.085, 95% CI: 0.12 to 0.052, d = 0.39; t1(1, 41) = 5.24, p < 0.001; t2(1, 34) = 3.64, p < 0.001; and during the 400- to 499-ms time window (0.61), mean difference = 0.094, 95% CI: 0.133–0.055, d = 0.44; t1(1, 41) = 4.88, p < 0.001; t2(1, 34) = 3.28, p = 0.002. The semantic competitor/distractor ratios of the highly literate participants during the baseline time window (0.51) first differed significantly from the semantic competitor/distractor ratios during the 400- to 499-ms time window (0.56), mean difference = 0.047, 95% CI: 0.088–0.006, d = 0.24; t1(1, 41) = 2.33, p = 0.025; t2(1, 34) = 1.89, p = 0.067; and during the 500- to 599-ms time window (0.61), mean difference = 0.1, 95% CI: 0.14–0.059, d = 0.55; t1(1, 41) = 4.94, p < 0.001; t2(1, 34) = 4.72, p < 0.001. In contrast, for the low literacy group, the phonological competitor/distractor ratios during the baseline time window (0.52) never differed statistically from the phonological competitor/distractor ratios during any of the time windows (t1 < 1, t2 < 1). The semantic competitor/distractor ratios of the low literates during the baseline time window (0.48) first differed significantly from the semantic competitor/distractor ratios during the 400- to 499-ms time window (0.52), mean difference = 0.04, 95% CI: 0.07–0.01, d = 0.19; t1(1, 31) = 2.7, p = 0.011; t2(1, 34) = 1.80, p = 0.08; and during the 500- to 599-ms time window (0.53), mean difference = 0.049, 95% CI: 0.087–0.011, d = 0.24; t1(1, 31) = 2.63, p = 0.013; t2(1, 34) = 2.31, p = 0.027.
The primary purpose of the present study was to investigate group differences on competitor fixations. Do high and low literates differ in the timing and magnitude of attentional shifts to phonological and semantic competitors? The above analyses already suggest that this is the case: High but not low literates showed significantly increased fixations to phonological competitors shortly after the acoustic onset of the target word compared with the baseline window, and effect sizes (Cohen’s d) suggest that high literates looked more at semantic competitors than low literates. This pattern was confirmed when the factor group was included in the analyses. A three-way mixed ANOVA with group (high or low literates) as between subject factor and bin (baseline, and the subsequent seven 100 ms bins) and competitor type (phonological vs. semantic) as within-subject factors revealed a significant three-way interaction between bin, competitor type, and group: F1(7, 504) = 11.94, p < 0.001; F2(7, 476) = 8.71, p < 0.001, a significant main effect of bin, F1(7, 504) = 12.06, p < 0.001; F2(7, 476) = 8.76, p < 0.001, no significant main effect of competitor, F1(1, 72) = 0.36, p > 0.1; F2(1, 68) = 0.95, p > 0.1, a significant main effect of group, F1(1, 72) = 9.55, p < 0.01; F2(1, 68) = 9.42, p < 0.01, no significant competitor by group interaction, F1(1, 72) = 1.50, p > 0.1; F2(1, 68) = 1.02, p > 0.1, a significant bin by group interaction, F1(7, 504) = 3.01, p < 0.01; F2(7, 476) = 1.77, p = 0.09, and a significant bin by competitor interaction, F1(7, 504) = 33.11, p < 0.001; F2(7, 476) = 30.54, p < 0.001. Independent samples t-tests (two-tailed) were then carried out on the ratio data for each competitor type for the first eight 100 ms time bins (see Table 1). Thus, group differences in phonological competitor fixation ratios were significant during the 300- to 399-ms, the 400- to 499-ms, and the 500- to 599-ms time bins. The group differences in semantic competitor fixation ratios were significant from the 400- to 499-ms time bin onward.
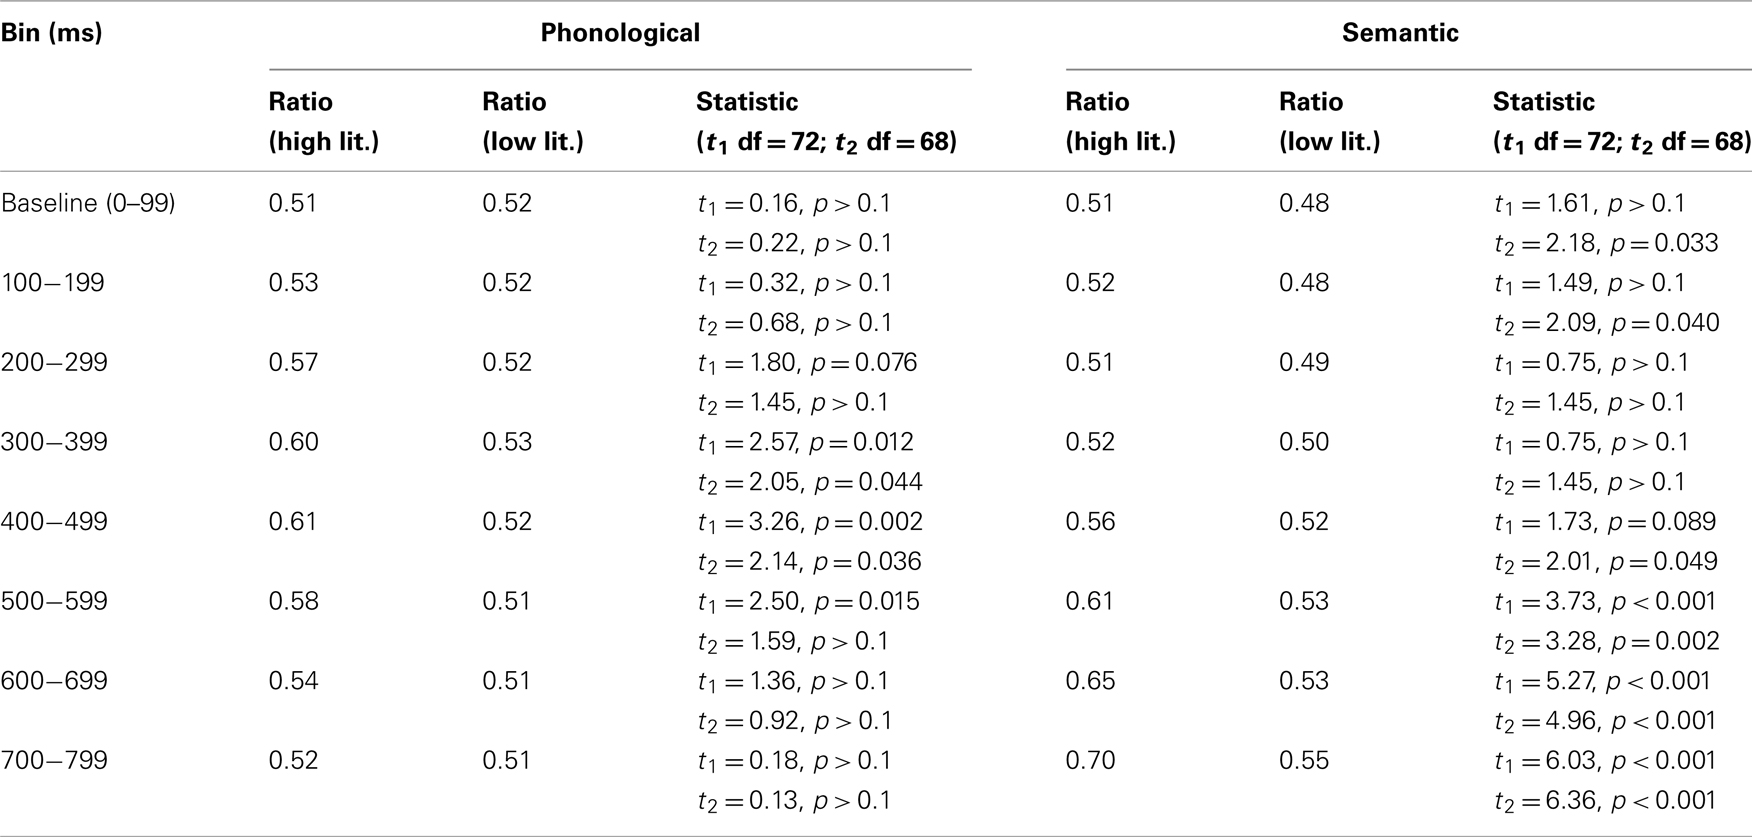
Table 1. Group comparisons (Experiment 1).
Figure 4 shows a time-course-graph of change in fixation proportions on the target objects and the averaged distractors in the filler trials. It can be seen that both high literates and low literates showed the expected visual orienting behavior, both participant groups shifted their eye gaze toward the target objects as the spoken target word acoustically unfolded. This demonstrates that low literates did not have any unexpected difficulties with the simple look and listen task we employed. A two-way ANOVA on the fixation ratio data with group (high or low literates) as between subject factor and bin (baseline, and the subsequent seven 100 ms bins) as within-subject factor revealed a significant bin by group interaction: F1(7, 504) = 8.66, p < 0.001; F2(7, 476) = 7.75, p < 0.001, a significant main effect of bin, F1(7, 504) = 78.54, p < 0.001; F2(7, 476) = 79.09, p < 0.001, and a significant main effect of group, F1(1, 72) = 51.43, p < 0.001; F2(1, 68) = 20.37, p < 0.001. We believe that the differences in the filler trials are due to that low literates rely on semantic mapping only, and as a consequence their shifts in language-mediated eye gaze will occur later than those of high literates who make use of phonological as well as semantic matches. Having said that, it cannot be ruled out however that the group differences in magnitude and timing of eye fixations in the filler trials (as well as the differences in magnitude of looks to the semantic competitors in the experimental trials) are partly due to a general processing speed deficit in the low literacy group. We will return to a discussion of this issue in the Section “General Discussion.”
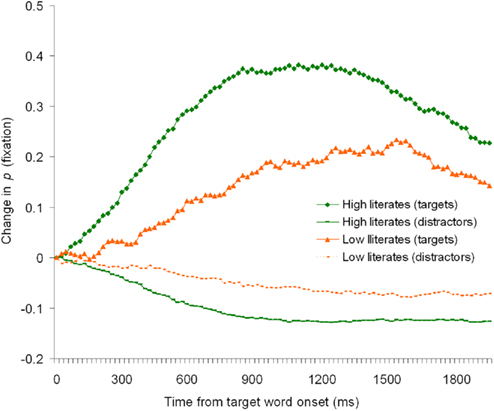
Figure 4. Change in fixation proportions for the filler trials of Experiment 1.
Discussion
The data of Experiment 1 suggest that low literates, unlike highly literate participants, do not use phonological information when matching spoken words with concurrent visual objects. One might argue that low literates do not implicitly name visually fixated objects as highly literates do and therefore could not use phonological information to direct eye gaze during word–object matching. However, Mani and Plunkett (2010) recently showed that even 18-months-olds implicitly name visually fixated images and that these implicitly generated phonological representations prime the infants’ subsequent responses in a paired visual object spoken word recognition task. It is therefore unlikely that adult low literates do not engage in such implicit object naming behavior. Nonetheless, we conducted another experiment to investigate whether low literates can ever use phonological information to guide visual orienting. It is conceivable that low literates focus attention on the possibility of semantic matches during language–vision interactions but are in principle capable of using phonological information to direct visual attention. In Experiment 2, therefore, we replaced the semantic competitors with a further set of unrelated distractors. Experiment 2 thus is a strong test of whether low literates can ever use phonological representations to guide visual orienting: The only match between spoken word and visual objects was now one involving the word-initial phonological form.
Experiment 2
Method
Participants
Twenty-nine nine high literates (15 mean years of formal education, SD = 0.98, range = 13–16) and 27 of the 33 low literates (2 mean years of formal education, SD = 2.39, range = 0–7) who took part in Experiment 1 participated in Experiment 2. All were native speakers of Hindi and had normal vision, none had known hearing problems. Word reading test mean scores were 95 (SD = 1.83, range = 89–96) for the high literates and 6.78 words (SD = 10.02, range = 0–35) for the low literates.
Materials and procedure
As in Experiment 1 there were 70 displays, each paired with a spoken sentence containing a critical word. Thirty-five trials were experimental trials, the other 35 trials were filler trials. The same stimuli as in Experiment 1 were used except that the semantic competitors were replaced by an additional distractor. The procedure was identical to the earlier experiment.
Results
Figure 5 shows a time-course-graph of change in fixation proportions on the phonological competitors and averaged distractors. The upper panel shows performance of the high literates, the lower panel shows performance of the low literacy group. The graph reveals that performance in the highly literate group (Figure 5A) followed the typical pattern. As the listener heard the beginning of “matar,” magar was as likely an interpretation as “matar” itself and thus the literates looked at the phonological competitor. As soon as acoustic information became available that mismatched with the name of the phonological competitor (e.g., the sound t in “matar”) literate participants shifted their overt attention away from the now mismatching object.
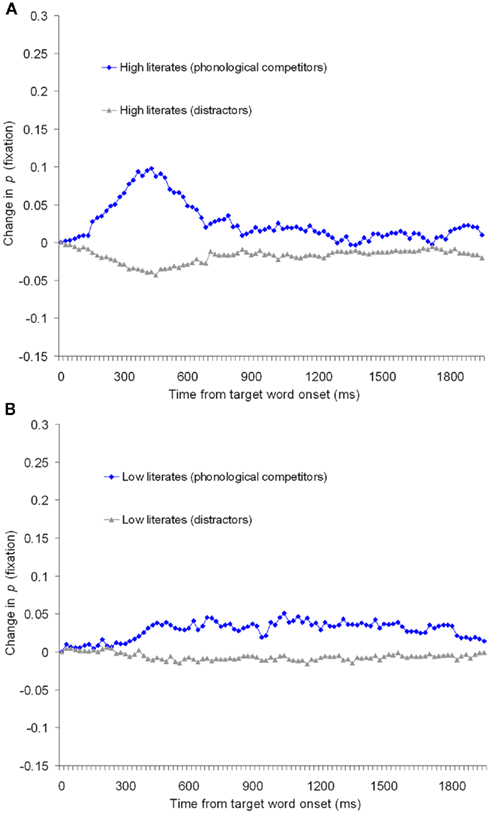
Figure 5. Change in fixation proportions in Experiment 2 for (A) high literates and (B) low literates.
Figure 5B shows that in Experiment 2 the low literates did move toward the phonological competitors which suggests that low literates in principle can use phonological knowledge to direct attention when semantic matches are impossible. However, the pattern of fixations on the phonological competitors in the low literacy group was very different from those of the highly literate group. Instead of the time-locked sharp rise of fixations to the competitor on hearing the matching phonological information and the immediate drop in fixations when the acoustic information started to mismatch, low literates’ phonologically mediated fixations did not show a sharp rise and fall but were overall long-lasting and very small in magnitude.
Figure 6 shows the mean phonological competitor fixation ratios for the first eight 100 ms time bins after the acoustic onset of the target word.
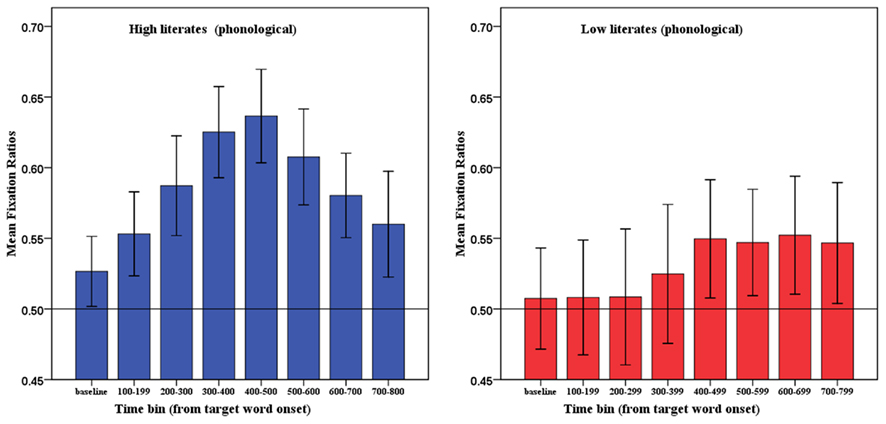
Figure 6. Mean fixation ratios in Experiment 2. Error bars represent 95% confidence intervals.
Paired t-tests showed that, for the highly literate participants, the phonological competitor/distractor ratios during the baseline time window (0.53) differed significantly from the phonological competitor/distractor ratios during the 200- to 299-ms time window (0.59), [mean difference = 0.061, 95% CI: 0.093–0.029, d = 0.38; t1(1, 28) = 3.9, p < 0.001; t2(1, 34) = 4.4, p < 0.001]; and during the 300- to 399-ms time window (0.61), [mean difference = 0.093, 95% CI: 0.136–0.061, d = 0.66; t1(1, 28) = 5.42, p < 0.001; t2(1, 34) = 4.91, p < 0.001]. The difference remained statistically significant during the 400- to 499-ms (0.64) and the 500- to 599 (0.61)-ms time windows. From the 600- to 699-ms time window onward the phonological competitor/distractor ratios did not differ statistically from the phonological competitor/distractor ratios during the baseline time window for the high literates.
Paired t-tests showed that, for the low literacy group, the difference between the phonological competitor/distractor ratios during the baseline time window (0.51) and the phonological competitor/distractor ratios during the 400- to 499-ms time window (0.55), [mean difference = 0.042, 95% CI: 0.088–0.04, d = 0.22; t1(1, 26) = 1.89, p = 0.069; t2(1, 34) = 1.67, p = 0.1]; the 500- to 599-ms time window (0.55), [mean difference = 0.039, 95% CI: 0.085–0.05, d = 0.21; t1(1, 26) = 1.81, p = 0.081; t2(1, 34) = 1.69, p = 0.1]; and the 600- to 699-ms time window (0.55), [mean difference = 0.045, 95% CI: 0.096–0.07, d = 0.23; t1(1, 26) = 1.79, p = 0.085; t2(1, 34) = 1.78, p = 0.084] approached significance.
This pattern was confirmed when the factor group was included in the analyses. A two-way ANOVA on the fixation ratio data with group (high or low literates) as between subject factor and bin (baseline, and the subsequent seven 100 ms bins) as within-subject factor revealed a significant bin by group interaction: F1(7, 378) = 2.96, p = 0.005; F2(7, 476) = 1.89, p = 0.070, a significant main effect of bin, F1(7, 378) = 7.11, p < 0.001; F2(7, 476) = 5.32, p < 0.001, and a significant main effect of group (by participants only), F1(1, 54) = 8.44, p = 0.005; F2(1, 68) = 2.59, p = 0.112.
Table 2 shows the results of independent samples t-tests (two-tailed) carried out on the ratio data for the first eight 100 ms time bins. In sum, Experiment 2 revealed significant differences in fixation behavior on the phonological competitors between high and low literates. High literates’ eye gaze was closely time-locked to the unfolding phonological input but low literates’ shifts to the phonological competitors were small and delayed.
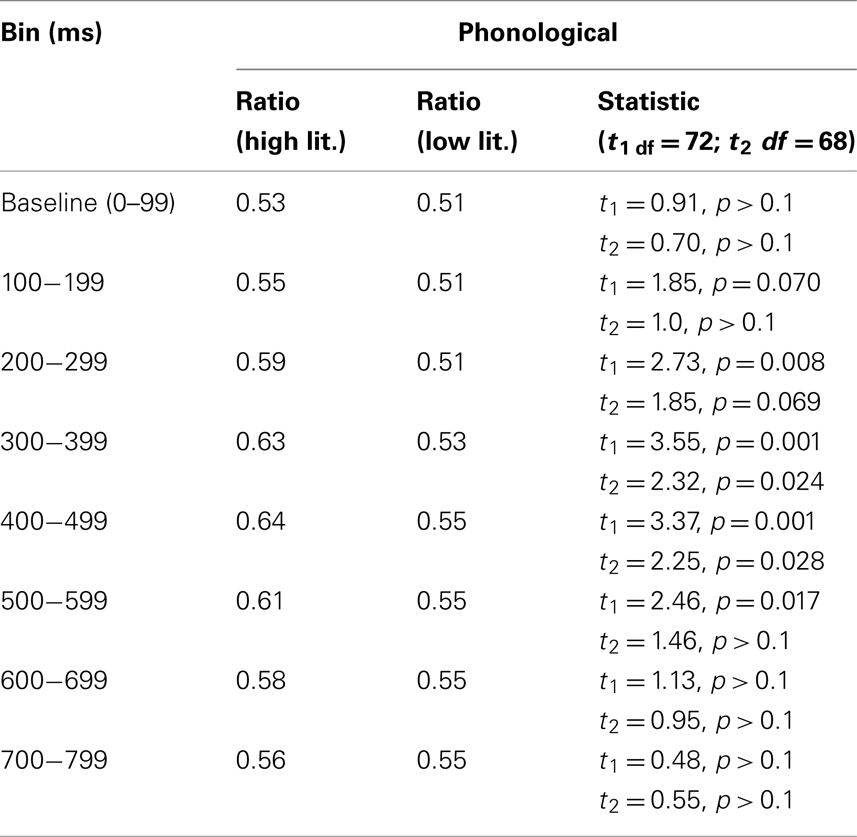
Table 2. Group comparisons (Experiment 2).
General Discussion
In two experiments Indian high literates and low literates listened to spoken Hindi sentences while looking at simple visual displays containing four common objects. Eye movement behavior of the participant groups, both in terms of where they looked and when they looked, was radically different. High literates’ eye gaze behavior was closely time-locked to the concurrent speech input. They shifted their eye gaze toward phonological competitors as soon as phonological information became available. In both experiments, as soon as phonological information started to mismatch with the phonological competitor, they moved their eyes away. Low literates in contrast did not look more at the phonological competitors than unrelated distractors at any time during the experiment when both phonological competitors and semantic competitors were co-present in the display (Experiment 1). When only phonological competitors were presented (i.e., the only possible match between spoken word and visual objects was one involving the word-initial phonological form, Experiment 2), low literates showed a small tendency to fixate the phonological competitors but this eye movement behavior was not time-locked to the unfolding acoustic information as in the highly literate participants.
It is important to note that the main difference between our participant groups was the extent to which they had taken part in any formal education. Low literates are fully integrated in Indian society and illiteracy is mainly due to socioeconomic factors. All low literates in our study were fully immersed in public life and were working on or near the university campus as janitors, cleaners, or caterers, etc. None of them appeared to be socially excluded nor did they show any signs of genetic or neurological disease.
The observed effects are also unlikely to be due to differences in processing 2D information by the low literates during picture processing. The auditory presentation of the sentence was initiated 1000 ms after the pictures appeared on the screen. Moreover, since the critical word appeared at the end of a carrier sentence (e.g., “Today he saw a crocodile”) low literates had plenty of time to process the simple objects before the critical word acoustically unfolded. Indeed our data in Experiment 2 show that low literates used phonological information (albeit inefficiently) to direct eye gaze which suggests that object identification in the low literates did advance as far as retrieval of the pictures’ names3. In addition, it is noteworthy that the reaction time (object naming) differences between complete illiterates and high literates observed by Reis et al. (2001) were relatively small (less than 200 ms). Moreover, if slow retrieval of phonological forms of the presented objects was the sole factor resulting in the observed eye gaze differences there should have been at least some early preferential looks to phonological competitors in both experiments. The reason is that even if low literates had been very slow in processing and thus failed to retrieve the phonological forms of all the presented objects, they should have retrieved the names of at least some of them. However, there was not even a hint of a bias in looks to phonological competitors in Experiment 1. Nevertheless, the present data cannot rule out with absolute certainty that the differences in phonologically mediated eye gaze in the present study were due to very slow name retrieval during picture processing in the low literacy group. Future research could usefully be directed at further establishing whether the absence of efficient phonologically based language–vision mapping is primarily due to inefficient phonological processing or partly due to very slow name retrieval during object-recognition/picture processing.
Low literates eye fixations to the target objects in the filler trials (e.g., the plate on hearing the target word “plate”) occurred about 200 ms later than for the high literates. There was also a reduction in the magnitude of target fixations in the filler trials and in the magnitude of fixations to the semantic competitors in Experiment 1. As pointed out above, the speed advantage may entirely be due to that high (but not low) literates make use of phonological mapping between spoken word and visual objects. Phonological mapping tends to occur earlier than semantic mapping and given that our results suggest that low literates tend to rely on semantic mapping only, their shifts in language-mediated eye gaze will thus tend to occur later than those of high literates who make use of phonological as well as semantic matches. It cannot be ruled out that the differences in magnitude and timing of eye fixations are partly due to a general processing speed deficit in the low literacy group. Consistent with this possibility, Stoodley and Stein (2006), for instance, presented some evidence that dyslexics and poor readers showed a general motor slowing related to a general deficit in processing speed. In other words it is possible that “performance in many cognitive tasks is limited by general processing constraints, in addition to restrictions of knowledge (declarative, procedural, and strategic), and variations in efficiency or effectiveness of specific processes… it is assumed that general limitations frequently impose constraints on many types of processing and, hence, that they have consequences for the performance of a large variety of cognitive tasks” (Salthouse, 1996, pp. 403–404). Establishing a causal relationship between general processing speed and performance during language-mediated visual search will be far from trivial since the underlying sources of individual differences in the speed of mental processing are numerous and complex (see Roberts and Stankov, 1999, for extensive discussion). Future research might also usefully explore the possibility of a partial contribution of individual differences in processing speed to the effects reported here.
In any case, our data do show that low literates’ use of phonological information during the mapping of spoken words with visual objects is very different from that of high literates and reflects more than just a general slow down in processing. Although Experiment 2 demonstrates that low literates can use phonological information during word–object matching when “pushed” (i.e., when mapping on semantic information is impossible), their phonologically mediated eye movements are clearly not like the proficient deployment of this type of information by high literates. High literates’ performance replicates previous results with Western literates (Huettig and McQueen, 2007). Because speech unfolds over time speech recognition is incremental (Marslen-Wilson and Welsh, 1978; Zwitserlood, 1989). As acoustic information arrives, it immediately constrains the search amongst candidate word hypotheses. Candidates that continue to match the available information keep being considered (e.g., “magar” on hearing “matar”) and phonological competitor objects attract overt attention but as soon as mismatching phonological information arrives they are no longer considered as likely lexical candidates and high literates shift their eye gaze away from the now phonologically mismatching objects.
One might argue that low literates could in principle use phonological information as efficiently as high literates but did not do so in the current task. We can reject this account of our data. Low literates did not indicate any difficulty in self-report. The simple look and listen task we used is similar to every day situations in which low and high literates change their direction of eye gaze contingent upon spoken language input (“there is a goat grazing over there”). Moreover, previous research has found that active and look and listen eye-tracking tasks give similar results (see Huettig and McQueen, 2007, for discussion). An advantage of look and listen tasks is that they allow researchers to evaluate whether particular competition effects are more general features of language–vision interactions rather than being restricted to certain goal-specific task demands. Importantly, such a task-difficulty account cannot explain why low literates in the present study showed semantic mapping behavior similar to that of high literates.
Why do low literates not use phonological information to direct visual orienting in a proficient manner? As is clear from the above literature review, the notion that the acquisition of reading strengthens existing phonological representations and its retrieval is by no means new. Acquisition of grapheme–phoneme conversion, i.e., learning to read, involves many years of practice of phonological decoding. Morais and colleagues for instance have shown that phonemic awareness requires explicit teaching and does not develop automatically (e.g., Morais et al., 1979, 1986). There is also evidence that learning to read results in structural brain changes (e.g., Castro-Caldas et al., 1999; Petersson et al., 2007). Carreiras et al. (2009), using structural imaging techniques, for instance found that the acquisition of reading led to an increased functional coupling from visual to phonological processing areas of the brain (cf. Draganski et al., 2004). Dehaene et al. (2010) used fMRI with 10 illiterates, 22 ex-illiterates, and 31 literates from Brazil and Portugal. They observed that activation to spoken sentences in literates doubled (compared to illiterates) in the Planum temporale indicating that this region is implicated in the enhanced phonemic processing which typically accompanies literacy. Responses to spoken sentences in literates, but not illiterates, suggested that there can be top-down activation of the so-called visual word form area (VWFA) during speech processing. Dehaene et al. proposed that thus both, online activation of an orthographic code (activation of the Planum temporale) and additional and optional orthographic recruitment (activation of the VWFA) are involved when spoken words are processed in literates.
We conjecture that one of the consequences of the strengthening of existing phonological representations in literates is a greater likelihood that these representations are used for other cognitive purposes such as when spoken words must be mapped onto concurrent visual referents. The present results with Indian high literates replicate previous results with Western high literates that in proficient language users there is a tight coupling between phonological representations retrieved during visual processing and phonological representations retrieved during online spoken language processing. This is particularly evident from the task used in the present research, namely language-mediated visual search (Cooper, 1974; Huettig et al., 2011, for review; Wolfe, 1994; Desimone and Duncan, 1995). In such a situation individuals establish matches at phonological and semantic (and visual) levels of processing between information extracted from the visual environment and from the speech signal. Shifts in overt attention are co-determined by the type of information in the visual environment, the timing of cascaded processing in the word- and object-recognition systems, and the temporal unfolding of the spoken language (Huettig and McQueen, 2007). Our findings indicate that low literates exhibit a similar cognitive behavior but instead of participating in a tug-of-war among multiple types of cognitive representations, word–object mapping appears to be achieved primarily at the semantic level. If forced, for instance by a situation in which semantic matches are impossible, low literates may on occasion have to rely on phonological information but do so in a much less proficient manner than their highly literate counterparts.
Conflict of Interest Statement
The authors declare that the research was conducted in the absence of any commercial or financial relationships that could be construed as a potential conflict of interest.
Acknowledgments
The order of authorship is arbitrary, Falk Huettig and Ramesh Kumar Mishra contributed equally to this paper. Support was provided by the Max Planck Society (Falk Huettig) and a grant from the Department of Science and Technology, India (Ramesh Kumar Mishra).
Footnotes
- ^We will use the term “literates” for the sake of simplicity throughout this paper. It is notoriously difficult to separate effects of literacy from more general effects of formal education since all forms of reading instruction inevitably involve (at least some) aspects associated with formal education. More research could usefully be directed at distinguishing influences of learning to read from influences of formal schooling though obtaining conclusive evidence on this issue clearly will be far from an easy task (if possible at all).
- ^Read et al. (1986) showed that it is not literacy per se (i.e., the ability to read and write) but alphabetic literacy (i.e., the knowledge of an alphabetic script), which results in the difficulty in phonemic awareness tasks. They found that phonemic awareness of Mandarin readers who had no alphabetic knowledge was similar to illiterates. In contrast, the phonemic awareness of Mandarin readers who had alphabetic knowledge was similar to those of late-literates.
- ^Note that all the pictures in the present study were of very simple common objects. In a different recent study we observed very high picture naming accuracy scores for the identical pictures. Fifteen low literates (which included seven of the participants of the present study) obtained naming accuracy scores of 88% (phonological competitors), 93% (semantic competitors), and 94% (unrelated distractors). The corresponding naming accuracy scores of high literates in that study were 92% (phonological competitors), 96% (semantic competitors), and 97% (unrelated distractors). This further suggests that it is very unlikely that the absence of phonological competition effects in the low literates in the present study was due to that low literates may have not known the objects’ names.
References
Adrian, J. A., Alegria, J., and Morais, J. (1995). Metaphonological abilities of Spanish illiterate adults. Int. J. Psychol. 30, 329–353.
Allopenna, P. D., Magnuson, J. S., and Tanenhaus, M. K. (1998). Tracking the time course of spoken word recognition using eye movements: evidence for continuous mapping models. J. Mem. Lang. 38, 419–439.
Altmann, G. T. M. (2011). Language can mediate eye movement control within 100 milliseconds, regardless of whether there is anything to move the eyes to. Acta Psychol. (Amst.) 137, 190–200.
Arnett, J. (2008). The neglected 95%: why American psychology needs to become less American. Am. Psychol. 63, 602–614.
Carreiras, M., Seghier, M., Baquero, S., Estévez, A., Lozano, A., Devlin, J. T., and Price, C. J. (2009). An anatomical signature for literacy. Nature 461, 983–988.
Castro-Caldas, A., Miranda, P. C., Carmo, I., Reis, A., Leote, F., Ribeiro, C., and Ducla-Soares, E. (1999). Influence of learning to read and write on the morphology of the corpus callosum. Eur. J. Neurol. 6, 23–28.
Chéreau, C., Gaskell, M. G., and Dumay, N. (2007). Reading spoken words: orthographic effects in auditory priming. Cognition 102, 341–360.
Cooper, R. M. (1974). The control of eye fixation by the meaning of spoken language: a new methodology for the real-time investigation of speech perception, memory, and language processing. Cogn. Psychol. 6, 84–107.
Cree, G. S., and McRae, K. (2003). Analyzing the factors underlying the structure and computation of the meaning of chipmunk, cherry, chisel, cheese, and cello (and many other such concrete nouns). J. Exp. Psychol. Gen. 132, 163–201.
Da Silva, C., Petersson, K. M., Faísca, L., Ingvar, M., and Reis, A. (2004). The effects of literacy and education on the quantitative and qualitative aspects of semantic verbal fluency. J. Clin. Exp. Neuropsychol. 26, 266–277.
Dehaene, S., Pegado, F., Braga, L. W., Ventura, P., Filho, G. N., Jobert, A., Dehaene-Lambertz, G., Kolinsky, R., Morais, J., and Cohen, L. (2010). How learning to read changes the cortical networks for vision and language. Science 330, 1359–1364.
Desimone, R., and Duncan, J. (1995). Neural mechanisms of selective visual attention. Annu. Rev. Neurosci. 18, 193–222.
Dijkstra, A., Roelofs, A., and Fieuws, S. (1995). Orthographic effects on phoneme monitoring. Can. J. Exp. Psychol. 49, 264–271.
Draganski, B., Gaser, C., Busch, V., Schuierer, G., Bogdahn, U., and May, A. (2004). Neuroplasticity: changes in grey matter induced by training. Nature 427, 311–312.
Dunabeitia, J. A., Aviles, A., Afonso, O., Scheepers, C., and Carreiras, M. (2009). Qualitative differences in the representation of abstract versus concrete words: evidence from the visual-world paradigm. Cognition 110, 284–292.
Hallé, P., Chéreau, C., and Segui, J. (2000). Where is the /b/ in “absurde” [apsyrd]? It is in French listeners’ minds. J. Mem. Lang. 43, 618–639.
Henrich, J., Heine, S. J., and Norenzayan, A. (2010). The weirdest people in the world? Behav. Brain Sci. 33, 61–83; 111–135.
Huettig, F., and Altmann, G. T. M. (2005). Word meaning and the control of eye fixation: semantic competitor effects and the visual world paradigm. Cognition 96, B23–B32.
Huettig, F., and McQueen, J. M. (2007). The tug of war between phonological, semantic, and shape information in language-mediated visual search. J. Mem. Lang. 54, 460–482.
Huettig, F., Olivers, C. N. L., and Hartsuiker, R. J. (2011). Looking, language, and memory: bridging research from the visual world and visual search paradigms. Acta Psychol. (Amst.) 137, 138–150.
Huettig, F., Quinlan, P. T., McDonald, S. A., and Altmann, G. T. M. (2006). Models of high-dimensional semantic space predict language-mediated eye movements in the visual world. Acta Psychol. (Amst.) 121, 65–80.
Kolinsky, R., Morais, J., and Verhaeghe, A. (1994). Visual separability: a study on unschooled adults. Perception 23, 471–486.
Kolinsky, R., Cary, L., and Morais, J. (1987). Awareness of words as phonological entities: the role of literacy. Appl. Psycholinguist. 8, 223–232.
Kosmidis, M. K., Tsapkini, K., Folia, V., Vlahou, C., and Kiosseoglou, G. (2004). Semantic and phonological processing in illiteracy. J. Int. Neuropsychol. Soc. 10, 818–827.
Landauer, T. K., and Dumais, S. T. (1997). A solution to Plato’s problem: the latent semantic analysis theory of acquisition, induction and representation of knowledge. Psychol. Rev. 104, 211–240.
Luria, A. R. (1976). Cognitive Development: Its Cultural and Social Foundations. Cambridge: Harvard University Press.
MacDonald, J., and McGurk, H. (1978). Visual influences on speech perception process. Percept. Psychophys. 24, 253–257.
Mani, N., and Plunkett, K. (2010). In the infant’s mind’s ear: evidence for implicit naming in 18 month-olds. Psychol. Sci. 21, 908–913.
Manly, J. J., Jacobs, D. M., Sano, M., Bell, K., Merchant, C. A., Small, S. A., and Stern, Y. (1999). Effect of literacy on neuropsychological test performance in non-demented, education-matched elders. J. Int. Neuropsychol. Soc. 5, 191–202.
Marslen-Wilson, W., and Welsh, A. (1978). Processing interactions and lexical access during word recognition in continuous speech. Cogn. Psychol. 10, 29–63.
Matin, E., Shao, K., and Boff, K. (1993). Saccadic overhead: information processing time with and without saccades. Percept. Psychophys. 53, 372–380.
McDonald, S. A. (2000). Environmental Determinants of Lexical Processing Effort. Unpublished Doctoral Dissertation. Scotland: University of Edinburgh.
McQueen, J. M., and Huettig, F. (in press). Changing only the probability that spoken words will be distorted changes how they are recognized. J. Acoust. Soc. Am.
McQueen, J. M., and Viebahn, M. C. (2007). Tracking recognition of spoken words by tracking looks to printed words. Q. J. Exp. Psychol. 60, 661–671.
Meyer, A. S., Belke, E., Telling, A. L., and Humphreys, G. W. (2007). Early activation of object names in visual search. Psychon. Bull. Rev. 14, 710–716.
Meyer, A. S., and Damian, M. F. (2007). Activation of distractor names in the picture-picture interference paradigm. Mem. Cognit. 35, 494–503.
Morais, J., Bertelson, P., Cary, L., and Alegria, J. (1986). Literacy training and speech segmentation. Cognition 24, 45–64.
Morais, J., Cary, L., Alegria, J., and Bertelson, P. (1979). Does awareness of speech as a sequence of phones arise spontaneously? Cognition 7, 323–331.
Morais, J., Castro, S.-L., and Kolinsky, R. (1991). “La reconnaissance des mots chez les adultes illettre’s,” in La reconnaissance des mots dans les diffe’rentes modalite’s sensorielles. Etudes de psycholinguistique cognitive, eds R. Kolinsky, J. Morais, and J. Segui (Paris: Presses Universitaires de France), 59–80.
Morais, J., Castro, S.-L., Scliar-Cabral, L., Kolinsky, R., and Content, A. (1987). The effects of literacy on the recognition of dichotic words. Q. J. Exp. Psychol. A 39, 451–465.
Morais, J., Content, A., Cary, L., Mehler, J., and Segui, J. (1989). Syllabic segmentation and literacy. Lang. Cogn. Process. 4, 57–67.
Morais, J., and Kolinsky, R. (2001). “The literate mind and the universal human mind,” in Language, Brain and Cognitive Development, ed. E. Dupoux (Cambridge, MA: MIT Press), 463–480.
Nelson, D. L., McEvoy, C. L., and Schreiber, T. A. (1998). The University of South Florida Word Association, Rhyme, and Word Fragment Norms. Available at: http://www.usf.edu/FreeAssociation/ [Retrieved December 10, 2004].
Petersson, K. M., Silva, C., Castro-Caldas, A., Ingvar, M., and Reis, A. (2007). Literacy: a cultural influence on functional left–right differences in the inferior parietal cortex. Eur. J. Neurosci. 26, 791–799.
Read, C., Zhang, Y., Nie, H., and Ding, B. (1986). The ability to manipulate speech sounds depends on knowing alphabetic writing. Cognition 24, 31–44.
Reis, A., and Castro-Caldas, A. (1997). Illiteracy: a bias for cognitive development. J. Int. Neuropsychol. Soc. 3, 444–450.
Reis, A., Faísca, L., Ingvar, M., and Petersson, K. M. (2006). Color makes a difference: two-dimensional object naming in literate and illiterate subjects. Brain Cogn. 60, 49–54.
Reis, A., Petersson, K. M., Castro-Caldas, A., and Ingvar, M. (2001). Formal schooling influences two- but not three-dimensional naming skills. Brain Cogn. 47, 397–411.
Roberts, R. D., and Stankov, L. (1999). Individual differences in speed of mental processing and human cognitive abilities: toward a taxonomic model. Learn. Individ. Differ. 11, 1–120.
Salthouse, T. A. (1996). The processing-speed theory of adult age differences in cognition. Psychol. Rev. 103, 403–428.
Serniclaes, W., Ventura, P., Morais, J., and Kolinsky, R. (2005). Categorial perception of speech sounds in illiterate adults. Cognition 98, 835–844.
Stoodley, C. J., and Stein, J. F. (2006). A processing speed deficit in dyslexic adults? Evidence from a peg-moving task. Neurosci. Lett. 399, 264–267.
UNESCO. (2008). International Literacy Statistics: A Review of Concepts, Methodology, and Current Data. Montreal: UNESCO.
Ventura, P., Kolinsky, R., Querido, L., Fernandes, S., and Morais, J. (2007). Is phonological encoding in naming influenced by literacy? J. Psycholinguist. Res. 36, 341–360.
Ventura, P., Morais, J., Pattamadilok, C., and Kolinsky, R. (2004). The locus of the orthographic consistency effect in auditory word recognition. Lang. Cogn. Process. 19, 57–95.
Wolfe, J. M. (1994). Guided Search 2.0. A revised model of visual search. Psychon. Bull. Rev. 1, 202–238.
Yee, E., Overton, E., and Thompson-Schill, S. L. (2009). Looking for meaning: eye movements are sensitive to overlapping semantic features, not association. Psychon. Bull. Rev. 16, 869–874.
Keywords: attention, eye movements, literacy, phonological processing, semantic processing
Citation: Huettig F, Singh N and Mishra RK (2011) Language-mediated visual orienting behavior in low and high literates. Front. Psychology 2:285. doi: 10.3389/fpsyg.2011.00285
Received: 27 June 2011; Paper pending published: 04 September 2011;
Accepted: 10 October 2011; Published online: 28 October 2011.
Edited by:
José Junça De Morais, Université Libre de Bruxelles, BelgiumReviewed by:
Jon Andoni Duñabeitia, Basque Center on Cognition, SpainPrathibha Karanth, The Com DEALL Trust, India
Copyright: © 2011 Huettig, Singh and Mishra. This is an open-access article subject to a non-exclusive license between the authors and Frontiers Media SA, which permits use, distribution and reproduction in other forums, provided the original authors and source are credited and other Frontiers conditions are complied with.
*Correspondence: Falk Huettig, Max Planck Institute for Psycholinguistics, P.O. Box 310, 6500 AH Nijmegen, Netherlands. e-mail: falk.huettig@mpi.nl