


Abstract
CCD photometry is presented for 20 dIrr galaxies situated in the nearby complexes CenA/M83, and CVnI as well as in the general field of the Local Volume. We present integrated magnitudes of the galaxies in B, V, I bands and also surface brightness profiles to a median isophote μB∼ 28 mag arcsec−2. The popular Sersic parametrization of surface brightness profiles generally does a poor job of simultaneously fitting the inner cores and outer exponential surface brightness fall-offs observed in many of our targets. The observed sample is a part of a general project to image about 500 nearby (D < 10 Mpc) dwarf galaxies in multiple bands.
1 INTRODUCTION
Dwarf galaxies in the Local Volume (LV) (D≤ 10 Mpc) are well recognized now as important objects for our understanding of such diverse topics as star formation, galaxy evolution and large-scale structure. Many nearby galaxies are well resolved into individual stars, which give a possibility to estimate their distances via the luminosity of the tip of red giant branch (TRGB). The study of the nearby Universe allows us to probe the cosmic structure and galaxy properties at the present epoch and thus serves as a reference for evolutionary studies. Recent systematic surveys for dwarf galaxies have doubled the number of objects known in the LV, which are collected in the Catalogue of Neighbouring Galaxies (CNG; Karachentsev et al. 2004). Recent discoveries (see e.g. Belokurov et al. 2006; Koposov et al. 2008) also increase extremely the number of known dwarf galaxies in our Local Group. Unfortunately, the discovery of large numbers of nearby galaxies, mostly of low-surface brightness, has not been accompanied by systematic photometric studies. As a result, many new members of the LV so far have only rough estimates of their apparent magnitudes. There is no homogeneous optical survey embracing galaxies of both Northern and southern hemispheres. The uniform survey Two Micron All Sky Survey (2MASS) was performed in the near-infrared bands (Jarrett et al. 2000). However, it was insensitive to objects of low-surface brightness because of short exposure times and high sky backgrounds. Most LV galaxies are not represented in 2MASS. About 65 per cent of our sample galaxies are presented in the Sloan Digital Sky Survey (SDSS), but the exposures are too short to analyse the low-surface brightness objects. At present, we are faced with the strange situation that the majority of the LV galaxies have radial velocities measured with ∼1 per cent accuracy and distances determined with an error ∼10 per cent, but the integrated magnitudes of many nearby galaxies have uncertainties of 0.5 mag. This discordance makes it difficult to study the faint end of the luminosity function in detail. The main photometric parameters, such as total magnitudes and colours, remain poorly known for many nearby dwarf galaxies. A study of these galaxies not only in visual bands (B and V Johnson–Cousins filters), but also in the near-infrared (I Cousins filter), where extinction is less, can make it possible to investigate in detail the galaxy morphology and structure of these galaxies.
This is the fourth paper in a series of articles that present results from the observations of nearby dwarf galaxies, including presentation of their general photometric parameters. In the previous papers (Makarova 1999; Makarova et al. 2002, 2005), we described photometry of 78 nearby galaxies. Here, we present photometric data for 20 more dwarf galaxies observed with the University of Hawaii 2.2 m telescope.
2 OBSERVATIONS
The galaxies were selected from the CNG in accordance with the observation season. About two-thirds of the galaxies turn out to be members of two nearby complexes: CenA/M83 group and Canes Venatici I cloud, the remaining ones lie in the general field. Some basic parameters of the sample galaxies are presented in Table 1. The columns are as follows. Column 1: galaxy name. Column 2: LEDA number. Column 3 and 4: right ascension and Declination (2000). Column 5: major angular diameter from the CNG in arcminutes. Column 6: galactic absorption in B band taken from IRAS/DIRBE maps (Schlegel, Finkbeiner & Davis 1998). Galactic absorption in V and I can be computed as follow: AV= 0.768 AB and AI= 0.449 AB. Column 7: heliocentric radial velocity in km s−1. Column 8: the Local Group centroid radial velocity. Column 9: galaxy distance in Mpc. Column 10: source of the distance and method of its estimation: h – radial velocity; TRGB – tip of the red giant branch; BS – brightest supergiants.
General parameters of the sample.
| Name | LEDA no. | RA | Dec. | D arcmin | AB | Vh km s−1 | VLG km s−1 | Dist. Mpc | Method |
| KKH 46 | 2807128 | 09 08 36.6 | +05 17 32 | 0.7 | 0.20 | 598 | 409 | 6 | CNG, h |
| D634–03 | 2806961 | 09 08 53.5 | +14 34 55 | 0.4 | 0.16 | 319 | 173 | 9.5 | [1], TRGB |
| Antlia | 029194 | 10 04 04.0 | –27 19 55 | 2.0 | 0.34 | 362 | 66 | 1.3 | [2], TRGB |
| KKH 60 | 2807134 | 10 15 59.4 | +06 48 17 | 0.8 | 0.09 | 290: | – | – | – |
| UGC 5672 | 30818 | 10 28 20.9 | +22 34 17 | 1.8 | 0.10 | 531 | 428 | 6 | CNG, BS |
| KKs44 | 36014 | 11 37 53.2 | −39 13 13 | 1.4 | 0.62 | 654 | 362 | 6.1 | [3], TRGB |
| KK 144 | 166137 | 12 25 27.9 | +28 28 57 | 1.5 | 0.11 | 483 | 453 | 6 | CNG, h |
| KK 149 | 41093 | 12 28 52.3 | +42 10 40 | 0.8 | 0.11 | 407 | 446 | 6 | CNG, h |
| KK 151 | 41314 | 12 30 23.8 | +42 54 05 | 1.2 | 0.08 | 436 | 479 | 7 | CNG, h |
| KK 160 | 166142 | 12 43 57.4 | +43 39 41 | 0.8 | 0.11 | 293 | 346 | 5 | CNG, h |
| ESO 381–018 | 42936 | 12 44 42.7 | −35 58 00 | 1.2 | 0.27 | 610 | 353 | 5.3 | [3], TRGB |
| ESO 381–020 | 43048 | 12 46 00.4 | −33 50 17 | 3.0 | 0.28 | 585 | 332 | 5.4 | [3], TRGB |
| KKSG 37 | 3097714 | 12 48 01.0 | −12 39 22 | 0.6 | 0.22 | 84: | – | – | – |
| ESO 443–09 | 43978 | 12 54 53.6 | −28 20 27 | 0.8 | 0.28 | 645 | 410 | 5.5 | [3], TRGB |
| DDO 155 | 44491 | 12 58 40.4 | +14 13 03 | 1.1 | 0.11 | 214 | 136 | 2.1 | CNG, TRGB |
| PGC 45628 | 45628 | 13 09 36.6 | −27 08 26 | 0.6 | 0.33 | 693 | 470 | 6 | CNG, h |
| PGC 170257 | 170257 | 13 29 21.0 | −21 10 45 | 0.6 | 0.46 | 650 | 457 | 6 | CNG, h |
| UGC 8651 | 48332 | 13 39 53.8 | +40 44 21 | 2.3 | 0.03 | 202 | 272 | 3.0 | [2], TRGB |
| UGC 8760 | 49158 | 13 50 51.1 | +38 01 16 | 2.2 | 0.07 | 191 | 257 | 3.2 | [2], TRGB |
| UGC 8833 | 49452 | 13 54 48.7 | +35 50 15 | 0.9 | 0.05 | 226 | 285 | 3.2 | [2], TRGB |
Our targets were observed using the 2.2 m University of Hawaii telescope at Mauna Kea Observatory, Hawaii, USA on 2004 February 17–22. We carried out direct imaging of the galaxies using the Optic CCD Camera, which gives a 9.3 × 9.3 arcmin2 field of view with the pixel scale of 0.14 arcsec/pixel. The galaxy images were obtained using B, V and I Johnson–Cousins filters with typical exposure time of 1200, 900 and 600 s, respectively. Bias frames, twilight flats and standard fields from Landolt (1992) were observed each night for the calibration.
3 DATA REDUCTION
3.1 Initial processing
The images were processed using the ccdproc package within iraf. Initial processing of the data contained usual steps such as bias and dark frame subtraction and flat-fielding. Further reductions were made with the midas package developed by European Southern Observatory (ESO). Cosmic ray hits were removed with the filter/cosmic procedure. The galaxy images obtained in the same filter were then co-added. The resulting B-band images of the galaxies under study are presented in Fig. 1. The picture size is 3.5 × 3.5 arcmin2, north is up and east is left.
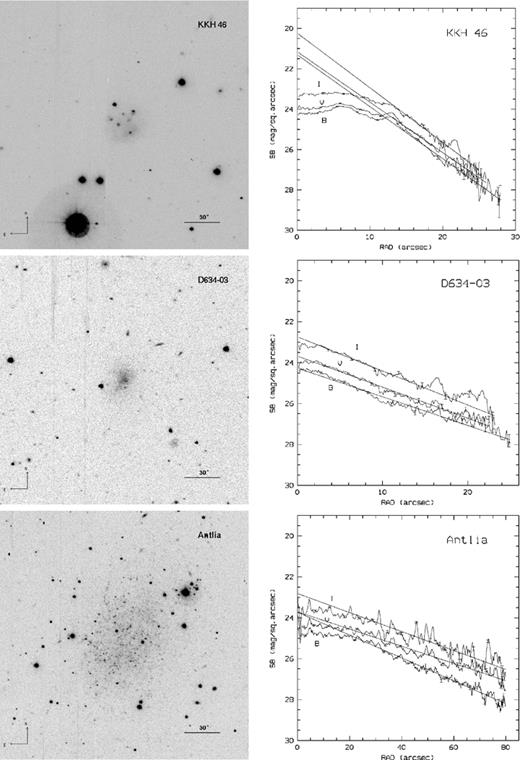
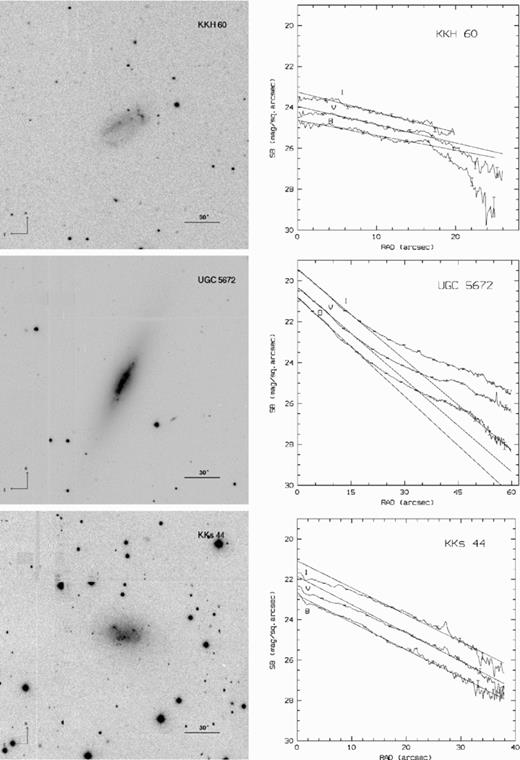
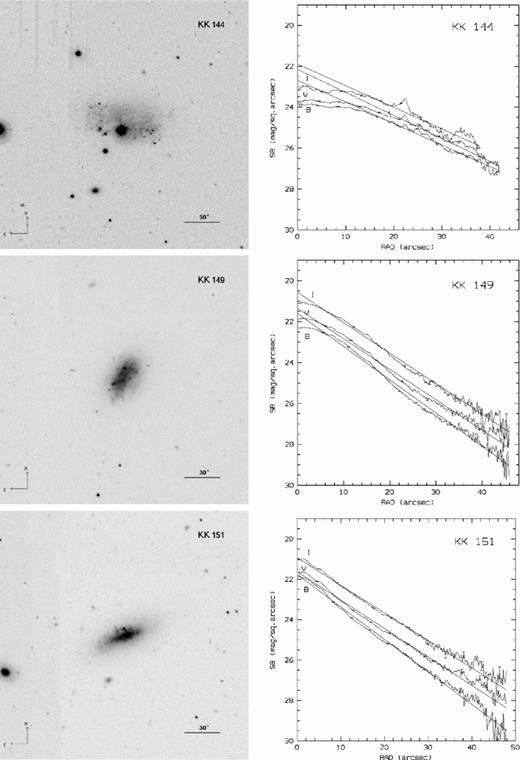
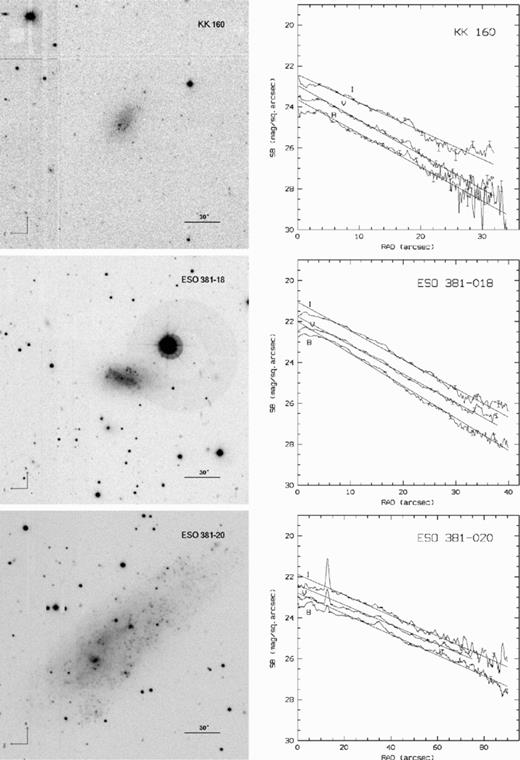
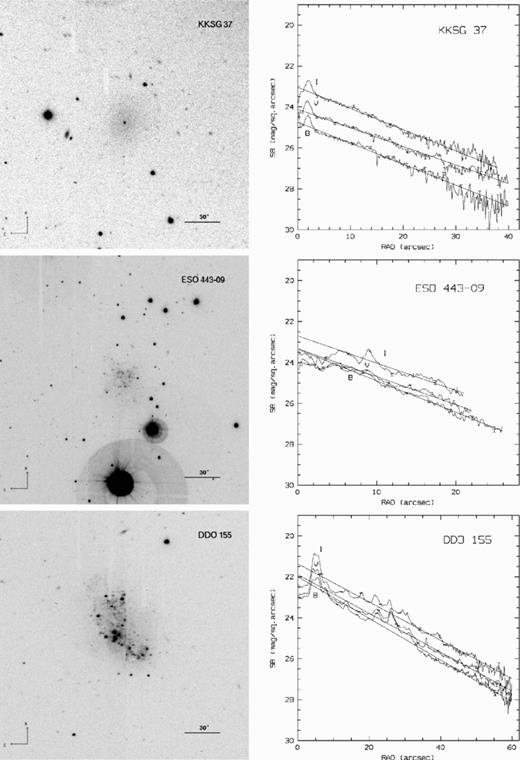
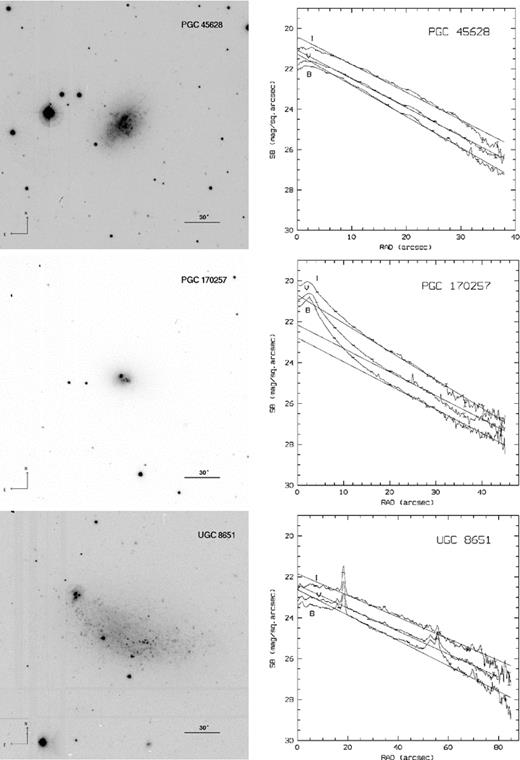
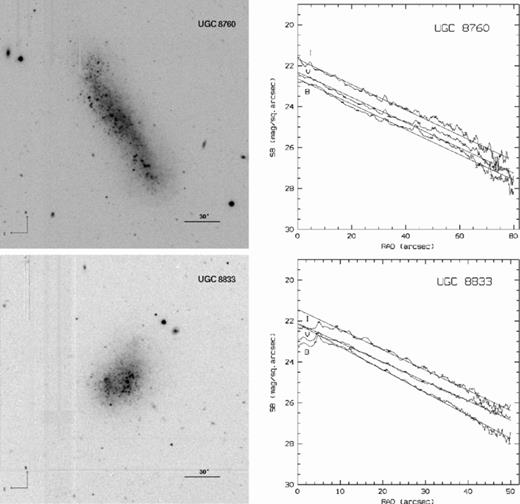
B-band images and B, V, I surface brightness profiles of the galaxies under study. The picture sizes are 3.5 × 3.5 arcmin2, north is up and east is left.
3.2 Sky background determination
Background stars were removed from the frames by fitting a second-degree surface in circular pixel area. The sky background was then approximated by a tilted plane, created from a two-dimensional polynomial, using the least-squares method (fit/flat_sky). The accuracy of the sky background determination is about 0.6–1.0 per cent of the original sky level. A typical value of the sky surface brightness is near 23 mag arcsec−2 in B band. Therefore, the mean error of sky determination does not exceed 0.14–0.23 mag.
3.3 Photometric calibration
To transform the instrumental magnitudes to the standard Johnson–Cousins system, zero-points and colour coefficients were determined from the standard stars observed in the clear photometric nights at February 17, 18 and 20. We used the mean Mauna Kea summit extinction coefficients for the transformation due to non-stable result of these coefficient measurements from our data. Too few stars were observed to constrain such measurements. The observational nights at February 21 and 22 were partially non-photometric. Therefore, we used zero-points obtained from the appropriate standard field closest to the time of the respective observations. These zero-points have good agreement: the additional uncertainty in the calibration will not exceed 0.03 mag in B, and 0.02 mag in V and I. The uncertainty of the overall transformation to the standard system is 0.01 mag in the B, V and I filters.
4 PHOTOMETRIC MEASUREMENTS
4.1 Total magnitudes
To measure total galaxy magnitudes in each band, integrated photometry was performed in circular apertures with increasing radii from a pre-chosen centre to the faint outskirts of the galaxies. The centres were determined interactively, because a significant part of the sample consists of the galaxies of irregular morphology. The total magnitude was then estimated as the asymptotic value of the obtained radial growth curve. The uncertainties of the total magnitude determination were 0.05 mag in B, 0.05 mag in V and 0.08 mag in I. The measurement results are summarized in Table 2, where the columns are as follows. Column 1: galaxy name. Column 2, 3 and 4: total magnitudes in B, V and I band, respectively (not corrected for galactic absorption). Column 5 and 6: total colour B−V and V−I, respectively (not corrected for galactic absorption). Column 7: the standard diameter (arcsec) at the surface brightness level of 25 mag arcsec−2 in B band. Column 8: the Holmberg diameter (arcsec) corresponding to the blue surface brightness of 26.5 mag arcsec−2. Column 9:B magnitude within the Holmberg diameter. Column 10: absolute B total magnitude corrected for Galactic absorption.
Total magnitudes of the dwarf galaxies.
| Name | BT mag | VT mag | IT mag | B−V mag | V−I mag | D25 arcsec | DHolm arcsec | BHolm mag | MB mag |
| KKH 46 | 16.96 | 16.72 | 16.27 | 0.24 | 0.45 | 28.8 | 41.2 | 16.97 | −12.02 |
| D634–03 | 18.27 | 17.78 | 16.92 | 0.49 | 0.86 | 11.0 | 28.8 | 18.45 | −11.77 |
| Antlia | 15.57 | 15.16 | 14.60 | 0.41 | 0.56 | 47.6 | 92.6 | 15.70 | −10.37 |
| KKH 60 | 17.76 | 17.24 | 16.64 | 0.52 | 0.60 | 12.0 | 28.4 | 17.90 | − |
| UGC 5672 | 14.48 | 13.69 | 12.79 | 0.79 | 0.90 | 60.0 | 98.0 | 14.52 | −14.62 |
| KKs44 | 16.30 | 15.74 | 14.71 | 0.56 | 1.03 | 32.6 | 57.0 | 16.34 | −13.24 |
| KK 144 | 15.86 | 15.53 | 14.96 | 0.33 | 0.57 | 46.0 | 72.4 | 15.91 | −13.25 |
| KK 149 | 15.54 | 15.04 | 14.31 | 0.50 | 0.73 | 40.0 | 55.0 | 15.59 | −13.53 |
| KK 151 | 15.63 | 15.16 | 14.49 | 0.47 | 0.67 | 38.8 | 60.0 | 15.71 | −13.58 |
| KK 160 | 17.65 | 17.02 | 16.10 | 0.63 | 0.92 | 14.8 | 36.2 | 17.87 | −10.87 |
| ESO 381–018 | 15.73 | 15.30 | 14.67 | 0.43 | 0.63 | 39.0 | 68.4 | 15.73 | −13.17 |
| ESO 381–20 | 14.24 | 13.93 | 13.32 | 0.31 | 0.61 | 90.0 | 150.0 | 14.28 | −14.72 |
| KKSG 37 | 18.58 | 17.78 | 16.77 | 0.80 | 1.01 | 6.0 | 30.0 | 18.58 | − |
| ESO 443–09 | 17.38 | 17.17 | 16.52 | 0.21 | 0.65 | 20.4 | 39.4 | 17.45 | −11.60 |
| DDO 155 | 14.79 | 14.50 | 14.02 | 0.29 | 0.48 | 64.0 | 92.4 | 14.84 | −11.93 |
| PGC 45628 | 15.11 | 14.71 | 14.05 | 0.40 | 0.66 | 47.6 | 62.4 | 15.12 | −14.28 |
| PGC 170257 | 15.32 | 14.74 | 14.04 | 0.58 | 0.70 | 37.6 | 60.0 | 15.34 | −14.14 |
| UGC 8651 | 14.22 | 13.95 | 13.34 | 0.27 | 0.61 | 88.0 | 150.0 | 14.26 | −13.20 |
| UGC 8760 | 14.47 | 14.23 | 13.67 | 0.24 | 0.56 | 84.0 | 130.0 | 14.51 | −13.11 |
| UGC 8833 | 15.30 | 14.97 | 14.38 | 0.33 | 0.59 | 51.2 | 77.6 | 15.38 | −12.27 |
Slight changes of a slope in about 75 per cent of the surface brightness profiles can indicate redder colour index of the galaxies in their outer parts. This gradient occurs probably due to increase in the average age of the stellar population towards the edge of the galaxy.
4.2 Surface brightness profiles
Azimuthally averaged surface brightness profiles have been widely used (Karachentseva et al. 1996; Papaderos et al. 1996; Bremnes, Binggeli & Prugniel 1998; Gil de Paz & Madore 2005) for the investigation of dwarf galaxies. They allow one to improve the accuracy of surface photometry in galaxies of low-surface brightness and irregular structure. Azimuthally averaged surface brightness profiles for our galaxies were obtained by differentiating the galaxy growth curves with respect to radius (Bremnes et al. 1998). The resulting profiles in the B, V and I colours are displayed in Fig. 1. Most of the galaxies were measured up to the level of 28 mag arcsec−2 in the B filter. Mean uncertainties of the measurements were estimated by intercomparison of individual profiles for the same objects obtained from different frames in the same passband. They amount to about 0.08 mag at the 23 mag arcsec−2 isophotal level and about 0.3 to 0.4 mag at the 27 mag arcsec−2 isophotal level in each of the filters.
The unweighted exponential fits to the surface brightness profiles were done by linear regression. The rms deviation of the derived model profiles from the original ones does not exceed 0.10 mag. The results of the fitting are presented in Table 3. The columns are as follows. Column 1: galaxy name. Column 2: central surface brightness in B filter estimated from the original profile. Column 3 and 4: best-fitting parameters of the exponential disc in B filter [the central surface brightness μ0 (mag arcsec−2) and exponential scale length h (arcsec)]. Column 5: central surface brightness in V filter estimated from the original profile. Column 6 and 7: best-fitting parameters of the exponential disc in V filter. Column 8: central surface brightness in I filter estimated from the original profile. Column 9 and 10: best-fitting parameters of the exponential disc in I filter.
The fitting parameters of the dwarf galaxies.
| Name | μpB mag arcsec−2 | μfB mag arcsec−2 | hB arcsec | μpV mag arcsec−2 | μfV mag arcsec−2 | hV arcsec | μpI mag arcsec−2 | μfI mag arcsec−2 | hI arcsec |
| KKH 46 | 24.2 | 21.30 | 4.2 | 23.8 | 21.15 | 4.3 | 23.3 | 20.23 | 4.0 |
| D634-03 | 24.2 | 24.27 | 7.8 | 23.9 | 23.68 | 7.1 | 23.2 | 22.74 | 6.5 |
| Antlia | 24.8 | 23.73 | 19.4 | 24.3 | 23.71 | 25.8 | 23.7 | 22.82 | 23.4 |
| KKH 60 | 24.7 | 24.64 | 14.9 | 24.4 | 23.96 | 12.2 | 23.6 | 23.25 | 11.1 |
| UGC 5672 | 20.8 | 20.81 | 6.8 | 20.3 | 20.31 | 7.2 | 19.5 | 19.44 | 7.4 |
| KKs 44 | 22.6 | 22.77 | 8.0 | 22.3 | 21.86 | 7.7 | 21.7 | 21.08 | 8.1 |
| KK 144 | 23.9 | 22.69 | 10.3 | 23.7 | 22.15 | 9.6 | 23.1 | 21.89 | 10.3 |
| KK 149 | 22.3 | 21.60 | 6.7 | 21.8 | 21.35 | 7.3 | 21.1 | 20.56 | 7.3 |
| KK 151 | 22.0 | 21.76 | 6.7 | 21.7 | 21.62 | 7.7 | 21.1 | 20.93 | 7.9 |
| KK 160 | 24.3 | 23.65 | 6.6 | 23.6 | 22.96 | 6.4 | 22.6 | 22.42 | 7.9 |
| ESO 381-18 | 22.6 | 21.99 | 6.9 | 22.3 | 21.76 | 7.7 | 21.6 | 21.05 | 7.7 |
| ESO 381-20 | 23.1 | 22.79 | 21.4 | 23.0 | 22.41 | 22.5 | 22.5 | 21.88 | 21.6 |
| KKSG 37 | 24.7 | 24.74 | 10.6 | 24.2 | 24.12 | 12.0 | 23.4 | 23.04 | 10.5 |
| ESO 443-09 | 24.0 | 23.36 | 7.0 | 24.1 | 23.33 | 7.9 | 23.5 | 22.71 | 8.2 |
| DDO 155 | 22.9 | 21.99 | 10.7 | 22.6 | 21.89 | 11.4 | 22.3 | 21.36 | 11.6 |
| PGC 45628 | 21.9 | 21.26 | 7.0 | 21.6 | 21.07 | 7.6 | 21.0 | 20.41 | 7.9 |
| PGC 170257 | 20.9 | 22.79 | 9.3 | 20.6 | 22.15 | 9.4 | 20.2 | 20.69 | 7.8 |
| UGC 8651 | 23.3 | 22.63 | 17.5 | 23.1 | 22.40 | 19.3 | 22.4 | 21.85 | 20.5 |
| UGC 8760 | 22.8 | 22.64 | 17.5 | 22.4 | 22.31 | 17.6 | 21.8 | 21.68 | 17.5 |
| UGC 8833 | 23.0 | 22.15 | 9.7 | 22.8 | 22.12 | 11.5 | 22.2 | 21.43 | 11.0 |
The listed surface brightnesses were not corrected for the Galactic absorption.
4.3 Photometric uncertainties
Summing up all internal errors given above, we obtain the resulting errors of the total magnitude estimation to be about 0.24m in B, V and I band, and the resulting errors of surface brightness estimation to be about 0.24m at the 23 mag arcsec−2 isophotal level and about 0.38–0.46 at the 27 mag arcsec−2 isophotal level in each photometric band.
External photometric errors can be estimated by a comparison of the total magnitudes of the observed galaxies with the published magnitudes of these galaxies. The comparison of the total B magnitudes estimated in the present work with those given in the articles of Bremnes, Binggeli & Prugniel (1999), Hopp & Schulte-Ladbeck (1995), Makarova et al. (1998) and Makarova et al. (2002) for five galaxies in common yields the satisfactory agreement of −0.02 ± 0.15 mag. We did not consider other bands due to poor statistic (one to two published values).
5 NOTES ON INDIVIDUAL GALAXIES
KKH 46. This irregular knotty galaxy is one of the most isolated objects in the LV. The distance is estimated from its radial velocity with the Hubble constant H= 72 km s−1 Mpc−1. The apparent magnitude of KKH 46 g= 18.6 is given in NASA/IPAC Extragalactic Database from SDSS and it corresponds to a single blue knot only.
D634-03. Distance to the object was recently measured via the luminosity of TRGB (Karachentsev et al. 2006).
Antlia. This is a dwarf companion to NGC 3109. Distance measurements to Antlia via TRGB were made by Aparicio et al. (1997) and Tully et al. (2006) in fine mutual agreement.
KKH 60. This is an irregular galaxy of low-surface brightness with an unreliable estimate of radial velocity, +286 km s−1 (Makarov, Karachentsev & Burenkov 2003). Judging from its new radial velocity, +1670 km s−1, measured at Arecibo (M. Haynes, personal communication), KKH 60 resides far beyond the LV.
KKs 44 = ESO 320-014. This dIrr galaxy is situated at the remote periphery of the CenA/M83 complex. The distance to the galaxy was recently determined from the TRGB by Karachentsev et al. (2007).
KK 144, KK 149, KK 151 and KK 160. Judging from their radial velocities, these four dIrr galaxies belong to the CVnI cloud. Three of them, apart from KK 160, are detected in the Hα emission line (Kaisin & Karachentsev 2008) testifying to active star formation in these dwarf systems.
ESO 381-018 and ESO 381-020. These are two dIrr galaxies on the outskirts of the CenA/M83 complex. Their distances were recently measured via TRGB (Karachentsev et al. 2007).
KKSG 37. This is a dwarf system of very low surface brightness and rather uncertain type (dSph or dIrr). The reported H i emission with radial velocity of +85 ± 1 km s−1 (Huchtmeier, Karachentsev & Karachentseva 2003) has apparently a local Galactic origin. Judging from the measured colours B−V= 0.82, V−I= 1.01, KKSG 37 is a distant dSph system probably located in the Virgo Southern extension.
ESO 443–09 = KK 170. This dIrr galaxy situated at the outskirts of M83 group has a distance measured from TRGB (Karachentsev et al. 2007).
DDO 155 = GR 8 = VIII Zw 222. A very nearby dIrr system seen in the stage of active star formation.
PGC 45628 and PGC 170257. Two dIrr galaxies on the periphery of the CenA/M83 complex with distances estimated from their radial velocities.
UGC 8651, UGC 8760 and UGC 8833. Three dIrr galaxies with accurate TRGB distances 3.01, 3.18 and 3.19, respectively, in a group of dwarfs on the near side of the CVnI cloud (Tully et al. 2006). The R-band profiles of UGC 8651 and 8760 were measured by Swaters (1999).
6 DISCUSSION AND CONCLUSIONS
In this work, we present imaging and general photometric parameters of 20 nearby dwarf galaxies. It is seen in Tables 2 and 3 that the blue central surface brightnesses of the 20 irregular galaxies under study lies within the range of [20.8–24.8] mag arcsec−2 and their total absolute magnitudes occupy the interval of [−10.3, −14.8] mag. Total parameters of these galaxies follow the common relations for dwarf galaxies. The distribution of central surface brightness and absolute magnitudes for the objects of our sample is presented in the left-hand panel of Fig. 2. In general, the galaxies follow the relation μ0(B) ∝ 0.5 MB (dashed line) similar to the dwarf population of the Local Group (Grebel, Gallagher & Harbeck 2003). Total colour indexes B−V and V−I of the galaxies under study (Fig. 2, right-hand panel) follow the relation B−V= 0.85 (V−I) − 0.2 similar to dIrr and dSph galaxies from our previous paper (Makarova 1999) with the scatter ∼0.15m.
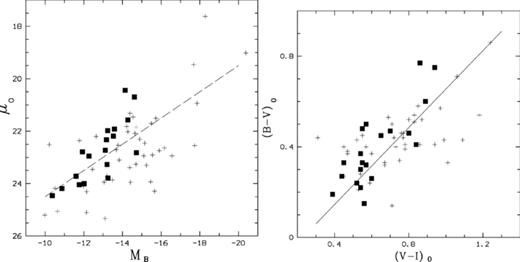
The distribution of central surface brightness in B filter versus absolute B magnitude (left) and the distribution of the total colour indexes (B−V)0 versus (V−I)0. All magnitudes and colour indexes are corrected for galactic absorption. The 20 dIrr galaxies from the present work are shown with filled squares. The galaxies measured in our other studies are shown with crosses.
The surface brightness profiles of the dwarf Irr galaxies from our sample are well fitted by an exponential law in its outer parts, whereas in the central parts they show light depression. This tendency is very common for nearby dwarf galaxies, including dIrrs and dSphs (see e.g. the big series of nearby dwarf galaxies study by Bremnes et al. 1998; Bremnes, Binggeli & Prugniel 2000; Barazza, Binggeli & Prugniel 2001; Parodi, Barazza & Binggeli 2002). In a number of studies of dwarf (mostly spheroidal) galaxies, the central light depression of surface brightness profiles was fitted by the Sersic law I(r) =I0* exp[−(r/r0)n] (Jerjen, Binggeli & Freeman 2000; Graham & Guzman 2003). With the Sersic index n < 1, surface brightnesses flatten towards a constant surface brightness core at the centre and steepen down from the exponential fall-off at large radii. One might imagine that the dwarfs would typically be tidally truncated and have a cut-off which could have a form described by Sersic n < 1. However, most of the profiles considered by us and in the studies mentioned above are consistent with an exponential decay with radius with no hint of a cut-off. The Sersic parametrization does not adequately describe this characteristic of a flat core (requiring Sersic index n < 1) but an exponential decay at large radii as far as can be followed (described by Sersic index n= 1). Perhaps dwarfs that are in close proximity to a big galaxy and have had a close encounter might be tidally truncated and consequently be reasonably described by a Sersic index n < 1. However, our dwarfs that are for the most part gas-rich and relatively isolated might have their unmodified ‘natural’ shape and that shape, evidently, is described by Sersic n= 1 in their outer parts.
The surface brightness profiles allow us to determine the characteristic isophotes of major diameters of galaxies in the CNG. The distribution of CNG diameters relatively to Holmberg diameters for 85 dwarf galaxies studied by us is presented in Fig. 3. The diameters measured in the CNG are not homogeneous. For most bright galaxies (with NGC, UGC, ESO numbers), the diameters nearly correspond to the level of μB= 25 mag arcsec−2. Diameters of the low-surface brightness objects from the KK, KKH, KKR, KKSG and KKs lists were measured at fainter isophotes. Following the data of Fig. 3, we conclude that the typical diameter of a CNG galaxy is close to the Holmberg diameter, exceeding it by about 10 per cent. The median isophote of CNG diameters corresponds to about 26.8 mag arcsec−2 in B according to our data.
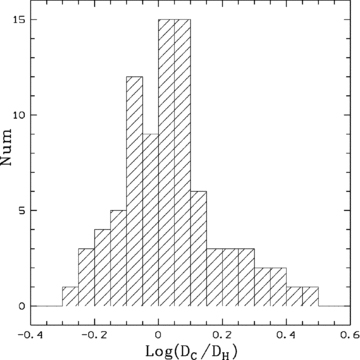
The distribution of nearby galaxy diameters from the CNG relatively to Holmberg diameters for dwarf galaxies studied by us.
This work was partially supported by RFFI grants 07-02-00005 and 08-02-00627 and grant DFG-RGBR 06-02-04017.
REFERENCES
