Dynamic modulation of local population activity by rhythm phase in human occipital cortex during a visual search task
- 1 Neurobiology and Behavior, University of Washington, Seattle, WA, USA
- 2 Physics, University of Washington, Seattle, WA, USA
- 3 Neurological Surgery, University of Washington, Seattle, WA, USA
- 4 Johnson Space Center, Houston, TX, USA
- 5 Rudolf Magnus Institute of Neuroscience, University Medical Center Utrecht, Utrecht, Netherlands
- 6 Department of Psychology and Princeton Neuroscience Institute, Princeton University, Princeton, NJ, USA
- 7 Biomedical Engineering, Washington University, St. Louis, MO, USA
- 8 Computer Science and Engineering, University of Washington, Seattle, WA, USA
- 9 Physiology and Biophysics, University of Washington, Seattle, WA, USA
- 10 Howard Hughes Medical Institute, The Salk Institute, San Diego, CA, USA
- 11 Division of Biological Sciences, University of California, San Diego, CA, USA
- 12 Neurological Surgery, Washington University, St. Louis, MO, USA
Brain rhythms are more than just passive phenomena in visual cortex. For the first time, we show that the physiology underlying brain rhythms actively suppresses and releases cortical areas on a second-to-second basis during visual processing. Furthermore, their influence is specific at the scale of individual gyri. We quantified the interaction between broadband spectral change and brain rhythms on a second-to-second basis in electrocorticographic (ECoG) measurement of brain surface potentials in five human subjects during a visual search task. Comparison of visual search epochs with a blank screen baseline revealed changes in the raw potential, the amplitude of rhythmic activity, and in the decoupled broadband spectral amplitude. We present new methods to characterize the intensity and preferred phase of coupling between broadband power and band-limited rhythms, and to estimate the magnitude of rhythm-to-broadband modulation on a trial-by-trial basis. These tools revealed numerous coupling motifs between the phase of low-frequency (δ, θ, α, β, and γ band) rhythms and the amplitude of broadband spectral change. In the θ and β ranges, the coupling of phase to broadband change is dynamic during visual processing, decreasing in some occipital areas and increasing in others, in a gyrally specific pattern. Finally, we demonstrate that the rhythms interact with one another across frequency ranges, and across cortical sites.
Introduction
Recent electrocorticographic (ECoG) and local field potential (LFP) measurements have revealed a link between neuronal population activity and changes in broadband spectral power in the brain surface electric potential (Manning et al., 2009; Miller et al., 2009b; Whittingstall and Logothetis, 2009). This broadband change has been studied primarily by examining power at higher frequencies, where underlying brain rhythms (δ, θ, α, β, and low-γ) do not obscure behaviorally-modulated broadband changes (Brindley and Craggs, 1972; Crone et al., 2001; Edwards et al., 2009; Miller et al., 2009a, 2010a; Jacobs and Kahana, 2010), and more recently by decomposition of spectral changes to remove the rhythms (Miller et al., 2009c). These brain rhythms have long been known to fluctuate with behavior (Beck, 1891), but whether they reflect an active or passive agent in cortical computation has not been directly addressed until recently. Recent measurements have demonstrated that the phase of low-frequency rhythms modulates the amplitude of high frequency power in ECoG (Mormann et al., 2005; Canolty et al., 2006; Osipova et al., 2008; Penny et al., 2008; He et al., 2010). This finding implies that the physiological mechanisms underlying a particular brain rhythm are influencing neuronal population activity recorded at the cortical surface, and further investigation may therefore yield insight into large-scale information processing motifs in the brain. These previous studies have focused on phase modulation of broadband amplitudes on the timescale of minutes. The examination of modulation at finer temporal resolution may reveal how information is dynamically processed in the brain on the timescale at which neural circuits engage and disengage with transient stimuli.
With a single exception (He et al., 2010), previous reports of these types of nested oscillations have focused on coupling between the phase of a low-frequency rhythm and a “high-gamma” range (Mormann et al., 2005; Canolty et al., 2006; Osipova et al., 2008; Penny et al., 2008; Cohen et al., 2009). Close inspection of the figures in these manuscripts indicates that this “high-gamma” may be a reflection of broadband change, and not a band-limited γ-rhythm. It is important to draw a distinction between broad band activity and higher frequency γ-rhythm (>50 Hz) amplitude changes as they may reflect distinct underlying physiologic phenomena. The γ-rhythm has been suggested to play a role in active computation in the brain by synchronization – associating distinct cortical sites coherently to facilitate computation (Singer, 1993; Fries et al., 2001; Womelsdorf et al., 2005, 2007; Siegel et al., 2008; Mitchell et al., 2009). In contrast to playing a specific computational role, the broadband power measured at an electrode reflects the average spike rate of the neurons that project to the local neuronal population of roughly 5*105 neurons in the gray matter beneath each electrode (Manning et al., 2009; Miller et al., 2009b; Miller, 2010). Any phenomena that are observed in the aggregate potential therefore reflect the general activity of this underlying population.
Universal functional properties are often attributed to band-limited rhythmic phenomena. In some cases, this might be biologically plausible – the θ rhythm, for example, may enable a central hippocampal mechanism to coordinate a distributed neocortical network during planning and memory retrieval (Mormann et al., 2005; Canolty et al., 2006; Tort et al., 2009). The α rhythm may reflect suppressive synchronization across visual cortex when there is no visual input at all (Osipova et al., 2008), and therefore not a major feature of our task (as described below), where the subjects’ eyes were open throughout both visual search and ISI epochs. Emerging experimental results suggest that the α-rhythm may not emerge as a large-scale brain feature in visual cortex until the signal is averaged over the larger spatial scales associated with EEG and MEG recordings (Edwards, 2010, Personal Communication).
In this article, we lay out a general framework for examining modulation of local population activity by low-frequency rhythms in the brain. A “phase-coupling palette” is constructed to visualize the full range of coupling across a wide range of frequencies. We isolate particular frequency ranges, and demonstrate how trial-by-trial modulation can be quantified in a robust way using the “phase-coupling vector.” These measures reveal numerous coupling motifs between low-frequency rhythms and broadband spectral change in human occipital cortex. This coupling changes dramatically on a trial-by-trial basis as individuals switch between engagement in a visual search task and fixation on a blank screen. Our findings suggest that rhythms have multiple influences, facilitating and suppressing the activity of cortical populations of neurons. Within a specific frequency range, these influences can be gyrally specific, releasing one area during visual engagement, while actively suppressing another.
Methods
Subjects
All five subjects in the study were epileptic patients at Harborview Hospital in Seattle, WA. Sub-dural grids and strips of platinum electrodes were clinically placed over frontal, parietal, temporal, and occipital cortex for extended clinical monitoring and localization of seizure foci. Each subject gave informed consent to participate in an Institutional Review Board approved experimental protocol. All patient data was anonymized according to IRB protocol, in accordance with HIPAA mandate.
Recordings
Experiments were performed at the bedside, using Synamps2 amplifiers (Neuroscan, El Paso, TX, USA) in parallel with clinical recording. Stimuli were presented with a monitor at the bedside using the general purpose BCI2000 stimulus and acquisition program (interacting with proprietary Neuroscan software), which also recorded the behavioral parameters and cortical data. Sub-dural platinum electrode arrays (Ad-Tech, Racine, WI, USA) were arranged as combinations of 8 × [4, 6, 8] rectangular fronto-tempero-parietal arrays and 1 × [4, 6, 8] linear temporal and occipital strips. The electrodes had 4 mm diameter (2.3 mm exposed), 1 cm inter-electrode distance, and were embedded in silastic. The potentials were sampled at 1000 Hz, with respect to a scalp reference and ground (Figure 1A). These signals had an instrument-imposed band-pass filter from 0.15 to 200 Hz.
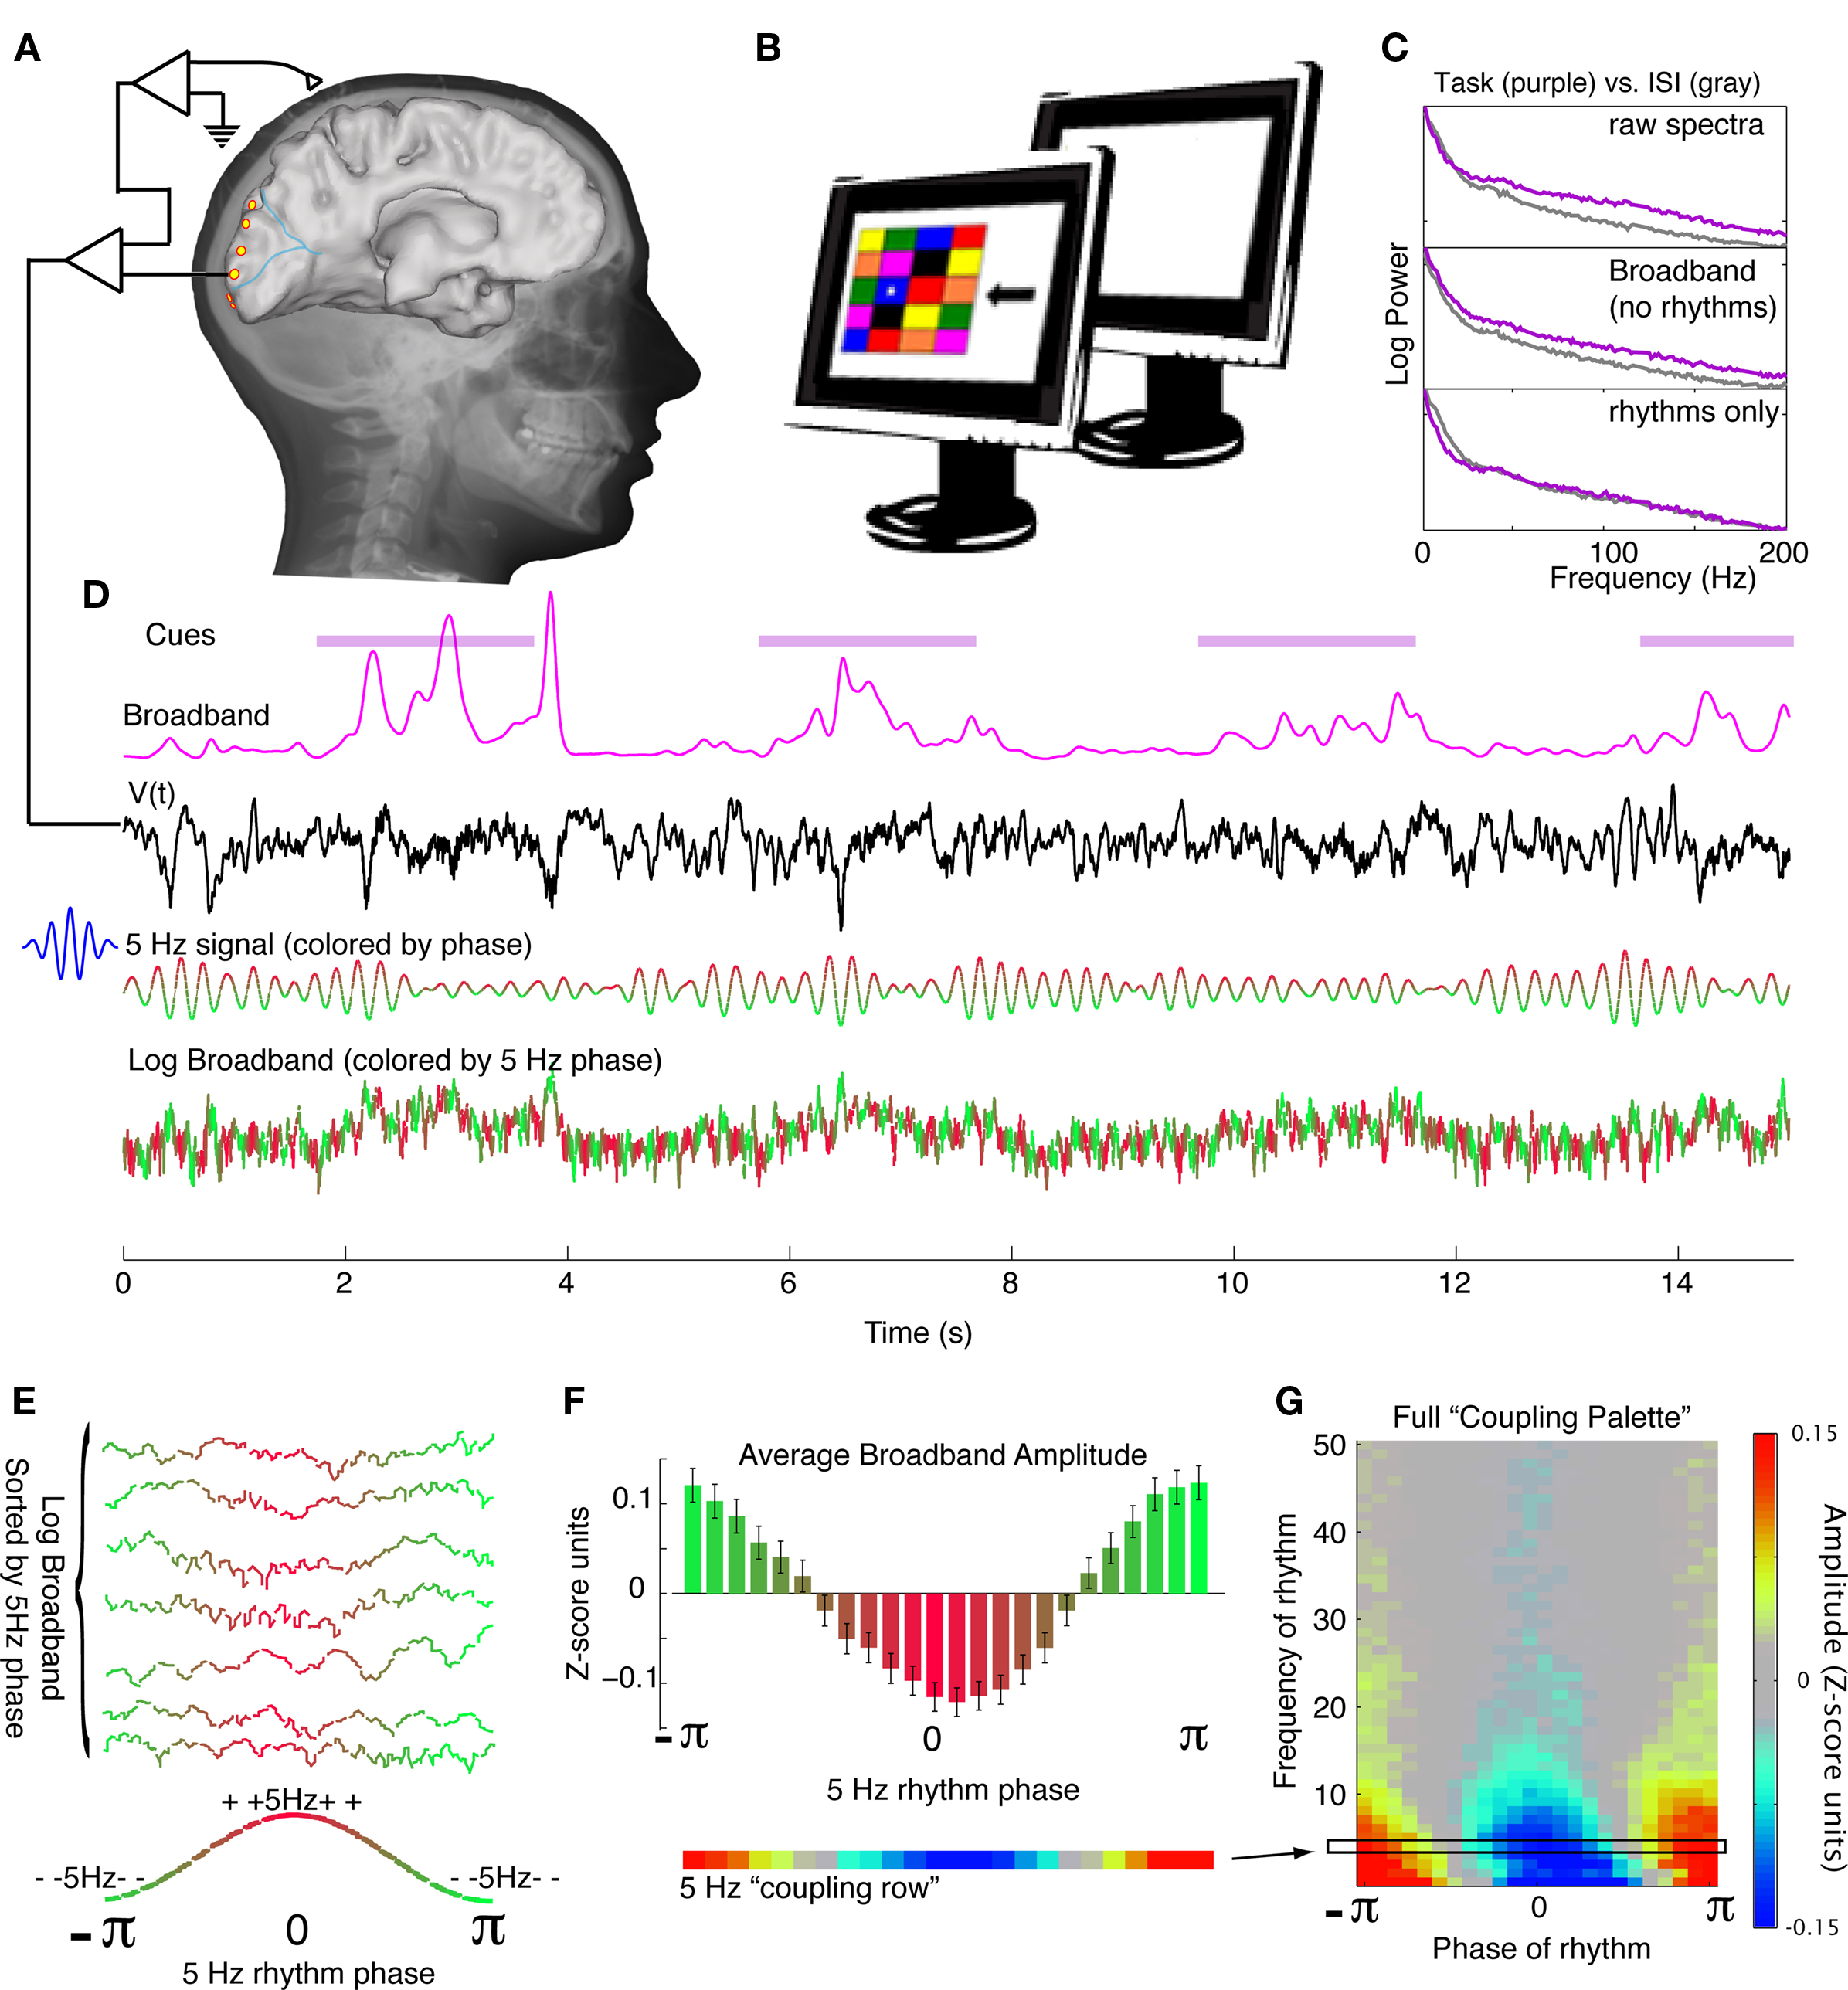
Figure 1. Experimental approach. (A) The electrocorticographic (ECoG) potential is measured from occipital lobe brain surface sites during participation in a visual search task (subject 4 shown here). (B) The visual search task consists of a 4-by-5 array of colored squares. Each cue consists of a star in one of the boxes (in this case a blue box), and an arrow. The subject states the color of the box in the direction of the arrow from the star (“green” would be the appropriate response in this case). Visual search cues are shown for 2 s, with blank inter-stimulus-interval (ISI) cues shown for intervening 2 s. (C) Power spectral changes during different portions of the experiment (top panel) may be appreciated and naively decoupled into broadband changes (middle panel, 2nd to 4th PSCs omitted) and changes in brain rhythms (bottom panel, 2nd to 4th PSCs only). (D) From the timeseries of the potential, dynamic, spectrally-broadband, fluctuations may be extracted (here shown smoothed). In this illustration, the 5 Hz portion of the signal is extracted using a 5 Hz Morlet wavelet (here colored for phase – red denotes surface-positive, and green denotes surface-negative). The timeseries of the log of the broadband is shown, colored by coincident phase of the 5 Hz signal. (E) The timeseries of the log of the broadband is sorted by the coincident phase of the 5 Hz signal. (F) The average of the log-broadband amplitude (Z-score units, denoted χk in the Methods) for each 5 Hz phase is shown, with errorbars denoting three times the standard error of the mean (3*SEM) for each phase. This can be appreciated in one dimension as the “5 Hz coupling row.” (G) The process detailed in (D)–(F) is repeated at each frequency from 1 to 50 Hz, to obtain a full coupling palette, and to illustrate how the full range of low-frequency rhythms modulates local brain activity (as captured by broadband spectral change).
Visual Search Task
Subjects participated in a visual search task presented on a LCD monitor ∼1 m away, in which 2 s visual search stimuli were interleaved with 2 s inter-stimulus-intervals (ISIs) during which the screen was blank. Each visual search stimulus (e.g., Figure 1B) consisted of three parts: (1) a 5-row by 4-column array of colored boxes (∼1 cm by 1 cm), (2) a white star positioned in the center of one of these boxes, and (3) a black arrow (∼2 cm by 1 cm) centered ∼1.5 cm to the right of the right-most box in the middle row. In each visual search stimulus, the star appeared randomly in one of the colored boxes, and the arrow pointed randomly in one of four cardinal directions (“right,” “left,” “up,” or “down”). The subjects’ task was to state the color of the box that was adjacent to the star in the direction of the arrow. Since fixation was not constrained, and eye position was not measured, we cannot know whether differential effects between different arrow directions were due to attention or a late visual microsaccade between the star and the arrow, or different box position. It seems unlikely that we are measuring “motor processing” in visual cortex during visual search, but we cannot exclude this possibility. Because the uncertainty about attention versus gaze-shift-driven neural activity limits our ability to examine the functional subcomponent of visual processing, the present study is agnostic to these distinctions, and is focused on the generic relationship between brain rhythms and cortical visual processing.
Electrode Localization
Cortical surface mesh reconstructions were made using pre-operative structural MRI. Electrode positions were calculated with respect to the structural MRI from post-operative computed tomography (CT) using the CTMR package of Hermes et al. (2010). When the MRI or CT was of insufficient quality, hybrid techniques involving x-ray were employed to obtain cortical rendering and/or electrode position (Miller et al., 2010b).
Signal Processing
Complex signals  at discrete frequencies, f, were extracted from the raw potential using Morlet wavelets, and complex signals representing a range of frequencies
  were generated using a band-pass and then the Hilbert transform. The log of the decoupled broadband amplitude, χ(t), was also extracted from the raw potential, using the approach outlined in Miller et al. (2009c). The methods for pre-processing, and other pre-established signal processing, are detailed in the Methodological Appendix. Synthetic data were generated to validate the signal processing approach, and the methods to do this are also detailed in the Appendix.
Broadband Coupling to Low-Frequency Phase (Illustrated in Figure 1D–F)
The coupling was estimated by calculating the average log-broadband amplitude χ(t) as a function of the rhythm phase φ in small phase intervals,
where k′ = k − K/2 (K total intervals). For example, for K = 24 (the number used in these analyses), then χ13 represents the mean log-broadband when the phase of the low-frequency rhythm is in the interval between 0 and π/12. The center of each interval is denoted φk, so φ13 = π/24. To get a full picture of the strength and preferred phase of coupling across a range of frequencies, the wavelet-obtained rhythms at each frequency are used to build up a “palette” of χk at each frequency. This has an advantage in that ranges of coupling and distinct coupling to different rhythms are revealed, in many cases, as separate phenomena, because there are different preferred phases of coupling.
The Coupling Vector and Trial-by-Trial Statistics (Illustrated in Figure 2)
To condense the range of frequencies composing a given rhythm into one measure, the Hilbert transform was applied, with frequency range chosen based upon inspection of the palette. This allows for the calculation of a “coupling vector” by taking the dot-product  Zmod is the magnitude of coupling between phase of the rhythm and the log-broadband amplitude (because we z-score χ(t), Zmod is roughly the amount of variation in the z-score that correlates with the phase of the rhythm concerned), and φc is the preferred phase of this interaction. This can be calculated on a trial-by-trial basis, breaking up the data into smaller epochs (2 s trials in our case) and calculating a coupling vector for each trial. To assess the distribution of coupling for N trials of a given type, one cannot simply compare the contribution of trial n to the distribution of coupling values as Zmod(n) because if φc is not reproducible from trial-to-trial, then
  can be a large value even on trials in which the coupling preferred phase is opposite to that of the majority of other trials in the distribution. In other words, the fact that
  must be non-negative would strongly bias the distribution of
  values so that the mean of the distribution can be significantly greater than zero even when there would be no underlying coupling of consistent phase. For this reason, the distribution of values
  is used, where
  is the preferred phase of the mean coupling vector for trials of type q:
  The quantity
  can be negative or positive and can therefore have a distribution significantly overlapping with zero (indicating an absence of reliable phase modulation). For each type of trial, the distribution of coupling can be assessed using the distribution
  We demonstrate the significance of these measures using error bars which represent three times the standard error of the mean. Note that if all trials are of type q, then the average coupling vector across trials is the same as the coupling vector of the full timeseries. This method has an advantage over the “large-time shift” bootstrapping approach (Penny et al., 2008) because the data may be segregated into smaller time trials, and statistics may be computed by comparing the distribution of values for trials of one behavioral state versus trials of a different behavioral state. It may also be used to compare discontinuous trials of one type (or all trials concatenated) versus 0. This allows us to examine significant shifts in phase–amplitude coupling during different trial types (where q = “ISI,” versus q = “right,” etc.) and also to assess the significance of each independently versus zero. One might in principle look for shifts in the distribution of preferred phase, but this is only meaningful in the case that significant coupling versus zero has been established independently for each of the two distributions. We defer examination of task-related shift in preferred phase to future studies.
Cross-Rhythm Interaction
We also calculated the interaction between the 4–8 Hilbert phase φ(4–8 Hz, t), and the 12–20 Hz analytic amplitude r(12–20 Hz, t). This was done in the exact same fashion as for the φ to χ comparison, replacing χ with r(12–20 Hz, t). There are many such inter-rhythm interactions (e.g., Lakatos et al., 2005; Osipova et al., 2008; Cohen et al., 2009; Tort et al., 2009), but we defer further explorations of these to future studies.
Results
Task-Specific Changes in the Raw Potential, the Amplitude of Rhythms, and in Decoupled Log-Broadband Spectral Change Between Visual Search and Inter-Stimulus Interval Epochs
Averaged power spectra
The averaged power spectral density (PSD) during visual engagement and ISI exhibits a general 1/f shape, with superimposed rhythms that deviate from this 1/f structure at particular frequencies. During behavior, these averaged PSDs most commonly reveal decreases in power in the classic θ (∼4–8 Hz), α (∼8–12 Hz),and β (∼12–20 Hz) rhythms during visual engagement, and increases in power in the γ rhythm (30–50 Hz), and in broadband change (Figures 1C and 4H,I).
Dynamic power spectra
The dynamic spectra shown in Figures 4 and 5 reveal that there are both broadband spectral changes, and corresponding increases and decreases in the θ/α/β/γ ranges associated with the onset of visual search stimuli.
Decoupling the cortical power spectrum
A principal component decomposition of the PSD clustered rhythmic, spectrally peaked, phenomena in the 2nd to 4th principal components (Figure 1C). Reconstruction of the PSD without these components revealed broadband spectral change, across the entire frequency domain, with an approximately 1/f structure. This broadband phenomenon is distinct from a higher γ-rhythm occurring as a peaked activity at 50 Hz and above (see Figures 4H,I).
Extraction of time-varying broadband change
A time-varying estimate of broadband spectral change was obtained by projecting the dynamic spectrum into the first principal spectral component (Figure 1D). The broadband change approximates the time-varying amplitude function A(t) in the power-law relationship: P(t) ∼ A(t)(1/fx). In early visual areas of the occipital cortex (peri-calcarine and occipital pole), this phenomenon is augmented throughout the entire visual search task, and most strongly so at cue onset (Figures 4 and 5). In other areas, such as portions of the lingual gyrus, this phenomenon is suppressed (Figure 5H). This broadband measure is a robust correlate of local cortical activity (Manning et al., 2009; Miller et al., 2009b,c; Miller, 2010) and its modulation by the phase of low-frequency rhythms is the focus of this paper.
Event-related potentials
The event-related potentials reveal characteristic voltage deflections at the onset and offset of visual stimuli. These were transient and non-specific, and present whether the corresponding broadband signal increased or decreased (Figures 4 and 5).
Trial-by-trial amplitude measures
The average and 3*SEM amplitudes of epoch-averaged broadband change reveal both increases and decreases (Figures 4 and 5) during visual search periods when compared with ISI epochs. Early visual areas show characteristic increases in power, while other areas show decrease. As shown in Figure 4, these trends cluster by gyral location. Amplitudes of the 12–20 Hz amplitude (Figures 4 and 5) also reveal both task-related increases and decreases in amplitude during visual search engagement, but these are not linked to broadband change in any simple way. There is task-related increase in the 4–8 Hz amplitude (Figure 5) – although this phenomenon was not universal across subjects nor brain area.
There are Numerous Coupling Motifs between Low-Frequency Rhythms and Broadband Spectral Change
Figure 1 demonstrates that robust modulation of broadband power can be identified across a range of different rhythms by visualizing palettes of rhythm-to-broadband coupling. These palettes display the range of frequencies that are coupled, and the predominant phase of this coupling. Figure 3 shows a strong and significant modulation of broadband spectral change with the phase of low-frequency rhythms in the δ/θ/α/β/γ ranges, and the relative magnitude of each change at different sites in occipital cortex. These modulatory rhythms often superimpose at the same cortical sites, and can often be appreciated as separate phenomena by the different preferred phase of coupling.
• δ (∼1–3 Hz) most often has a preferred coupling phase of −π/4 to −π/2, although there are clear exceptions in subjects 4 and 5 (left-most lower palette in Figures 3 and 4D) where the preferred phase is π.
• θ (∼4–8 Hz) has a preferred coupling phase of π which appears robustly across subjects and electrodes. (Although Figure 4G is a notable exception in this and other rhythm cases).
• α (∼8–12 Hz) most often has a preferred coupling phase of π/2 to 3π/4, although this is not universal.
• β (∼12–20 Hz, “low-β” although particular range appears variable between sites) most often has a preferred coupling phase of 3π/4. There are notable exceptions to this (Figure 3 – row 4, column 2; Figure 4G).
• “Canonical γ” (30–50 Hz) coupling is observed in Figures 2–4 with various preferred phases.
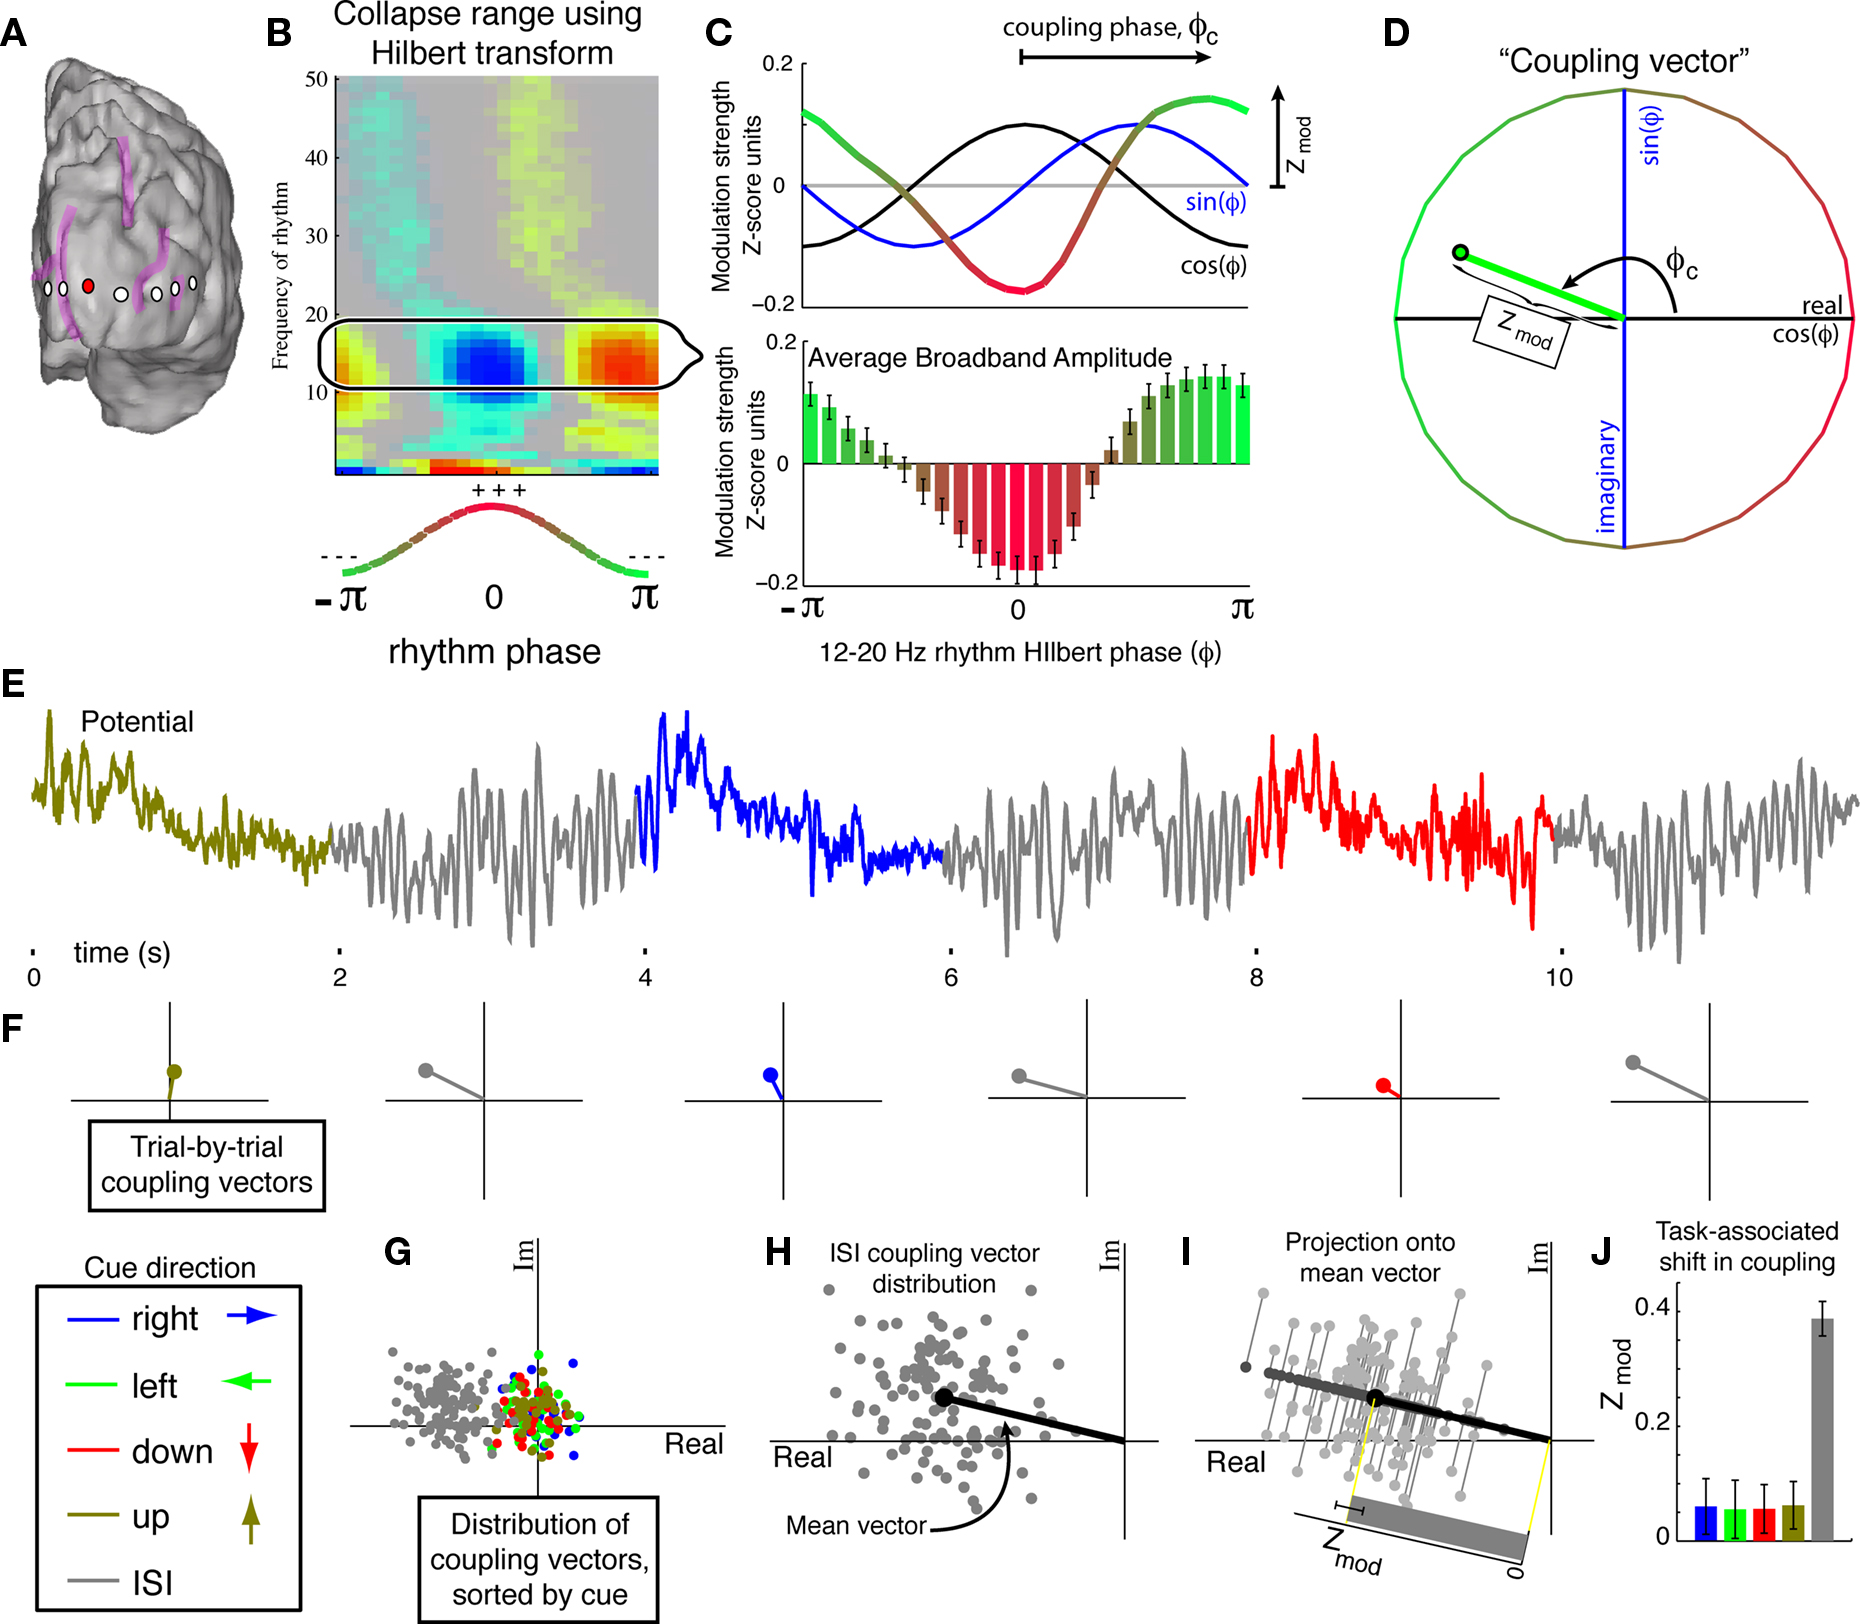
Figure 2. The “coupling vector” and trial-by-trial characterization of modulation. (A) A selected electrode (red) on the subject 5 cortical surface. (B) The coupling palette for this electrode. Phase–amplitude coupling across a range of low-β band frequencies (12–20 Hz), rather than at a single frequency, may be captured using the Hilbert transform rather than Morlet wavelets. (C) Coupling of broadband power to the Hilbert phase of the band-passed 12–20 Hz signal. The lower panel shows the mean amplitude (±3*SEM) of broadband for each Hilbert phase (φ) of the 12–20 Hz signal. The dot-product of this mean with an exponential of the form eiφ reveals the coupling phase and magnitude of the modulation (Zmod – the portion of the Z-score of broadband power modulation with the phase of the 12–20 Hz rhythm). This calculation can be appreciated visually by taking the dot-product of mean broadband power with sin(φ) and cos(φ) independently, since eiφ = cos(φ) + isin(φ). (D) The “coupling vector” reveals the magnitude, Zmod, and phase, φc, of the modulation of broadband activity by the 12–20 Hz rhythm in the complex plane. (E) The potential trace can be broken up into cue periods of visual search in different directions (colors) plus ISI periods (gray). (F) From each cue period, a single trial coupling vector can be obtained. (G) Plotting the distribution of coupling vectors across all cues reveals stronger coupling during ISI periods than during active visual search. (H) For a given epoch type (in this case, ISI) a mean coupling vector (e.g.,  ) may be obtained. (I) The distribution of coupling values for each epoch can then be obtained by projecting their coupling vectors onto the epoch mean vector direction; for the nth trial, the magnitude of coupling contributing to the distribution of coupling values is
  Using the distribution of Zmod(n) alone biases the distribution to higher mean coupling values that would not be appropriate if there is no reproducible phase coupling. (J) Coupling strength for each cue type, projected onto its own mean coupling vector. The error bars indicate 3*SEM. The error bars for visual search are typically larger than for ISI since there are four times more ISI cues than visual search cues in any particular direction. In this case, the coupling is strong and significant during ISI periods, and greatly reduced during all directions of visual search.
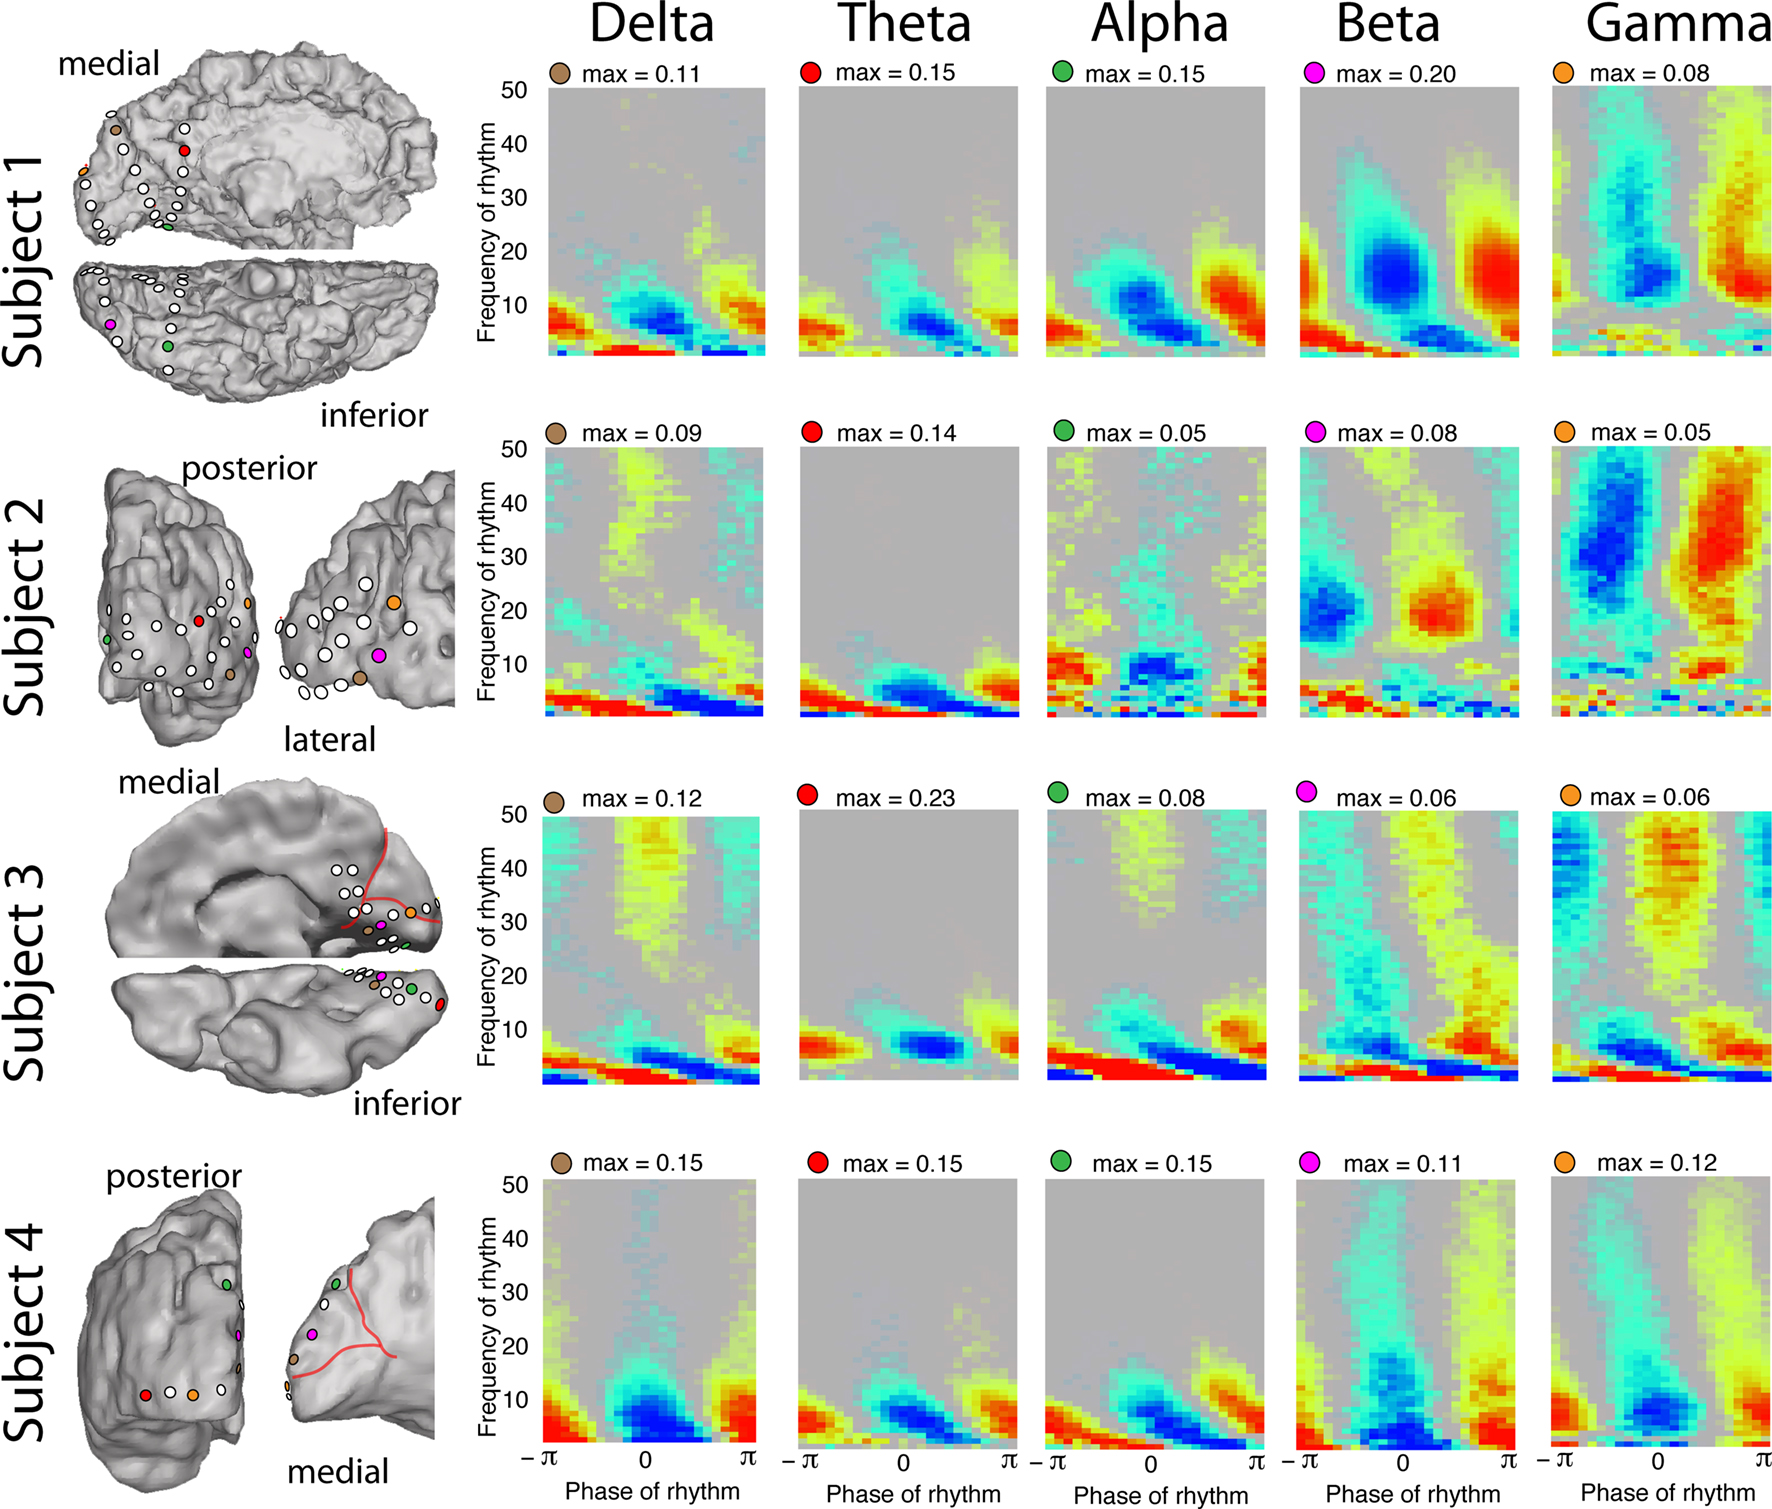
Figure 3. Coupling to different rhythms in different subjects. Each row represents the palettes from five different electrode sites in subjects 1–4, respectively (site location color coded on the rendered brain surface). The palettes illustrate that local cortical activity (as revealed by broadband spectral change) is modulated by the δ/θ/α/β/γ rhythms in each case. Note that at many electrodes we observe coincident modulation of broadband power by multiple rhythms with distinct phases of preferred coupling. In subject 4, each of the palettes shown in the δ/θ/α coupling columns exhibit phase–amplitude coupling in all of those bands (δ/θ/α), and could each have been used to exemplify phase–amplitude coupling in any of the bands. All palettes for subject 5 are shown in Figure 4, where coupling to δ/θ/α/β/γ rhythms can also be observed.
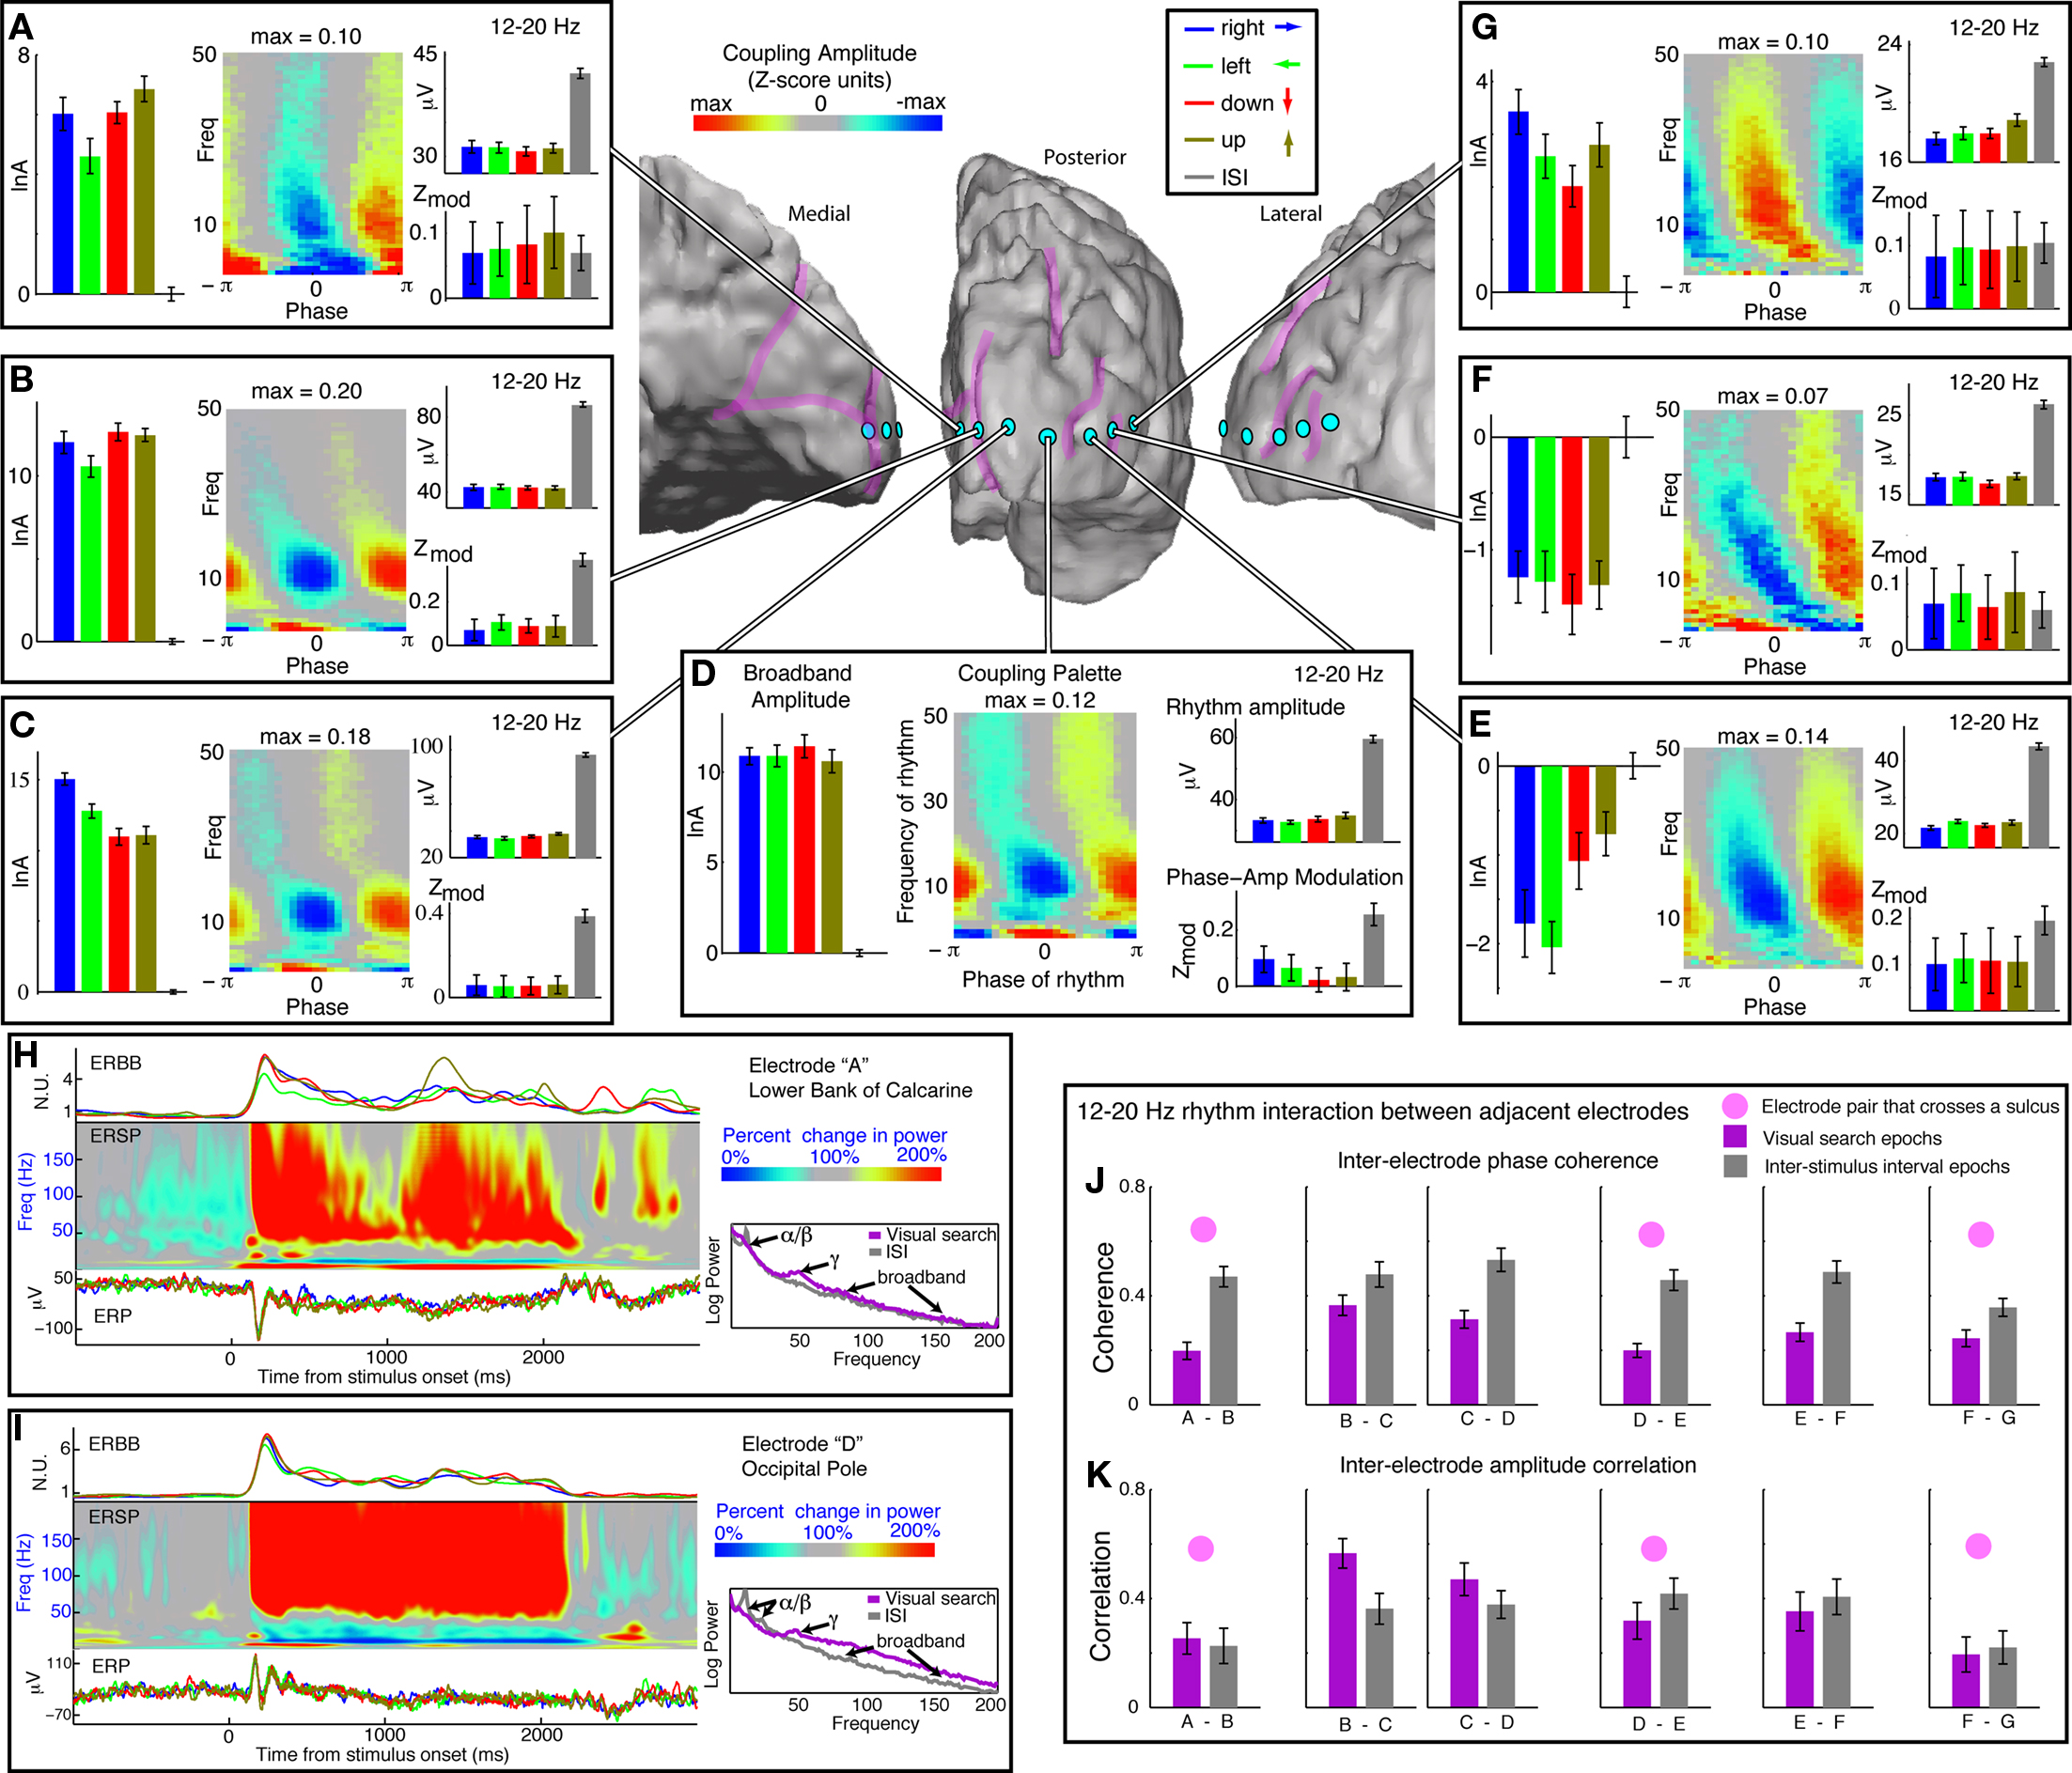
Figure 4. Coupling across occipital cortex, in subject 5, with a focus on the β-range (12–20 Hz). (A-G) Each of seven surface electrodes is shown on an electrode strip beginning in medial, peri-calcarine, occipital cortex, extending laterally around the occipital pole into the lateral occipital gyrus. The left-most series of bars in each panel is the log-broadband amplitude, in Z-score units, with the mean of ISI periods subtracted out. Errorbars represent 3*SEM. The right-most error bars, flanking the horizontal origin, represent the variation during ISI periods. The medial 4 and the most lateral electrodes [e.g., (A–D), (G)] all show increased local cortical activity during visual search, while the 5th and 6th electrode sites show suppressed activity during visual search (these two share gyral location). The palettes show average coupling across all cues. All sites have strong and significant coupling to the 12–20 Hz (β) range. The upper-right axes within each panel show the amplitude of the 12–20 Hz rhythm during different cue types. There is a lower amplitude during visual search engagement in every case. The 12–20 Hz modulation of broadband amplitude, however, is selectively suppressed during task engagement in the (B)–(D) sites, which share common gyral location. (H) Dynamics of visual response from the electrode highlighted in (A). On the Left: The upper trace is the average event-related broadband (ERBB) for each of the cue types. The middle plot is the average dynamic spectrum for all active sites combined called the “event-related spectral perturbation” (ERSP). The lower plot is the event-related potential (ERP) for each cue type. On the right, the changes in the mean spectrum during visual search (red) and ISI (blue) are shown. Note the so-called “event-related desynchronization” in the α/β rhythm range, and “event-related synchronization” in the γ–range (Pfurtscheller, 1999). Broadband change, though small, is present throughout – although it is covariant with the γ-rhythm change, it is a distinct entity. (I) Same analysis as in (H), for the electrode highlighted in (D). Broadband change is strong and robust, with α/β-ERD and γ-ERS. In this case, the broadband change is large compared with the γ-rhythm ERS, although both can still be seen. The change at this site was representative of all three occipital pole electrodes – sites (B)–(D). (J) Inter-electrode phase coherence in the 12–20 Hz range. (K) Inter-electrode amplitude correlation in the 12–20 Hz range.
It is possible that, in some cases, the smooth, continuous, “diagonal bands” visible in the lower frequencies of the phase-coupling palettes (δ, θ, α bands) may not reflect a set of distinct couplings between band-limited low-frequency rhythms and broadband power. Instead, they may reflect a process in which broadband power is elevated at a fixed time lag relative to the peak of the voltage trace, and this fixed time lag then appears as a continuously varying phase lag across different low-frequency bands.
The Amplitudes and Phases of Rhythms in Adjacent Cortical Sites are Correlated with One Another
As shown in Figure 4J, the phase coherence in the 12–20 Hz range is strong and significant in adjacent sites throughout the 7-electrode strip for subject 5 (note that this is not simply a result of re-referencing, because 63 electrode sites contributed to the common average, not just the 7 shown). This coherence is significant throughout, but is less during visual search task – which might partially be a product of the lower rhythm amplitude in a noise-like background. The coherence is sustained better across neighboring electrodes on the same gyrus. The correlation in the time course of the amplitude of the rhythms in adjacent electrodes is also significant (Figure 4K), and is significantly increased during visual search engagement in only three co-gyral electrodes (Figures 4B–D).
The Broadband Amplitude is Significantly Modulated by the Phase of Low-Frequency Rhythms
When the potential time series is separated into behaviorally relevant epochs (as described in Figure 3), there is significant modulation during both visual search cues and inter-stimulus intervals. This is shown explicitly for a 4–8 Hz band and a 12–20 Hz band (Figures 4 and 5).
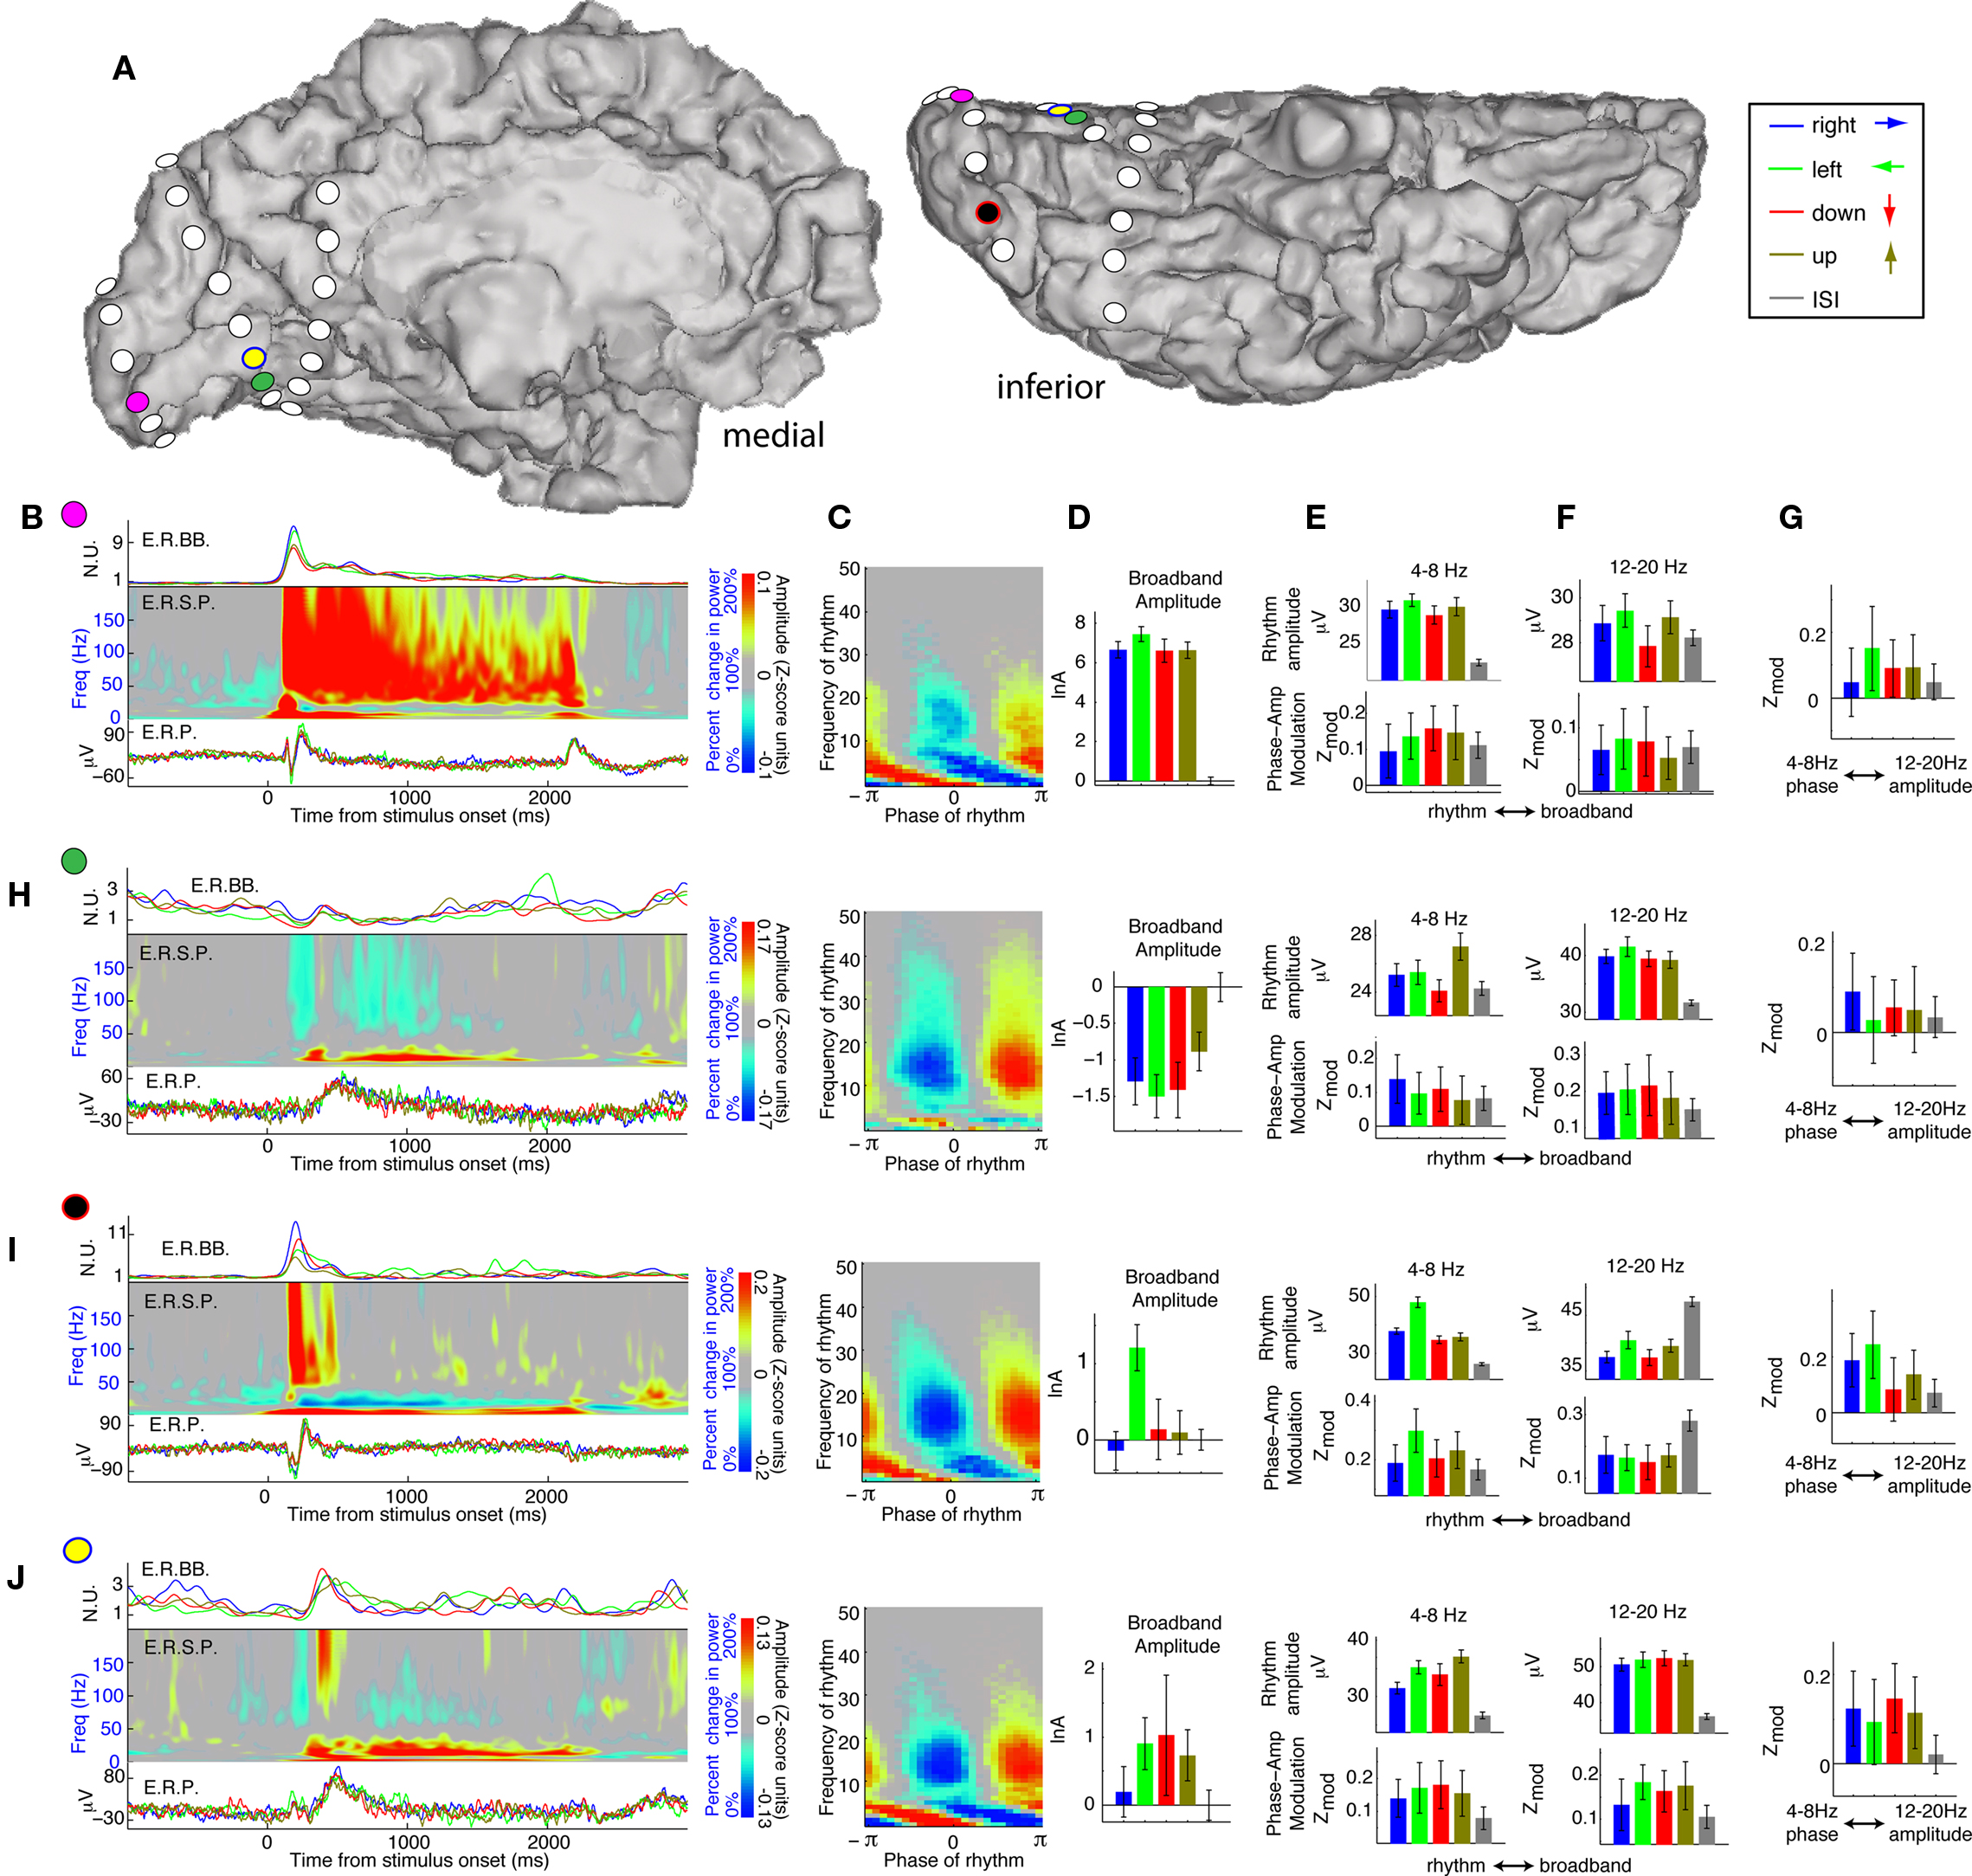
Figure 5. The variety of dynamics of occipital visual response, and the different changes of rhythms: Phase modulation of cortical activity can both increase and decrease with task engagement. (A) Dynamics are examined from four electrodes (color coded) in subject 1. (B) Pink electrode site dynamics – posterior lower bank of the calcarine sulcus. The three panels on the left show the average dynamics leading into the 2-s visual search cues (onset at time zero). The upper trace is the average event-related broadband (ERBB) for each of the cue types. The middle plot is the average dynamic spectrum for all active sites combined – the “event related spectral perturbation” (ERSP). The lower plot is the event-related potential (ERP) for each cue type. (C) The coupling palette for the pink electrode site. Note the strong θ and β contributions. (D) Broadband activity during each of the different cue types. The log-broadband amplitude is shown, in Z-score units, with the mean of ISI periods subtracted out. Errorbars represent 3*SEM. The right-most error bars, flanking the horizontal origin, represent the variation during ISI periods. (E) Upper panel: 4–8 Hz amplitude during each of the different cue types. Lower panel: The modulation of the broadband by the 4–8 Hz phase during each cue type. (F) As in (E), for 12–20 Hz. (G) Interaction between rhythms, computed analogously to the rhythm-broadband interaction. The 4–8 Hz phase modulation of the 12–20 Hz amplitude is quantified, revealing a significant coupling during all but the “rightward” cue condition. (H) As in (B)–(G), for the green electrode site – lingual gyrus. There is a suppression of broadband activity when engaged in visual search, revealed by the broadband timeseries and mean broadband amplitude (but not by the ERP). Broadband amplitude changes couple to both the 4–8 Hz rhythm and the 12–20 Hz rhythm. There is a specific augmentation of the 12–20 rhythm amplitude and 12–20 Hz coupling to the broadband rhythm during engagement in the visual task. The interaction between the two rhythms is significant during the “rightward” cue. (I) As in (B)–(G) for the black electrode site – posterior lateral occipitotemporal gyrus. There is specific broadband power increase at time of cue onset – the bars show that this is only sustained for the “leftward” cue. There is task-related increase in the 4–8 Hz rhythm amplitude and corresponding coupling. The 12–20 Hz rhythm shows a task-related decrease in both amplitude and coupling during visual search. The right-most plot demonstrates that there is significant modulation of the 12–20 Hz amplitude by the 4–8 Hz phase. (J) As in (B)–(G) for the yellow electrode site – anterior lower bank of the calcarine sulcus. Visual search cues show increase in broadband, 4–8 Hz, and 12–20 Hz amplitude. There is also a task-related increase in modulation of the broadband amplitude by 4–8 Hz and 12–20 Hz phase. In turn, the 12–20 Hz amplitude is modulated by the 4–8 Hz phase, specifically while engaged in the visual search cues, and not during the ISI cues.
The Modulation of Broadband Power by Rhythm Phase Shows Task-Dependent increases and Decreases
The 12–20 Hz range simultaneously shows both increases and decreases in modulation with engagement in the visual search task, and these patterns cluster gyrally (Figures 4 and 5). The visual search induced modulation decreases are most often associated with “active” brain areas, where broadband power increases during visual search.
The Phase of One Rhythm can also Modulate the Amplitude of Another, in a Task-Dependent Manner
In each subject, modulation of the 12–20 Hz amplitude by the 4–8 Hz phase was observed, and changed during visual search in some cases (Figures 5 and 6). Such inter-rhythm modulation appeared in at least one site in every subject, but was not present in most sites.
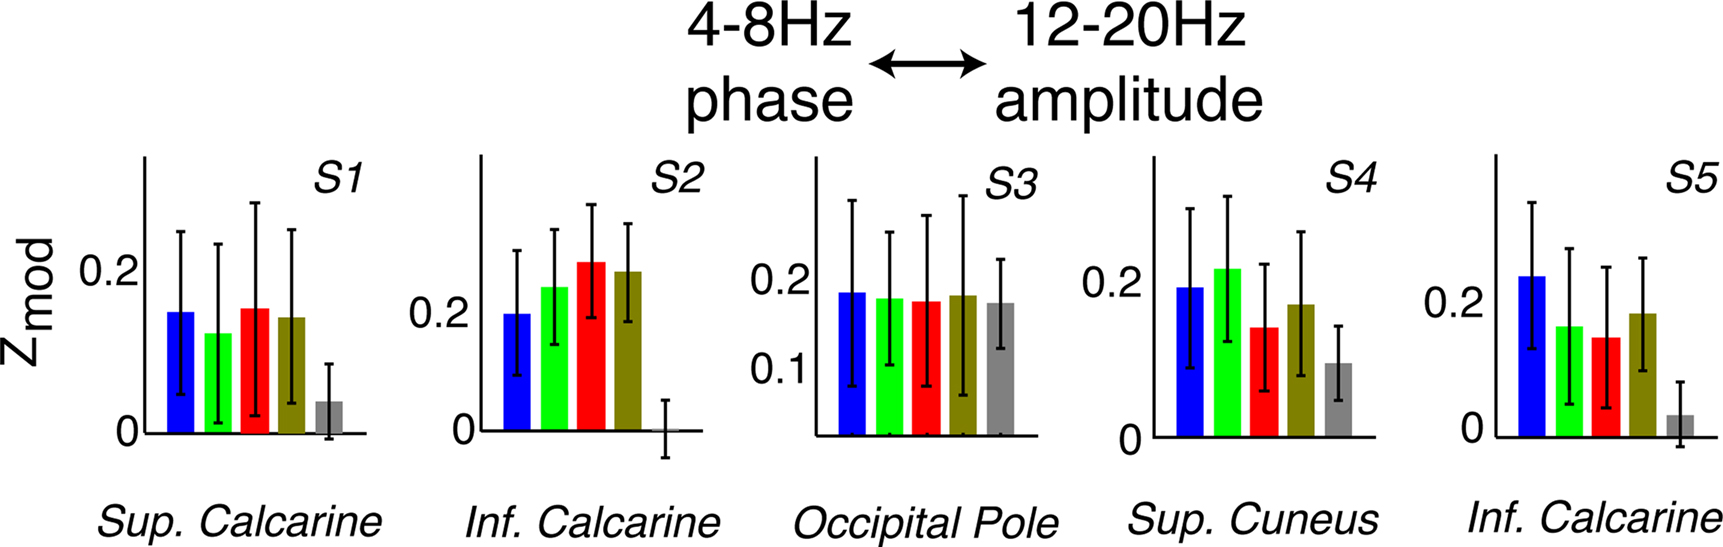
Figure 6. The rhythms interact with one another. Examples of 4–8 Hz phase modulation of 12–20 Hz amplitude in all five subjects (denoted S#). Note that there are examples of this kind of coupling in each subject, but most electrodes did not show significant phase–amplitude relationships between rhythms.
Simulated Data Supports Signal Processing Approach
A heuristic model was used to create synthetic data with broadband 1/f properties and modulation by a rhythmic input (Figures 7 and 8). This synthetic data was naively separated by the data analysis methods used on cortical data. The resulting spectra, palette, and modulation measures clearly resemble those found from recorded brain signals. When a negative control was analyzed (Figure 9), there is a complete lack of coupling structure.
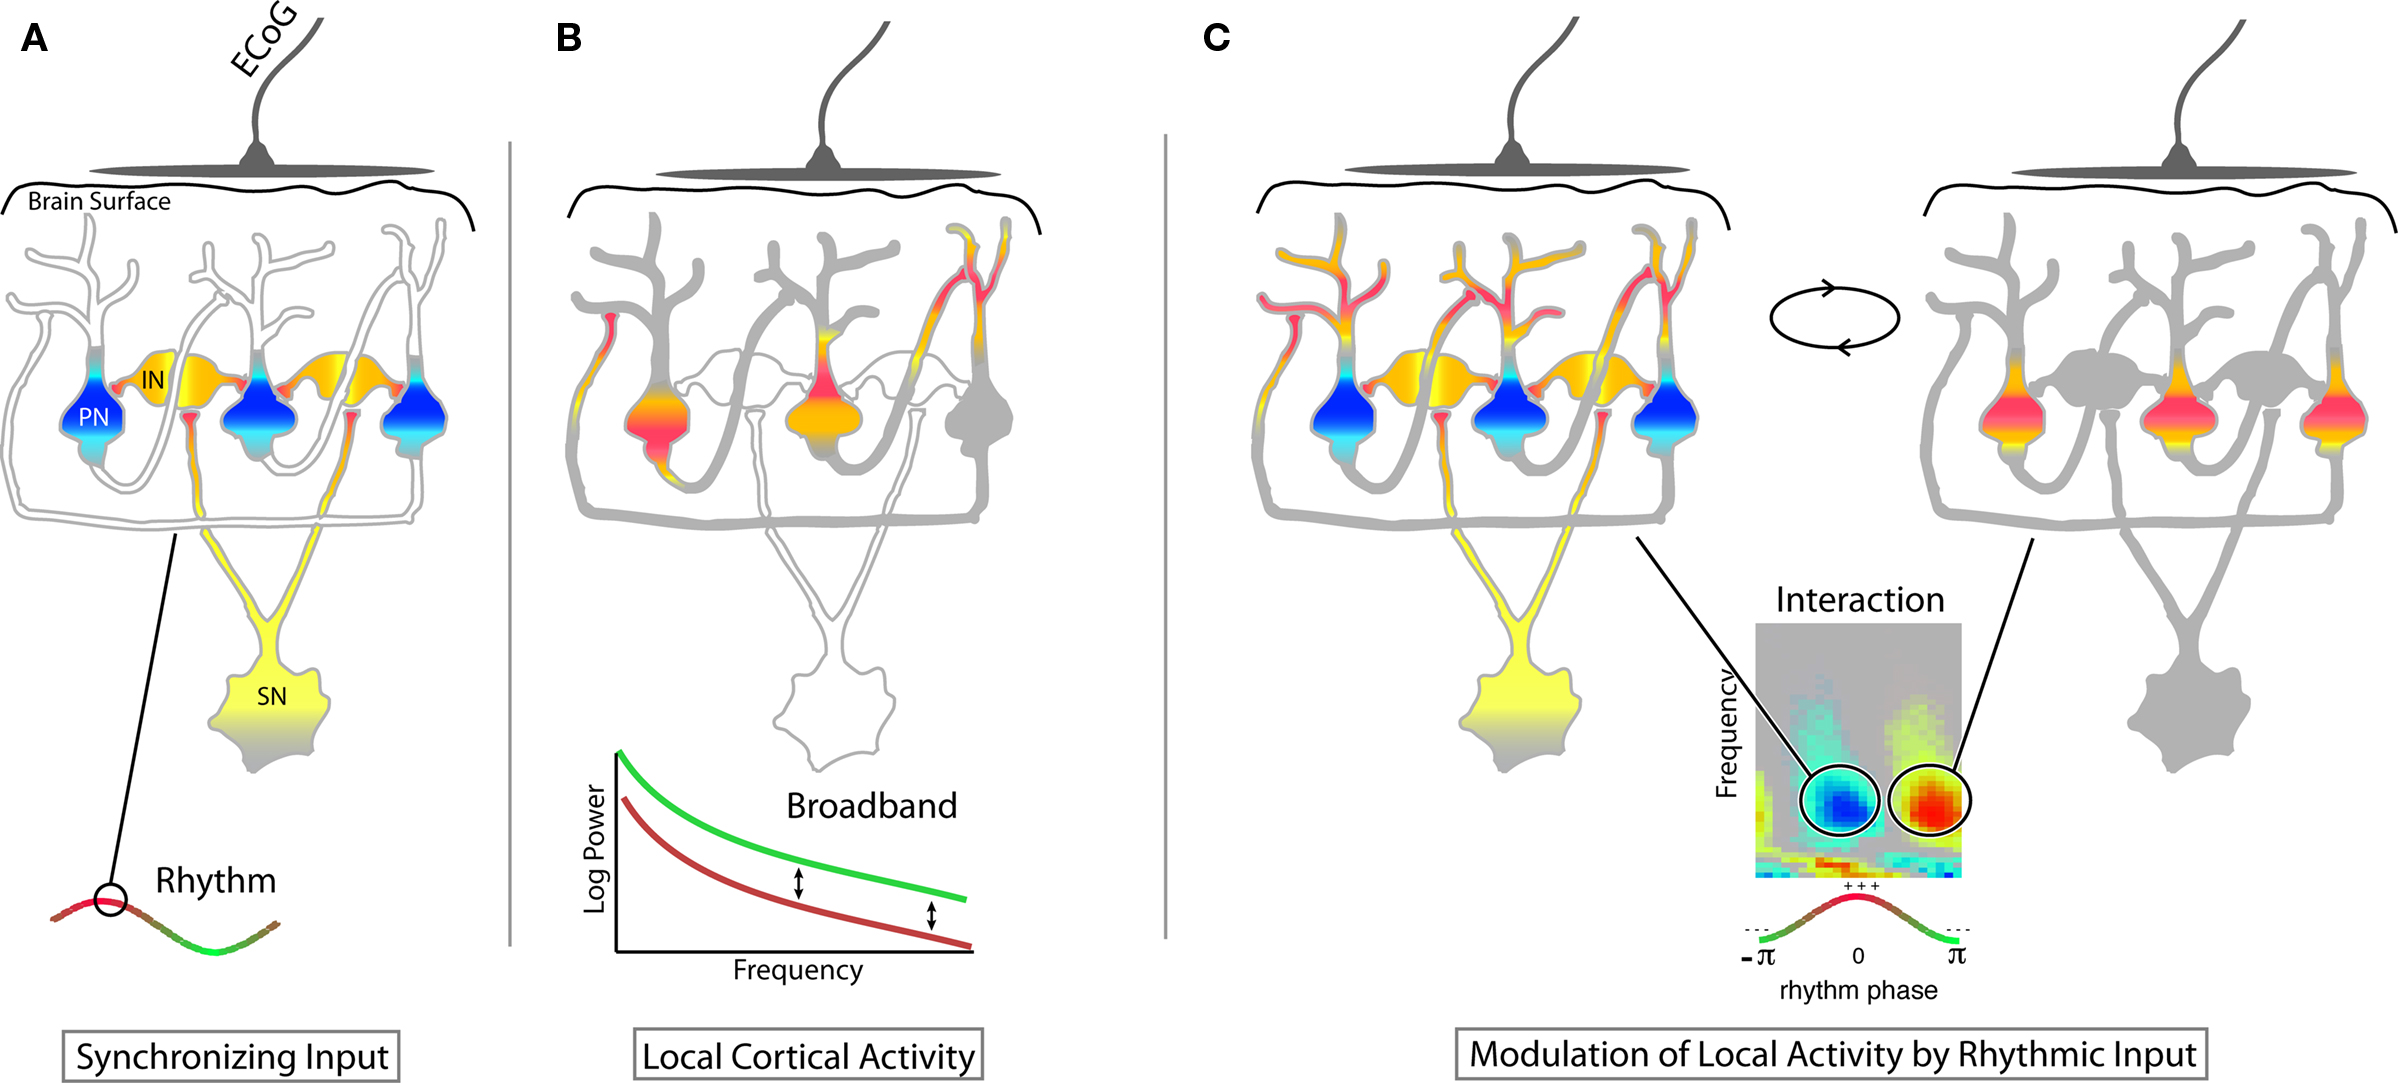
Figure 7. Heuristic for inhibition through synchronization. While there are many potential roles subserved by different rhythms, one potential role that we highlight is inhibition of population-scale processing by synchronization. This inhibitory function for rhythms is supported in cases where there is a clear, robust decrease in phase modulation of broadband by the rhythms’ phase during visual task engagement (e.g., Figures 4B–E and 5H). (A) Input from a “synchronizing neuron” (SN) projects diffusely to an inhibitory population of layer 4/5 neurons (IN) which in concert inhibit pyramidal neurons (PN) at their basal dendrites and soma. When averaged across the cortex immediately beneath an ECoG electrode, this is revealed by the presence of a rhythm. (yellow/orange/red – depolarization; light/dark blue – hyperpolarization). When present, the rhythm keeps the cortex in an idling, dynamically “ready,” state – shut down, but rapidly able to shift to active computation. Blanket inhibition, could also prevent computation, but would not allow for easy transition to diverse and complex patterns of activity. (B) During active computation, the population of pyramidal neurons engages in a complex pattern of mutual excitation. Averaged across the population, these appear Poisson-distributed, and no special timescale emerges in the ECoG signal produced by this local, cortical-cortical interaction. (C) The synchronized influence of the rhythm forces cortical-cortical inputs to synchronize, effectively reducing their ability to perform computation. This modulation of local activity by rhythms is revealed at our ECoG scale by significant broadband modulation by low-frequency phase.
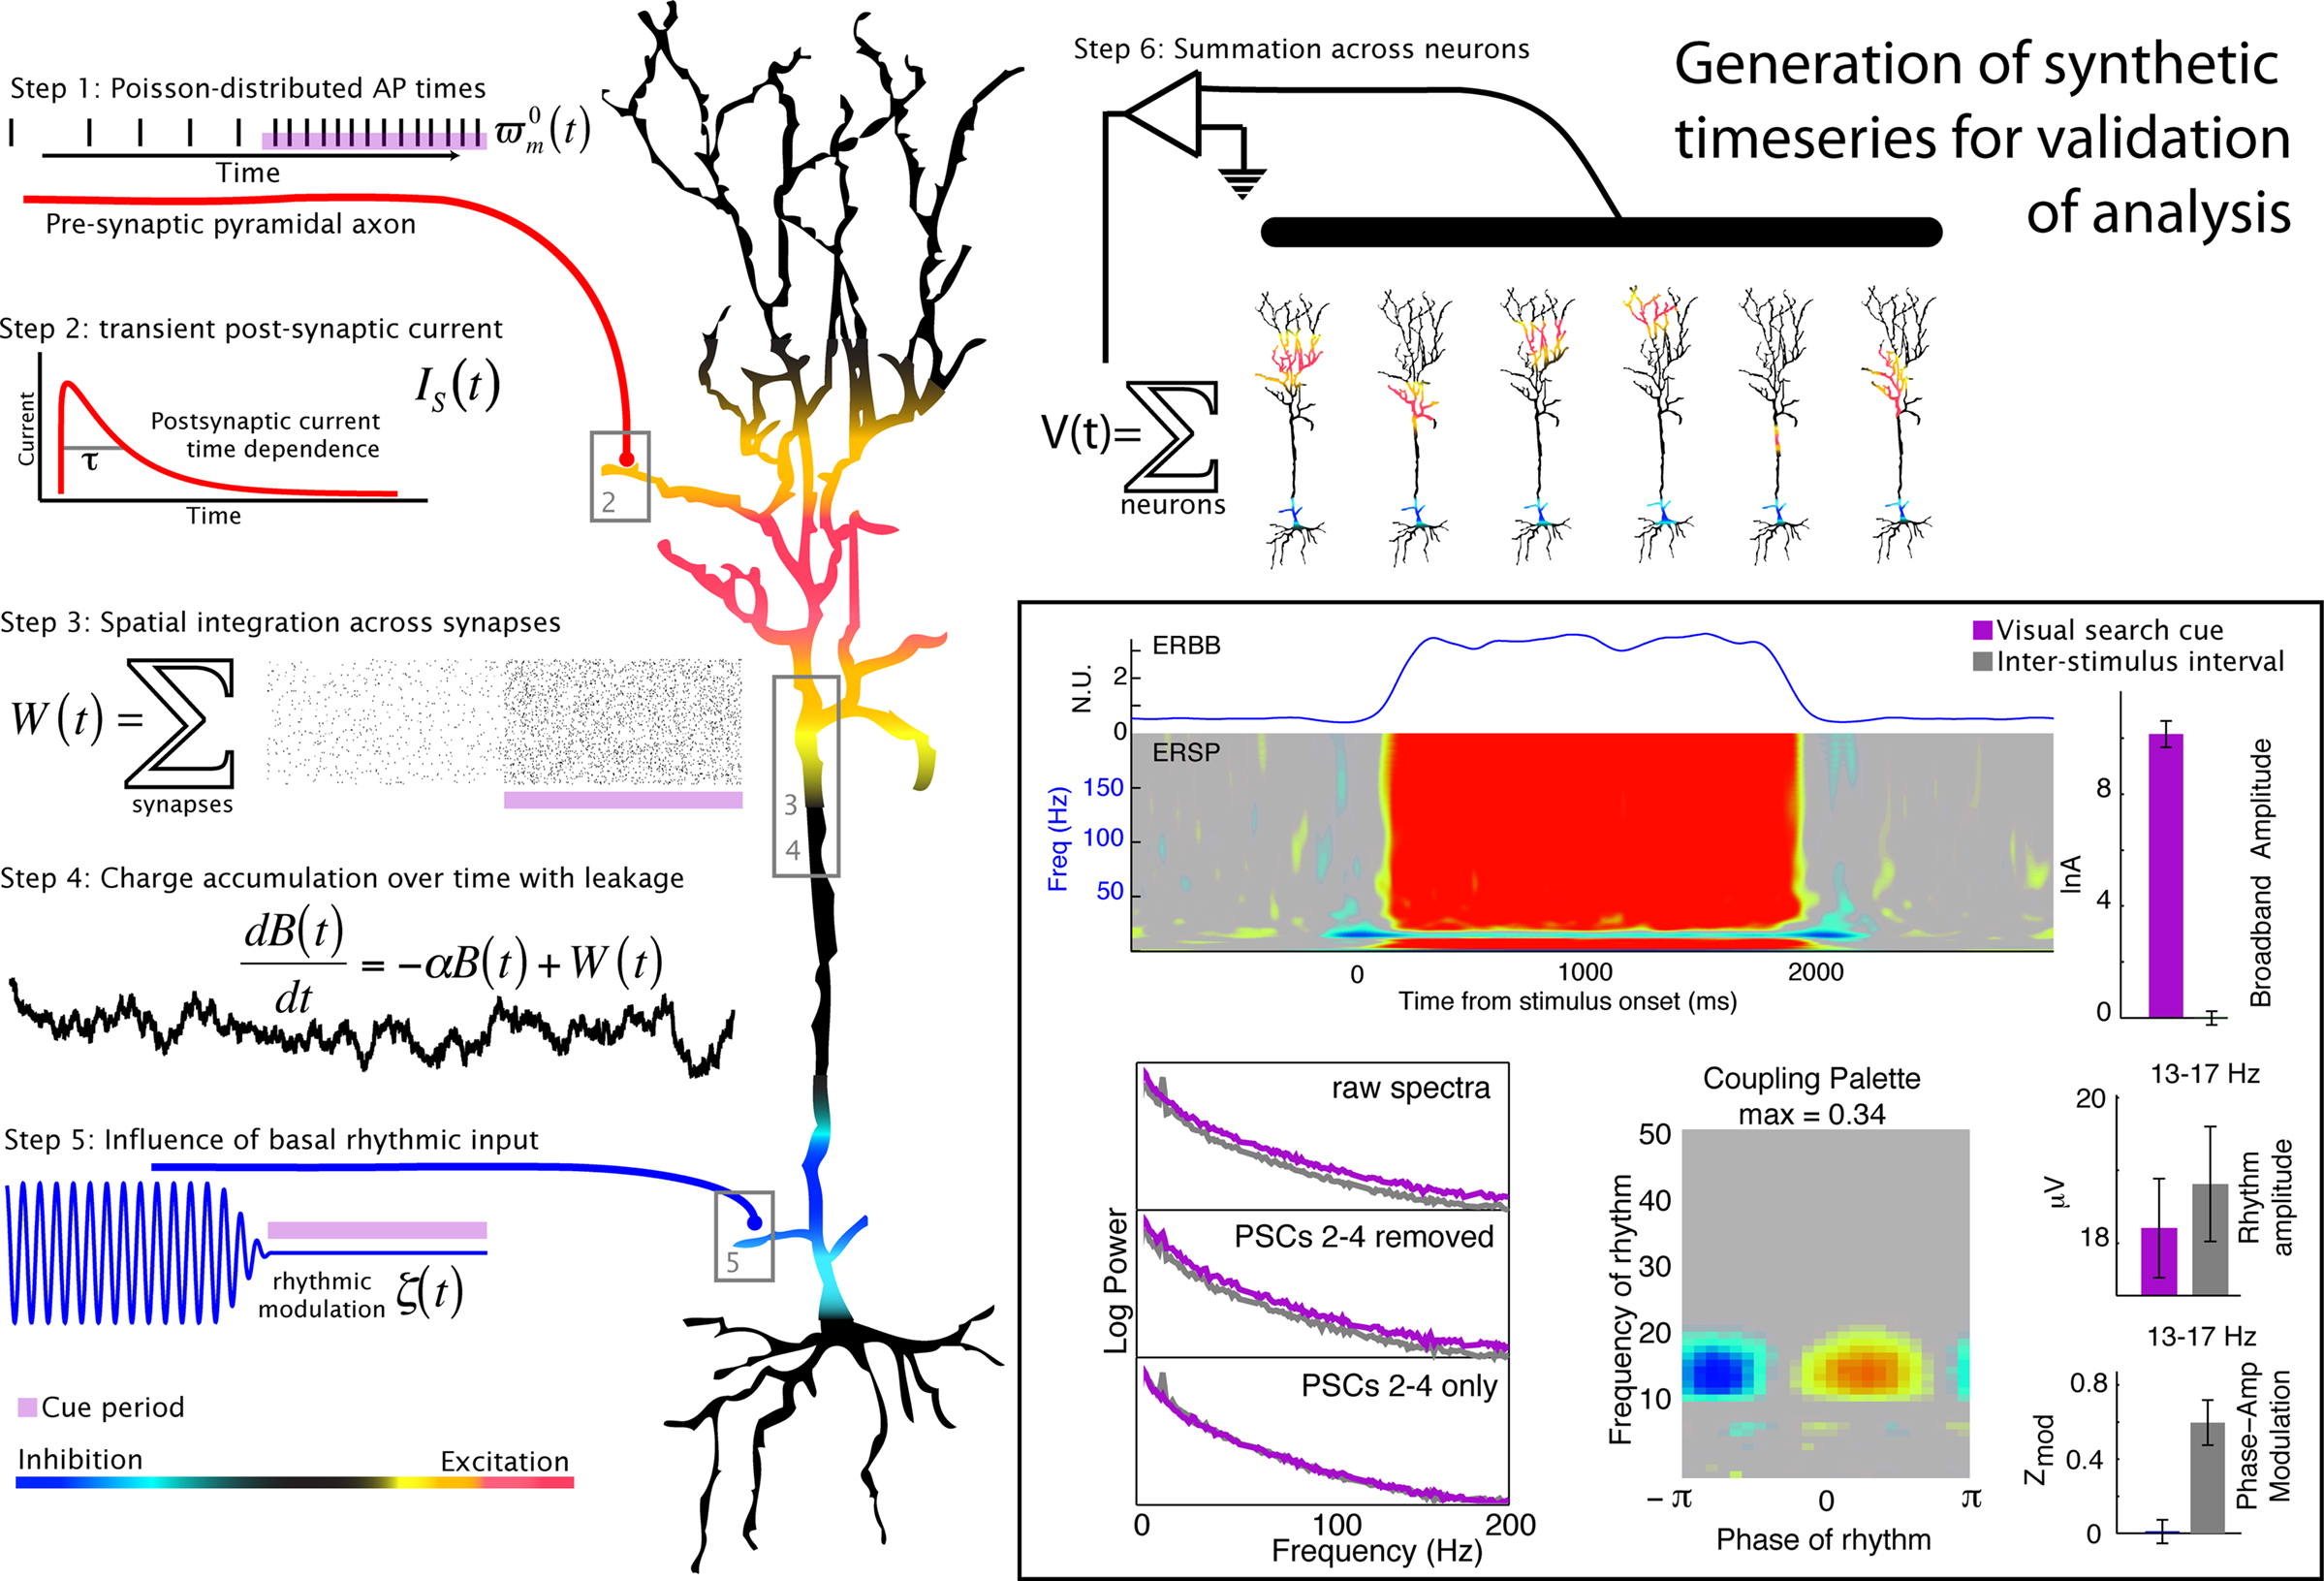
Figure 8. Generation of a simulated timeseries and validation of signal processing technique. The illustrated heuristic was used to generate a 1/f base, broadband, synthetic timeseries (e.g., Miller et al., 2009b) that is modulated by a 15 Hz rhythm (described in detail in the Appendix). In the boxed region on the bottom right, the synthetic timeseries is analyzed in the same way as the physiological data. It demonstrates that the decoupling and phase modulation estimation signal processing techniques described in this manuscript work for simulated data that were based on the mechanisms hypothesized for our physiological data (e.g., Figure 7).
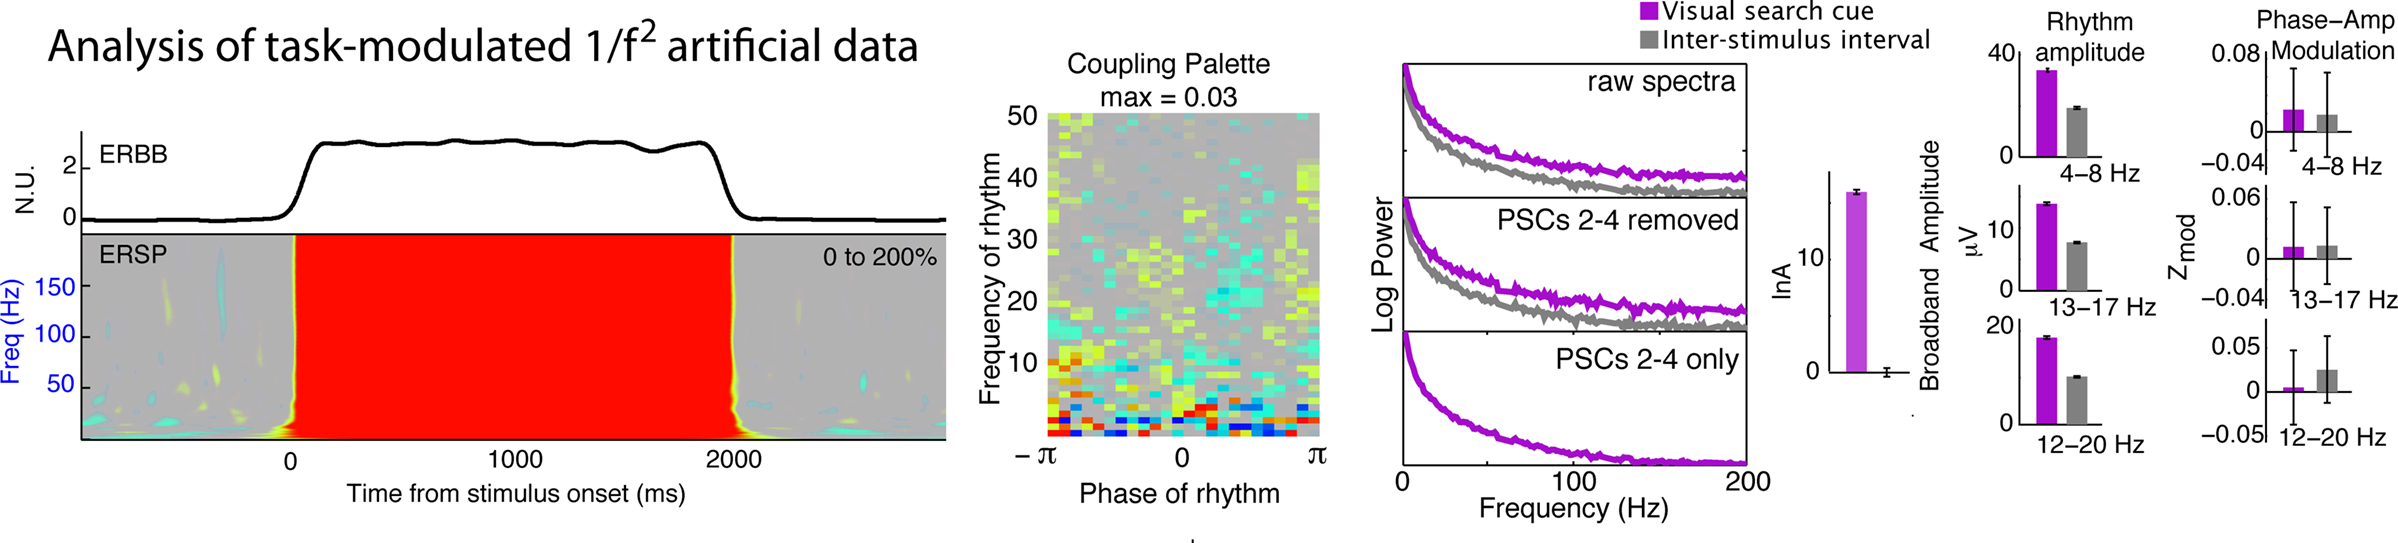
Figure 9. Application of signal processing technique to colored noise. When the signal processing methods were applied to task-modulated P ∼ f−2 colored noise as a negative control, there is no significant coupling.
Discussion
Our most significant and novel finding is that local cortical activity is dynamically modulated by the phase of different brain rhythms, tracking cognitive engagement on a second-to-second basis for specific cortical sites. In the occipital cortex this modulation was most pronounced in the θ (4–8 Hz) and β (12–20 Hz) ranges during periods of relative cognitive disengagement and dissolves during engagement in a visual search task. This relative increase and decrease of phase–amplitude modulation during visual search engagement suggests that rhythms can actively both suppress and facilitate sensory processing in the occipital cortex. Even though the spatial distribution of amplitude changes in rhythms can be widely distributed across the occipital lobe, the influence that they have on local cortical activity is gyrally specific.
Implications of Rhythmic Modulation of Broadband Activity
From the perspective that broadband power reflects aggregate firing rate, the modulation of broad band activity by these lower frequency oscillations would indicate that these rhythms are influencing the instantaneous firing rate of many neurons simultaneously. This is consistent with coarse-graining of phenomena at the single-neuron scale, where the timing of individual action potentials is preferentially locked to a specific phase of ongoing local field potential oscillations (“spike-field coupling” – Buzsaki and Draguhn, 2004). Thus, ECoG rhythm phase to broadband amplitude findings, such as those reported in this study, may reveal a population-averaged reflection of this spike-field coupling. Because these experimental results imply that rhythms are modulating the activity of whole neuronal populations, a distinction must be drawn between fluctuations in rhythmic modulation and amplitude in a rhythm. For example, in Figure 4D there is a decrease in both the amplitude and the modulation associated with the 12–20 Hz rhythm, but in Figure 4G the decrease in 12–20 Hz rhythm is not accompanied by a corresponding decrease in modulation.
Technical Considerations
The techniques presented here for characterizing and statistically testing phase and amplitude interactions in the cortical surface potential are performed in stages, each of which is non-trivial. We independently isolate a broadband signal and simultaneous brain rhythms; subsequently, we examine correlations between these two phenomena. In order to test whether our assumptions about the underlying mechanisms could be valid, we constructed a simulated signal that had task-related broadband change, and was modulated by rhythmic influence in a task-dependent way (Figure 8). Our analytic algorithms were able to naively uncover the broadband change as well as the rhythmic modulation. These phenomena are not induced by event-related potentials; the ERP dies out after 400 ms, and is thus too transient to account for the robust amplitude modulation we observe. Furthermore, the ISI periods had smaller or no ERPs, and exhibited dramatically larger modulation. Sharp discontinuities in the timeseries can give artificial phase modulation at higher frequencies, so artifactual epochs had to be excluded from analysis. When the method was applied to task-modulated brown noise (Figure 9), there was no coupling, suggesting that coupling is not a by-product of the method used for analysis.
Suppression by Synchronization
Existing studies of rhythm-broadband modulations have mainly focused on a facilitatory role (Womelsdorf et al., 2005; Canolty et al., 2006; Jensen and Colgin, 2007; Siegel et al., 2008; He et al., 2010), suggesting that the presence of a rhythm enables an active component of local cortical processing. While this may be the case for θ-range modulations, including those observed here, the β-range changes we observe are more suggestive of an inhibitory process in which the rhythm actively modulates local occipital cortical activity during periods of task disengagement (Handel et al.; Klimesch et al., 2007). In the setting of the γ-rhythm, it has been demonstrated that the influence of the rhythm facilitates cortical computation (Womelsdorf et al., 2007), particularly during visual processing. These observations have been linked to the hypothesis that rhythms enhance spike transmission between synchronized areas – “communication through coherence” (Singer, 1993; Fries, 2005). This is consistent with the increase in power that we observe in γ-rhythms (Figures 4H,I). We propose that rhythms may also play a role in suppressing local cortical computation, with the cortically suppressed (disengaged) state one in which widespread populations of cortical neurons are phase-coupled to the rhythm (Figure 7). In this “suppression-by-synchronization” model, neurons from a distant “pacemaker” circuit project diffusely to populations of cortical pyramidal neurons, targeting their basal dendrites and somas with synchronized input. Whether the synchronized inputs are excitatory or inhibitory, the cortico-cortical inputs between pyramidal neurons will need to be stochastically resonant with the synchronized input to induce a downstream action potential (anti-aligned if the synchronizing input is inhibitory, aligned if it is excitatory). In this way, weak but synchronous input keeps the population in a “dynamically suppressed” state, where it can quickly transition into an engaged “processing state.” An alternative model – suppression by blanket inhibition, would be more metabolically expensive and would also not allow for easy transition from the suppressed state to a computing state because the targeted pyramidal population would have to overcome an effective hyperpolarization barrier. In the suppression-by-synchronization regime, one need only remove time-locking influence and the neuronal population can switch to an engaged and actively computing state. At this stage, identifying the anatomic locus of the synchronizing source will require further research. The thalamus, specifically the lateral pulvinar and lateral geniculate nucleus, is a compelling candidate because of its diffuse projection and known role in visual processing (Zhang et al., 2010). Additionally, it has been demonstrated that weak but synchronous thalamic input can drive cortical processing dramatically in the active feedforward state (Bruno and Sakmann, 2006). Whatever the case, this rhythmic modulatory influence acts over large cortical regions, and coherence is significantly decreased during visual engagement (Figure 4J). Perhaps the same is true for selective suppression of other cortical regions. During behavior, some rhythms might serve as “spotlights of utility” that, at baseline, actively suppress non-relevant cortical areas by synchronization. When the cortical area becomes functionally relevant the rhythm is withdrawn.
Universal Rhythmic Motifs?
Although it is frequently treated as if a rhythm at a particular frequency has a universal functional property, a rhythm with a particular center frequency need not serve a single neural function in every state and location in which it is observed. The fact that we observe different preferred phases, and also conjugate task-related changes in the same frequency ranges, in different cortical areas, suggests that there is unlikely to be a simple, universal, role for a particular band-limited rhythm. What we call “β” in the lateral occipital gyrus and what we call “β” at the occipital pole may in fact represent different phenomena, with different physiological origins, but with a common timescale and corresponding frequency range (Figure 4). That said, the observation of significant changes in inter-electrode coherence between adjacent electrodes suggests a common etiology that selectively releases some cortical areas (e.g., sites Figures 4A–D,G) but not others (sites Figures 4E,F), in a gyrally-conserved way, during task engagement.
The fact that the phase–amplitude coupling motifs sometimes shift substantially in phase across subjects or electrodes might point to different types of physiologic phenomena which are revealed with different types of rhythmic coupling motifs. For example, a rhythm with one preferred phase might exert an excitatory influence via one class of channels, and a different rhythm might exert an inhibitory influence via a separate class of channels. The different timescales implied by the frequencies different rhythmic phenomena might reflect feedback loops involving different numbers of neurons, or slow versus fast types of membrane channels. Some rhythms might reflect emergent properties of highly interconnected networks, while other rhythms of the same frequency range but different cortical location, might reflect cortical-subcortical feedback loops.
The observed nesting of 12–20 Hz amplitude in the 4–8 Hz phase demonstrates that, in some cases, the physiologic processes underlying these rhythms can interact with one another, and in a task-dependent manner (see, for example Lakatos et al., 2005; Tort et al., 2009).
Emerging Questions
This study is part of a continuing project to investigate the many phase-phase, phase–amplitude and amplitude–amplitude couplings both within and between electrodes on the cortical surface. Are there functionally relevant shifts in coupling phase across distinct behavioral states? Are these interactions present between cortical regions communicating over many centimeters? What rhythms play a role in different cognitive and sensorimotor processes? Can we measure a distant source of the rhythm at the same time as the nested oscillation, and is there in fact such a source? Is there a direct relationship between the phase of the coupling we observe and the spike-field coupling measured at the single-neuron scale? Answers to these questions will likely pave the way for a new understanding of large-scale information processing mechanisms in the human brain.
Conflict of Interest Statement
The authors declare that the research was conducted in the absence of any commercial or financial relationships that could be construed as a potential conflict of interest.
Acknowledgments
We appreciate the time and dedication of the patients and staff at Harborview Hospital in Seattle, WA. We thank Jaan Aru and Lise Johnson for helpful discussion. This research was supported by generous the contribution of National Aeronautics and Space Administration Graduate Student Research Program (KJM); National Institute of General Medical Sciences Medical Scientist Training Program (KJM); National Science Foundation 0622252 and 0642848 (KJM, RPNR, JGO); National Institute of Health R21-DA024423 (CJH), RO1-NS12542 (EEF), R01-NS065186 (KJM, JGO); James S. McDonnell fund – 22 3921 26239B (ECL).
References
Beck, A. (1891). Mapping of localization in brain and cortex by means of electric phenomena. Polska Akademica Umiejetnosci 2, 186–232.
Bedard, C., Kroeger, H., and Destexhe, A. (2006). Does the 1/f frequency scaling of brain signals reflect self-organized critical states? Phys. Rev. Lett. 97, 118102.
Brindley, G. S., and Craggs, M. D. (1972). The electrical activity in the motor cortex that accompanies voluntary movement. J. Physiol. (Lond.) 223, 28P.
Bruno, R. M., and Sakmann, B. (2006). Cortex is driven by weak but synchronously active thalamocortical synapses. Science 312, 1622.
Canolty, R. T., Edwards, E., Dalal, S. S., Soltani, M., Nagarajan, S. S., Kirsch, H. E., Berger, M. S., Barbaro, N. M., and Knight, R. T. (2006). High gamma power is phase-locked to theta oscillations in human neocortex. Science 313, 1626.
Cohen, M. X., Elger, C. E., and Fell, J. (2009). Oscillatory activity and phase–amplitude coupling in the human medial frontal cortex during decision making. J. Cogn. Neurosci. 21, 390–402.
Connor, J. A., and Stevens, C. F. (1971). Inward and delayed outward membrane currents in isolated neural somata under voltage clamp. J. Physiol. (Lond.) 213, 1.
Crone, N. E., Hao, L., Hart, J. Jr, Boatman, D., Lesser, R. P., Irizarry, R., and Gordon, B. (2001). Electrocorticographic gamma activity during word production in spoken and sign language. Neurology 57, 2045.
Edwards, E., Soltani, M., Kim, W., Dalal, S. S., Nagarajan, S. S., Berger, M. S., and Knight, R. T. (2009). Comparison of time–frequency responses and the event-related potential to auditory speech stimuli in human cortex. J. Neurophysiol. 102, 377.
Fries, P. (2005). A mechanism for cognitive dynamics: neuronal communication through neuronal coherence. Trends Cogn. Sci. (Regul. Ed.) 9, 474–480.
Fries, P., Reynolds, J. H., Rorie, A. E., and Desimone, R. (2001). Modulation of oscillatory neuronal synchronization by selective visual attention. Science 291, 1560.
Goupillaud, P., Grossmann, A., and Morlet, J. (1984). Cycle-octave and related transforms in seismic signal analysis. Geoexploration 23, 85–102.
Handel, B. F., Haarmeier, T., Jensen, O. Alpha oscillations correlate with the successful inhibition of unattended stimuli. J. Cogn. Neurosci. [Epub ahead of print].
He, B. J., Zempel, J. M., Snyder, A. Z., and Raichle, M. E. (2010). The temporal structures and functional significance of scale-free brain activity. Neuron 66, 353–369.
Hermes, D., Miller, K. J., Noordmans, H. J., Vansteensel, M. J., and Ramsey, N. F. (2010). Automated electrocorticographic electrode localization on individually rendered brain surfaces. J. Neurosci. Methods 185, 293–298.
Jacobs, J., and Kahana, M. J. (2010). Direct brain recordings fuel advances in cognitive electrophysiology. Trends Cogn. Sci. (Regul. Ed.) 14, 162–171.
Jensen, O., and Colgin, L. L. (2007). Cross-frequency coupling between neuronal oscillations. Trends Cogn. Sci. (Regul. Ed.) 11, 267–269.
Klimesch, W., Sauseng, P., and Hanslmayr, S. (2007). EEG alpha oscillations: the inhibition-timing hypothesis. Brain Res. Rev. 53, 63–88.
Lakatos, P., Shah, A. S., Knuth, K. H., Ulbert, I., Karmos, G., and Schroeder, C. E. (2005). An oscillatory hierarchy controlling neuronal excitability and stimulus processing in the auditory cortex. J. Neurophysiol. 94, 1904.
Lindén, H., Pettersen, K. H., and Einevoll, G. T. (2010). Intrinsic dendritic filtering gives low-pass power spectra of local field potentials. J. Comput. Neurosci. 1–22. [Epub ahead of print].
Makeig, S., Westerfield, M., Jung, T. P., Enghoff, S., Townsend, J., Courchesne, E., and Sejnowski, T. J. (2002). Dynamic brain sources of visual evoked responses. Science 295, 690.
Manning, J. R., Jacobs, J., Fried, I., and Kahana, M. J. (2009). Broadband shifts in local field potential power spectra are correlated with single-neuron spiking in humans. J. Neurosci. 29, 13613.
Miller, K. J. (2010). Broadband spectral change: evidence for a macroscale correlate of population firing rate? J. Neurosci. 30, 6477.
Miller, K. J., Weaver, K. E., and Ojemann, J. G. (2009a). Direct electrophysiological measurement of human default network areas. Proc. Natl. Acad. Sci. U.S.A. 106, 12174.
Miller, K. J., Sorensen, L. B., Ojemann, J. G., and den Nijs, M. (2009b). Power-law scaling in the brain surface electric potential. PLoS Comput. Biol. 5, e1000609. doi: 10.1371/journal.pcbi.1000609.
Miller, K. J., Zanos, S., Fetz, E. E., den Nijs, M., and Ojemann, J. G. (2009c). Decoupling the cortical power spectrum reveals real-time representation of individual finger movements in humans. J. Neurosci. 29, 3132.
Miller, K. J., Schalk, G., Fetz, E. E., Den Nijs, M., Ojemann, J. G., and Rao, R. P. N. (2010a). Cortical activity during motor execution, motor imagery, and imagery-based online feedback. Proc. Natl. Acad. Sci. U.S.A. 108, 4430–4435.
Miller, K. J., Hebb, A. O., Hermes, D., den Nijs, M., Ojemann, J. G., and Rao, R. P. N. (2010b). Brain surface electrode co-registration using MRI and X-ray. IEEE Eng. Med. Biol. Soc. (in print).
Mitchell, J. F., Sundberg, K. A., and Reynolds, J. H. (2009). Spatial attention decorrelates intrinsic activity fluctuations in macaque area V4. Neuron 63, 879–888.
Mormann, F., Fell, J., Axmacher, N., Weber, B., Lehnertz, K., Elger, C. E., and Fernández, G. (2005). Phase/amplitude reset and theta-gamma interaction in the human medial temporal lobe during a continuous word recognition memory task. Hippocampus 15, 890–900.
Okun, M., Naim, A., and Lampl, I. (2010). The subthreshold relation between cortical local field potential and neuronal firing unveiled by intracellular recordings in awake rats. J. Neurosci. 30, 4440.
Osipova, D., Hermes, D., and Jensen, O. (2008). Gamma power is phase-locked to posterior alpha activity. PLoS ONE 3, e3990. doi: 10.1371/journal.pone.0003990.
Penny, W. D., Duzel, E., Miller, K. J., and Ojemann, J. G. (2008). Testing for nested oscillation. J. Neurosci. Methods 174, 50–61.
Pfurtscheller, G. (1999). Event-Related Desynchronization (ERD) and Event Related Synchronization (ERS). Baltimore: Williams and Wilkins.
Sabatini, B. L., and Regehr, W. G. (1996). Timing of neurotransmission at fast synapses in the mammalian brain. Nature 384, 170–172.
Siegel, M., Donner, T. H., Oostenveld, R., Fries, P., and Engel, A. K. (2008). Neuronal synchronization along the dorsal visual pathway reflects the focus of spatial attention. Neuron 60, 709–719.
Singer, W. (1993). Synchronization of cortical activity and its putative role in information processing and learning. Annu. Rev. Physiol. 55, 349–374.
Tort, A. B. L., Komorowski, R. W., Manns, J. R., Kopell, N. J., and Eichenbaum, H. (2009). Theta–gamma coupling increases during the learning of item–context associations. Proc. Natl. Acad. Sci. U.S.A. 106, 20942.
Whittingstall, K., and Logothetis, N. K. (2009). Frequency-band coupling in surface EEG reflects spiking activity in monkey visual cortex. Neuron 64, 281–289.
Womelsdorf, T., Fries, P., Mitra, P. P., and Desimone, R. (2005). Gamma-band synchronization in visual cortex predicts speed of change detection. Nature 439, 733–736.
Womelsdorf, T., Schoffelen, J. M., Oostenveld, R., Singer, W., Desimone, R., Engel, A. K., and Fries, P. (2007). Modulation of neuronal interactions through neuronal synchronization. Science 316, 1609.
Keywords: electrocorticography, occipital cortex, vision, broadband, rhythm, phase–amplitude coupling, nested oscillation, beta
Citation: Miller KJ, Hermes D, Honey CJ, Sharma M, Rao RPN, den Nijs M, Fetz EE, Sejnowski TJ, Hebb AO, Ojemann JG, Makeig S and Leuthardt EC (2010) Dynamic modulation of local population activity by rhythm phase in human occipital cortex during a visual search task. Front. Hum. Neurosci. 4:197. doi: 10.3389/fnhum.2010.00197
Received: 26 July 2010;
Accepted: 29 September 2010;
Published online: 29 October 2010
Edited by:
Thilo Womelsdorf, Robarts Research Institute London, CanadaReviewed by:
Tobias H. Donner, University of Amsterdam, NetherlandsMichael Breakspear, Queensland Institute of Medical Research, Australia
Copyright: © 2010 Miller, Hermes, Honey, Sharma, Rao, den Nijs, Fetz, Sejnowski, Hebb, Ojemann, Makeig and Leuthardt. This is an open-access article subject to an exclusive license agreement between the authors and the Frontiers Research Foundation, which permits unrestricted use, distribution, and reproduction in any medium, provided the original authors and source are credited.
*Correspondence: Kai J. Miller, Department of Physics, University of Washington, Box 351560, Seattle, WA 98195, USA. e-mail: kjmiller@u.washington. edu; kjmiller@gmail.com