Dissociation of response and feedback negativity in schizophrenia: electrophysiological and computational evidence for a deficit in the representation of value
- 1 VISN 5 Mental Illness Research, Education, and Clinical Center, Baltimore, MD, USA
- 2 Department of Psychiatry, University of Maryland School of Medicine, Baltimore, MD, USA
- 3 Department of Psychology, University of Victoria, Victoria, BC, Canada
- 4 Maryland Psychiatric Research Center, University of Maryland School of Medicine, Catonsville, MD, USA
Contrasting theories of schizophrenia propose that the disorder is characterized by a deficit in phasic changes in dopamine activity in response to ongoing events or, alternatively, by a weakness in the representation of the value of responses. Schizophrenia patients have reliably reduced brain activity following incorrect responses but other research suggests that they may have intact feedback-related potentials, indicating that the impairment may be specifically response-related. We used event-related brain potentials and computational modeling to examine this issue by comparing the neural response to outcomes with the neural response to behaviors that predict outcomes in patients with schizophrenia and psychiatrically healthy comparison subjects. We recorded feedback-related activity in a passive gambling task and a time estimation task and error-related activity in a flanker task. Patients’ brain activity following an erroneous response was reduced compared to comparison subjects but feedback-related activity did not differ between groups. To test hypotheses about the possible causes of this pattern of results, we used computational modeling of the electrophysiological data to simulate the effects of an overall reduction in patients’ sensitivity to feedback, selective insensitivity to positive or negative feedback, reduced learning rate, and a decreased representation of the value of the response given the stimulus on each trial. The results of the computational modeling suggest that schizophrenia patients exhibit weakened representation of response values, possibly due to failure of the basal ganglia to strongly associate stimuli with appropriate response alternatives.
Introduction
For more than 30 years, pharmacological, neurophysiological, and neuroimaging studies have documented that the dopamine (DA) system is disrupted in schizophrenia (see Davis et al., 1991 for a review). Although the initial formulation of the dopamine hypothesis of schizophrenia, which proposed that the illness was the result of hyperdominergia (Matthysse, 1973) has been refined, the dopamine system has remained central to the study of schizophrenia. The antipsychotic effects of DA-blocking medications provide evidence of a relationship between tonic DA levels and the symptoms of schizophrenia but recent theoretical and empirical advances in the study of phasic DA activity (Schultz, 1998, 2002) allow new understanding of some of the most persistent cognitive and motivational deficits characteristic of the illness (Ziauddeen and Murray, 2010).
Many of these advances are based upon findings from studies of transient changes in mesencephalic DA neurons in primates (Schultz, 1998, 2002). This work describes phasic increases and decreases in firing of these neurons that can be understood as coding an error signal associated with a reinforcement learning algorithm (see Suri, 2002 for a review). In neural network models, reward prediction error signals (RPEs) are computed by an “adaptive critic” that attributes a value to ongoing events and outputs an error when it changes its own prediction. Positive (+) RPEs indicate that ongoing events are “better” than expected, and negative (−) RPEs indicate that ongoing events are “worse” than expected. This RPE signal may be used as a learning signal by DA target areas in order to optimize performance (Schultz et al., 1995). RPE signals are based on neural representations of value associated with different response alternatives (Montague and Sejnowski, 1994; Niv, 2009) and these values appear to be represented in the basal ganglia (Samejima et al., 2005; Lau and Glimcher, 2008) where the critic is thought to reside (O’Doherty et al., 2004).
This understanding of the functioning of phasic DA has given rise to contrasting models of schizophrenia and motivational impairment. One hypothesis is based on the idea that there is a primary impairment in the ability to signal prediction errors (Corlett et al., 2007; Frank, 2008; Fletcher and Frith, 2009), a hypothesis supported by evidence of reduced brain activity following RPEs in individuals with schizophrenia (Waltz et al., 2009) and disrupted frontal activity following RPEs in individuals with ketamine-induced delusions and perceptual aberrations (Corlett et al., 2006). This hypothesis is also consistent with behavioral studies showing learning impairments and decreased reward-related response speeding (Waltz et al., 2007; Murray et al., 2008) in schizophrenia. By this account, disruption of RPE-related DA signaling interferes with reinforcement and response selection in schizophrenia, such that behavioral motivation is based on faulty associations and contingencies (Kapur, 2003; Smith et al., 2006). An alternative hypothesis proposes that schizophrenia patients experience decreased motivational drive due to impaired representation of response value despite normative evoked emotional experiences (Gold et al., 2008). This model is based on observations that associations between subjective valuation of stimuli and subsequent action selection are weaker in schizophrenia patients than psychiatrically healthy comparison subjects (Heerey and Gold, 2007) and that patients appear to fail to fully represent the full range of possible outcomes when choosing among gambling options (Heerey et al., 2008). This model is consistent with recent evidence of poor internal representation of motivational information (Ursu et al., 2011) and disruption of error likelihood predictions (Krawitz et al., 2011) in schizophrenia. This pattern of findings suggest that schizophrenia patients experience a deficit in the ability to simultaneously represent and consider the various cognitive and affective attributes associated with different response options, resulting in a selective impairment in motivation to seek out rewarding activities which is especially apparent in patients with high levels of negative symptoms (Gold et al., in press).
Reinforcement learning models can provide insight into these alternative mechanisms because they provide formal accounts of the relationship between predictive values associated with behavior and subsequent outcomes that do or do not violate those predictions (Niv, 2009). As a case in point, the reinforcement learning theory of the error-related negativity (RL–ERN; Holroyd and Coles, 2002) provides a framework for evaluating whether impairments in the representation of response Value (as mediated by the basal ganglia) and/or RPE signals (as mediated by the DA system) are apparent in schizophrenia. The RL–ERN model links the properties of the phasic DA system to learning-related changes in event-related brain potentials (ERPs) that follow correct vs. incorrect responses (the response ERN; Falkenstein, 1990; Gehring et al., 1993) and rewarding vs. non-rewarding outcomes (the feedback ERN; Miltner et al., 1997; Gehring and Willoughby, 2002; Ruchsow et al., 2002). In this model, changes in the response and feedback ERN that accompany learning reflect the functioning of a dopamine-mediated reward system in which motor neurons in the ACC use signals carried by the DA system for the adaptive modification of behavior. As with other reinforcement learning models, the RPEs are driven by changes in predictive Value implemented by the critic, which is hypothesized to lie in the basal ganglia (Holroyd and Coles, 2002). Thus, for example, the basal ganglia may contain units that represent whether a left or a right button press predicts reward. The RL–ERN theory holds that the generation of the ERN is associated with the impact on ACC of phasic decreases in DA activity on error trials (−RPEs) when events are worse than predicted vs. phasic positive increases of DA activity on correct trials (+TDEs; Holroyd et al., 2008) when events are better than predicted. In this way, the ERN is elicited when the system first determines the outcome of the trial such that a response ERN is elicited when the correctness of the response is detected immediately following the response and a feedback ERN is elicited when it is detected because of the feedback. In trial-and-error learning tasks, participants gradually learn the stimulus–response mappings and become able to judge their accuracy. Concomitantly, the performance feedback becomes redundant and the ERN propagates from the time of feedback presentation to the time of response generation (Holroyd and Coles, 2002).
Schizophrenia patients reliably exhibit diminished response ERN amplitude relative to healthy subjects across task types (Kopp and Rist, 1999; Alain et al., 2002; Bates et al., 2002, 2004; Mathalon et al., 2002; Morris et al., 2006) but the integrity of the feedback ERN in schizophrenia is less clear. Previously, to examine the integrity of the –RPE as an indicator of the function of the phasic DA system, we studied schizophrenia patients while they completed a probabilistic learning task (PLT) in which the validity of the accuracy feedback varied (Morris et al., 2008). Schizophrenia patients exhibited reduced response ERN amplitude in all conditions and reduced feedback ERN amplitude in the valid feedback condition during early trials when the feedback was most informative for stimulus–response learning. In the other feedback conditions, however, group differences in feedback ERN amplitude were equivocal. To date, this is the only study that has examined the feedback ERN in schizophrenia patients and the finding that this activity was only selectively impaired was unexpected. Thus, we were motivated to examine this question more closely.
Here, we examined whether schizophrenia patients exhibit impairment in both of these putatively DA-related ERP components (the response and feedback ERNs) or whether they exhibit a selective deficit in the response ERN only. Further, we used computational modeling to distinguish whether the results stem from an impairment in the transmission of RPE signals vs. a deficit in predictive value associated with response generation; because the RPEs by definition constitute violations of predictive value, without a formal account of their relationship the two possibilities would otherwise be difficult to disentangle. We examined the ERN on two tasks that elicit a feedback ERN, a passive gambling task and a time estimation task, and a third task that elicits a response ERN, a flanker task. The passive gambling task, modeled after Potts et al. (2006), was selected because it elicits a feedback ERN in the absence of a response, thus removing between-group variability due to differences in perceived task difficulty or response speed or accuracy. The time estimation task was selected because it elicits a robust feedback ERN (Miltner et al., 1997; Holroyd et al., 2006; Holroyd and Krigolson, 2007) and the parameters can be adjusted so that individuals with disparate response accuracy receive the various types of feedback with similar frequency. These tasks include a sufficient number of trials (more than 50) to obtain a reliable feedback ERN (Marco-Pallares et al., 2011). The Eriksen flanker task (EFT; Eriksen and Eriksen, 1974) was used for eliciting the response ERN because it induces speeded motor errors and does not require memorization of response rules that might prove differentially challenging for the patient group. It has also been used in previous studies of the ERN in schizophrenia (Kopp and Rist, 1999; Morris et al., 2006) so it serves as a good benchmark for evaluating the findings of the current study. In addition to these three tasks, we also re-analyzed the ERP data from our previous PLT study (Morris et al., 2008) using a difference wave approach (Holroyd and Krigolson, 2007) in order to measure both the response and feedback ERN in a single task for the purposes of computational modeling.
To preview the results of these studies, the response ERN deficit in schizophrenia was replicated but the same patients showed normal feedback ERN amplitude on both feedback tasks. These results, however, do not unambiguously support either the disrupted RPE model or the impaired response value model of schizophrenia, as it is possible that the response ERN was reduced due to an abnormality in RPE signaling or to a weakened representation of response value. Therefore, we used computational modeling to simulate the ERP results and test alternative hypotheses about the origin of this dissociation between response and feedback ERN abnormalities. Specifically, we utilized a formal instantiation of the RL–ERN theory to parametrically and systematically vary two parameters related to the neural computation of Value (as expressed by the basal ganglia) and to the change in Value (as expressed by the dopamine system) to explore how changes to these parameters would affect the ERN and behavior.
Materials and Methods
Participants
Thirty-two schizophrenia outpatients and 23 healthy comparison subjects completed the time estimation task. All subjects except for two control subjects completed the passive gambling task. A subset of 20 patients and 15 comparison subjects (the final participants recruited into the study) completed the flanker task in addition to the other two tasks. Demographic and clinical characteristics are summarized in Table 1. The groups did not differ in age, t(53) = 0.15, p = 0.88, gender, χ2 (1, N = 55) = 0.075, p = 0.78, or ethnicity, χ2 (2, N = 55) = 2.00, p = 0.37. Schizophrenia patients had fewer years of education than comparison subjects, t(53) = −2.79, p = 0.007, but did not differ in parental education, t(53) = 0.28. The results of these comparisons in age, gender, ethnicity, education, and parental education did not change when only the participants who completed the flanker task were compared.
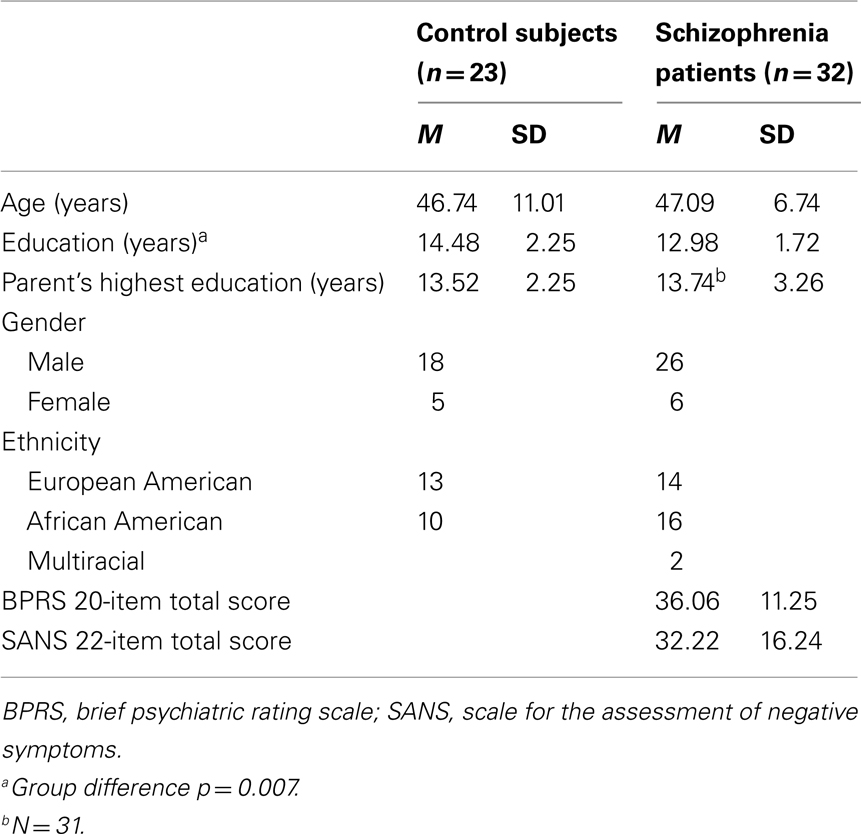
Table 1. Demographic and symptom rating data for control subjects and schizophrenia patients.
Patients were recruited from outpatient psychiatric clinics at the Maryland Psychiatric Research Center and the Baltimore Veterans Affairs Medical Center. They were diagnosed using a best-estimate approach combining information from medical records, collateral information (when available), and the structured clinical interview for DSM-IV (SCID; First et al., 1994). Twenty-seven of the patients were diagnosed with schizophrenia and five were diagnosed with schizoaffective disorder. Patients were medicated with second-generation antipsychotic medication(s) (APM; n = 31) or both a second-generation antipsychotic and a traditional APM (n = 1). On the day of testing, symptom ratings were obtained using the brief psychiatric rating scale (BPRS; Overall and Gorham, 1962) and the scale for the assessment of negative symptoms (SANS; Andreasen, 1982).
Healthy comparison subjects were recruited via newspaper advertisements, fliers, or random-digit dialing of local phone numbers. They were assessed with the SCID and had no personal or family history of schizophrenia or schizoaffective disorder and no personal lifetime history of bipolar disorder or major depressive disorder. A lifetime history of head injury or neurological illness and alcohol or substance dependence in the last 6 months were exclusionary criteria for all participants. All participants provided written informed consent for the protocol which was approved by the University of Maryland School of Medicine IRB and the VA Maryland Healthcare System Research and Development Committee.
Tasks
Testing procedures took place in a sound-attenuated, dimly lit room in which participants were seated approximately 1 m from a video monitor. The order of tasks was counterbalanced.
Passive Gambling Task
Participants completed a passive gambling task modeled after Potts et al. (2006) in which participants viewed pairs of pictures presented sequentially (see also Holroyd et al., 2011). Each picture depicted either a lemon or a gold bar. On 80% of trials, pairs consisted of the same stimulus (i.e., lemon followed by lemon or gold followed by gold, with equal probability). On the remaining trials, pairs consisted of one of each stimulus (i.e., lemon followed by gold or gold followed by lemon, with equal probability). When a gold bar was presented as the second image, it was always followed by feedback indicating a 50¢ bonus. When a lemon was presented as the second image, it was always followed by feedback indicating no bonus. Thus four feedback conditions were created: unexpected non-reward (bar followed by lemon), expected non-reward (lemon followed by lemon), unexpected reward (lemon followed by bar), and expected reward (bar followed by bar). Participants viewed 7 blocks of 48 trials and the total bonus earned during each block was displayed following each block. Participants were informed that one of the bonus amounts (ranging from 9 to 15$) would be selected at random and added to their payment. Trials were ordered in a constrained random sequence such that stimulus pairs were not repeated on more than three consecutive trials. Pictures were displayed for 600 ms. The interval between pictures in a pair was 400 ms, the feedback was displayed for 2200 ms, and the interval between feedback offset and onset of the next image was 400 ms.
Time Estimation Task
Participants completed a task modeled after Holroyd et al. (2006) modification of Miltner et al. (1997) time estimation task in which they were instructed to press a button when they estimated that 1 s had elapsed after the presentation of a tone. Following each response, feedback indicating whether the response was on-time (a plus sign) or not on-time (a zero) was displayed. An adjustable response window was used which decreased the allowable RT deviation as participants became more accurate. The window was initially set to 900–1100 ms and then narrowed by 20 ms following each on-time response and widened by 20 ms following each not on-time response. The maximum window was 0–2000 ms. In light of Holroyd et al. (2006) finding that uninformative feedback elicited a feedback ERN similar in amplitude to that elicited by negative feedback, uninformative/neutral feedback (a question mark) was provided on one-third of trials (selected at random). The tone was 80 Hz, 80 dB presented for 50 ms via ear inserts. Feedback was presented for 1000 ms beginning 3050 ms after tone offset. The interval between feedback offset and the onset of the next tone was 2000 ms. Participants completed 210 trials with brief rest pauses after 70 and 140 trials.
Flanker Task
Subjects performed a modified version of the flanker task (Eriksen and Eriksen, 1974). Each trial began with the display of flanker stimuli which were two pairs of equilateral triangles or squares appearing in a vertical array. Flanker stimuli were displayed for 100 ms before the middle triangle, the target, appeared. Participants were instructed to respond with the hand that corresponded to the direction in which the target was pointing. The flanking triangles were oriented either in the same (congruent condition) or opposite (incongruent condition) direction as the target or flanking squares were used instead of triangles (neutral condition). The six different types of target/flanker combinations were presented with equal frequency and in a constrained random sequence such that no trial type was repeated on more than three consecutive trials. The flanker/target array was displayed for 70 ms. Beginning 2000 ms after the offset of the target array, feedback was displayed for 1000 ms. The delay between the offset of the feedback and the onset of the subsequent flankers was 1950 ms.
Before beginning the flanker task, subjects were instructed to respond quickly and accurately and were penalized 2¢ for incorrect responses, rewarded 2¢ for correct responses and penalized 5¢ for slow responses (RT > 1100 ms) regardless of accuracy. Participants completed 24 practice trials followed by 6 blocks of 54 trials. All flanker stimuli were white presented on a black background.
Psychophysiological Recording, Data Reduction, and Analyses
General procedures
Electroencephalography (EEG) recordings were obtained using 32 Ag/AgCl electrodes in International 10/20 system positions. Electrooculographic activity was recorded from electrodes placed above and below the left eye and at the outer edge of both eyes. Physiological signals were recorded using a Synamps amplifier and Scan 4.3 software (Compumedics/Neuroscan, Charlotte, NC, USA). Scalp EEG data were recorded at a rate of 500 Hz and referenced to averaged earlobe electrodes. After epoching, vertical and horizontal eye movement artifacts were corrected offline (Gratton et al., 1983; Miller et al., 1988), a 0.1- to 20-Hz 24 dB filter was applied and a 200-ms baseline was subtracted from each epoch. The Greenhouse–Geisser adjustment for repeated measures and an alpha level of 0.05 were used. Corrected F, p, and effect size (partial eta squared, or  ) values and uncorrected degrees of freedom are reported. Simple-effects ANOVAs with the Bonferroni correction were used for post hoc comparisons on between-group measures.
Although we have previously (Morris et al., 2008) examined the ERN using a “base-to-peak” approach, recent investigations have indicated that a “difference wave” approach may be more appropriate for extracting this ERP component (Holroyd and Krigolson, 2007), first because it minimizes overlap with other interfering ERP components (Luck, 2005), and second because recent evidence indicates that unexpected positive feedback may elicit a positive-going deflection in the ERP (Holroyd et al., 2008; See also: Potts et al., 2006; Cohen et al., 2007; Eppinger et al., 2008; Baker and Holroyd, 2011; Holroyd et al., 2011) that the base-to-peak approach may overlook. Procedures used for computing difference waves are provided below. Group means and SE for the difference wave amplitude from for the feedback ERN (Passive gambling task and time estimation task) and the response ERN from the flanker task are provided in Table 2.
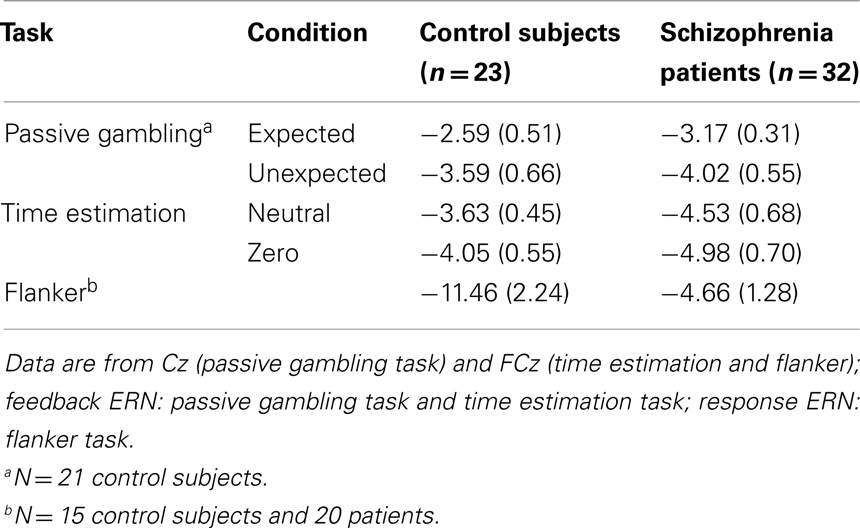
Table 2. Mean (and SE) feedback and response ERN difference wave amplitudes for schizophrenia patients and control subjects.
Passive Gambling Task
For the second stimulus of each pair, “Expected” difference waves were computed by subtracting the Expected Bonus waveforms from the Expected Non-Bonus waveforms. “Unexpected” difference waveforms were computed by subtracting the Unexpected Bonus waveforms from the Unexpected Non-Bonus waveforms (Holroyd and Krigolson, 2007). Examination of the grand-average difference waveforms indicated substantial component overlap characterized by early, frontally distributed activity (the feedback ERN) followed by posteriorly distributed activity (P300). To isolate the feedback ERN from this overlapping component, the latency of the waveforms was adjusted at all channels using the following procedure. The latency of the maximal negativity between 170 and 290 ms was determined for the FCz channel in the expected non-bonus average for each participant. The expected non-bonus condition was used because the feedback ERN was maximal in this condition in the group averages. This latency was then set to 240 ms (the approximate latency of peak in the unadjusted group average waveforms) by adjusting the start point of the waveform by the difference between the latency of the peak and 240 ms. The conditional waveforms for all four feedback conditions in all channels were then adjusted by the same degree and difference waves were re-computed using these adjusted averages. The amplitude of the maximal negativity occurring between 180 and 300 ms was identified in the difference waves and was analyzed using 2 (Group) × 2 (Expectedness) × 5 (Site: Fz, FCz, Cz, CPz, Pz) mixed-model ANOVA. To check whether the latency adjustment obscured effects of interest, difference wave amplitudes from the non-adjusted waveforms were analyzed and the results were unchanged.
Time estimation task
Difference waves for the neutral and “zero” feedback conditions were created by subtracting activity following “plus” feedback from the activity following neutral and “zero” feedback, respectively (Holroyd and Krigolson, 2007). Examination of the grand-average difference waves indicated component overlap similar to that observed in the data from the time estimation task, so a similar latency adjustment was made. For each participant, the latency of the maximum negativity within a narrow window (200–290 ms following FB onset) was identified in the “zero” feedback average in the FCz channel. This latency was then set to 240 ms (the approximate latency of peak in the unadjusted group average waveforms) by adjusting the start point of the waveform by the difference between the latency of the peak and 240 ms. The conditional waveforms for all three feedback conditions in all channels were then adjusted by the same degree. Difference waves were then re-created and the feedback ERN was scored as the amplitude of the maximum negativity occurring between 200 and 280 ms in the neutral and “zero” difference waves. The feedback ERN was compared in a 2 (Group) × 2 (Difference wave type) × 5 (Site: Fz, FCz, Cz, CPz, Pz) mixed-model ANOVA. The results of this analysis were also unchanged when difference wave amplitudes from the non-adjusted waveforms were analyzed.
Flanker task
Response-locked waveforms were created for correct and error trials and difference waves were created by subtracting the activity following correct responses from that following errors. The response ERN was quantified in these difference waves as the maximal negativity between 0 and 150 ms. Data for one control subject whose response ERN difference wave peak amplitude exceeded the group mean by more than 4 SDs were replaced with the next largest values. These were analyzed in two 2 (Group) × 5 (Site: Fz, FCz, Cz, CPz, Pz) mixed-model ANOVAs.
Results
ERP studies
Passive Gambling Task
Event-related brain potential waveforms for the second stimulus, which varied in both valence and expectedness, are shown in Figure 1. Consistent with the hypothesis that the feedback ERN is relatively intact in schizophrenia, there was no difference between groups in feedback ERN difference wave amplitude, F(1, 51) = 0.10, p = 0.75,  Although the peak negativity is more prominent for the expected feedback than for the unexpected feedback in the group average waveforms, the group mean difference scores were larger for unexpected than for expected outcomes, although the effect of expectedness was not significant, F(1, 51) = 2.91, p = 0.09,
  Difference wave amplitudes were greatest at Cz but did not differ significantly among sites, F(4, 204) = 2.32, p = 0.08,
  There were no interactions involving group, expectedness, or channel (all p values > 0.3).
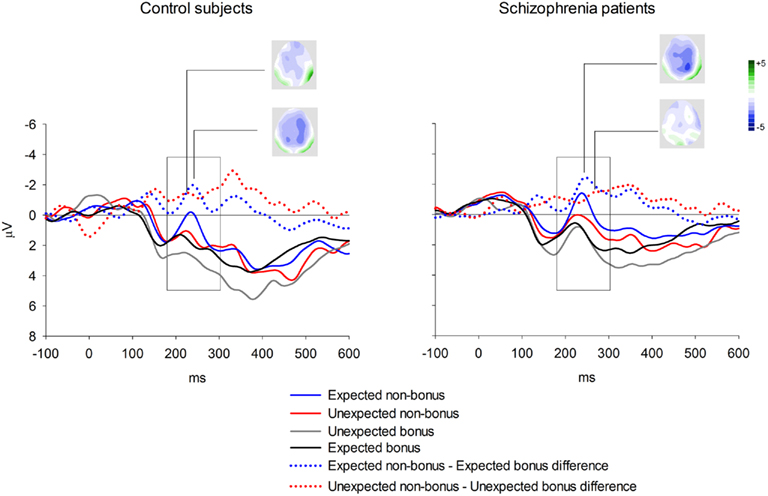
Figure 1. Group averages for feedback ERN elicited by second stimulus in the passive gambling task. Data shown in waveforms are from Cz. The scoring window for the difference waves is indicated by the rectangle.
Time estimation task
Behavior. Because RTs were not recorded for responses occurring more than 3000 ms after the tone, long RTs could not be distinguished from non-responses. In order to avoid overestimating participants’ RT accuracy by omitting these highly inaccurate responses, missing RTs were replaced with the RT from the previous trial (or from the next trial if no response was made on the previous trial). This process may have resulted in a minor overestimation of participants’ response accuracy. The average percentage of trials with missing/replaced RTs did not differ between patients (6%) than controls (3%), F(1, 53) = 1.35, p = 0.25. The absolute deviation of RT from the target RT of 1000 ms was then computed for each trial. Mean RT deviation and a running average of RT deviation over the course of the task are presented in Figure 2. As seen in the figure, the controls were slightly more accurate at estimating the 1-s interval but this difference was not statistically reliable: mean RT deviation, t(53) = 1.83, p = 0.073. Both groups received “zero” feedback on a greater percentage of trials (36%) than “plus” feedback (30%), F(1, 53) = 25.38, p = 0.00,  consistent with the initially narrow RT window. Response time accuracy improved by an average of 87 ms on trials following “zero” feedback, worsened by an average of 106 ms after “plus” feedback and changed by less than a millisecond on average after neutral feedback [main effect of FB type, F(2, 106) = 159.41, p = 0.00,
  ]. This main effect was moderated by a Group × FB type interaction, F(2, 106) = 3.33, p = 0.05,
  characterized by control subjects having a smaller increase in deviation following “plus” feedback than patients, 88 vs. 125 ms, t(53) = 2.09, p = 0.04, suggesting that patients had difficulty sustaining accurate responding following positive feedback.
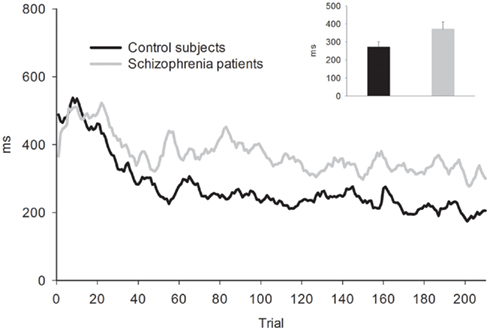
Figure 2. Five-trial running average of absolute RT deviation from target RT for the time estimation task. Bar graph shows mean of absolute RT deviation. Error bars indicate SE.
Event-related brain potentials. Group average latency-adjusted waveforms for the feedback-locked ERPs are presented in Figure 3. Prominent negativities are observed approximately 250 ms following both “zero” and neutral FB compared to “plus” FB. As in the passive gambling task, there was no main effect of group, F(1, 53) = 1.47, p = 0.23,  or any interactions involving group differences for the feedback ERN (all p values > 0.53). There was also no difference between the “zero” and neutral FB conditions in difference wave amplitude, F(1, 53) = 2.32, p = 0.13,
  suggesting that feedback ERN activity in both groups shows the expected pattern of dichotomous classification of outcomes as described by Holroyd et al. (2006). The difference wave amplitudes were largest at the FCz site although the amplitude difference among channels was not significant, F(4, 212) = 2.87, p = 0.06.
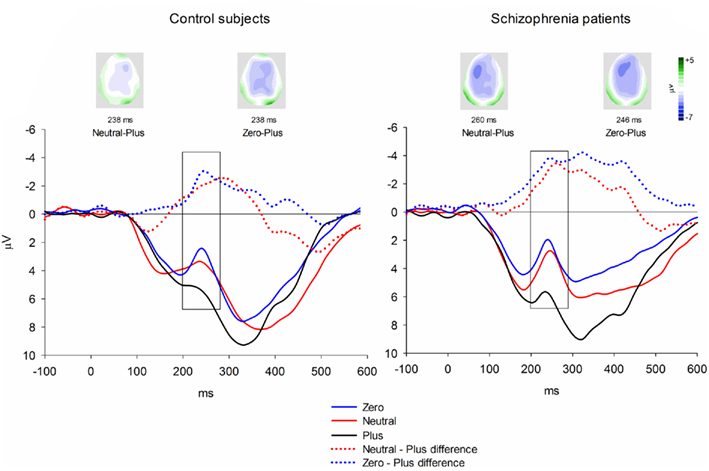
Figure 3. Feedback-locked ERN group averages for the time estimation task. Data shown in waveforms are from FCz. Data in maps are shown at latency of maximal difference wave amplitude. The scoring window for the difference waves is indicated by the rectangle.
Flanker task
Behavior. The flanker type manipulation had the expected effects on response accuracy, F(2, 66) = 70.22, p = 0.00,  and RT, F(2, 66) = 153.23, p = 0.00,
  with better accuracy and faster RT in the congruent compared to incongruent flanker conditions [F(1, 33) = 68.55 and 233.42, respectively, p < 0.001; See Figure 4]. Mean RT was slower for schizophrenia patients than control subjects, F(1, 33) = 10.83, p = 0.002,
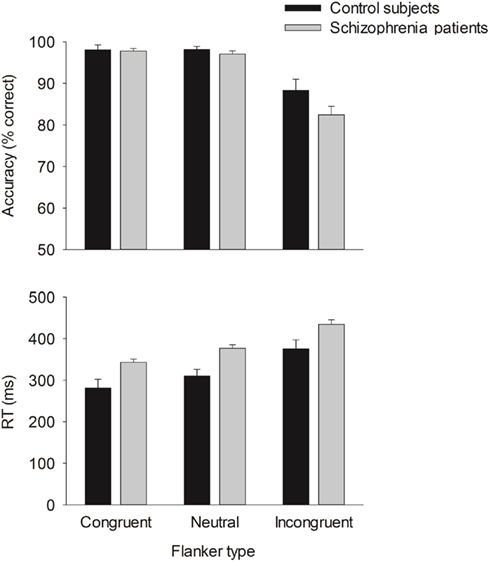
Figure 4. Mean accuracy (top) and RT (bottom) for the flanker task. Error bars indicate SE.
Event-related brain potentials. Consistent with previous studies (e.g., Kopp and Rist, 1999; Morris et al., 2006), the response ERN as measured by error-correct difference wave amplitude was diminished in schizophrenia patients compared to control subjects, F(1, 33) = 6.31, p = 0.02,  (Figure 5). Difference score amplitude was largest at FCz for control subjects and at CPz for patients [Group × electrode site interaction, F(4, 132) = 3.57, p = 0.05]. Because the participants who completed the EFT were a subset of those who completed the time estimation and passive gambling tasks, we repeated the analyses of the data from the feedback ERN tasks including only the participants who completed the flanker task to make sure that the dissociation between response ERN and feedback ERN was not due to the composition of the subject groups. The differences among these samples did not appear to account for the selective deficit in response ERN compared to feedback ERN. The results of the analysis of the ERP data from the time estimation and passive gambling tasks did not differ when individuals who did not complete the flanker task were removed from the analysis (all p values > 0.05). The fact that group differences were observed in the response ERN with a smaller sample size provides some assurance that the failure to find group differences in the feedback ERN was not due to lack of power since the sample size was larger for the feedback ERN tasks. It is, however, possible that there are differences in effect size between response and feedback ERN and that small group differences in feedback ERN could have gone undetected due to lack of power.
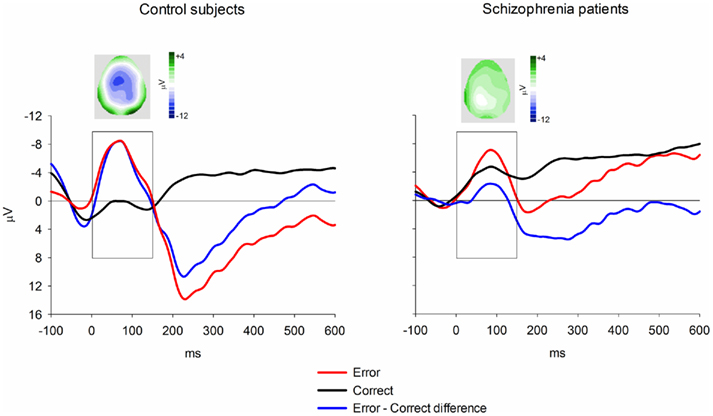
Figure 5. Response-locked ERN group averages for the flanker task. Data shown in waveforms are from FCz. Topographical maps depict distribution of difference wave at latency of peak negativity. The scoring window for the difference waves is indicated by the rectangle.
Computational modeling
Taken together, the above results are strongly suggestive of an impaired response ERN together with a spared feedback ERN in schizophrenia. But what deficit can cause this pattern of observations? Alternative hypotheses (as reviewed above) hold that schizophrenia is associated with impaired dopamine-dependent RPE signals on the one hand (Corlett et al., 2007; Fletcher and Frith, 2009) and with impaired representations of predictive value on the other (Gold et al., 2008). These hypotheses are challenging to distinguish because of their complex interrelationship: predictive values can be derived from RPEs and RPEs reflect changes in predictive value. Computational simulations based on principles of reinforcement learning can illuminate this issue because neurally based models of decision making depend on formal representations of predictive value and RPEs (Suri, 2002; Cohen, 2008; Dayan and Daw, 2008; Cohen and Frank, 2009; Niv, 2009). Further, the RL–ERN theory specifically indicates how these parameters give rise to the response ERN and feedback ERN. For this reason, we adapted a computational model of the response ERN and feedback ERN in the PLT and of the response ERN in the EFT (Holroyd and Coles, 2002) to determine how these ERP components would be affected by changes to these quantities as might occur in schizophrenia. Our modeling efforts focused on these two tasks because they were originally simulated with the RL–ERN model (Holroyd and Coles, 2002). Further, data from our previous study using the PLT (Morris et al., 2008) allowed for comparison of the response ERN and the feedback ERN in a single task, whereas the EFT data from the current study allowed for examination of the response ERN in the absence of feedback-based learning (Holroyd and Coles, 2002, 2008; See also Holroyd et al., 2005).
Methods
The RL–ERN model belongs to a class of neurobiologically motivated computational models that are based on the theory of reinforcement learning (Sutton and Barto, 1998) and that simulate behavior and/or the activity of the midbrain dopamine system on trial-and-error type learning problems (Suri, 2002; Cohen, 2008; Dayan and Daw, 2008; Cohen and Frank, 2009; Niv, 2009). We simulated the ERN and performance of control subjects on the PLT and the EFT using a variant of the standard RL–ERN model, details of which are given in Holroyd and Coles (2008). The original RL–ERN model utilized multiple motor controllers that competed for control over behavior (Holroyd and Coles, 2002). As this aspect of the model was not central to the hypothesis under investigation here, we adopted a reduced model that selected actions based on state-action Values encoded by the critic module (Holroyd and Coles, 2008). The model includes units that represent important task states, namely external stimuli, stimulus–response conjunctions, and feedback stimuli, which activate when the corresponding event occurs on a given trial. Further, connection weights associated with each unit represent the internal “Value” of that state. For the PLT simulation, the Values associated with positive and negative feedback were fixed at 1 and −1, respectively, and for the EFT simulation, the Values associated with the correct and incorrect stimulus–response conjunctions were fixed at 1 and −1, respectively. For both simulations, the weights for the remaining stimuli were internalized with random values between −0.5 and 0.5. Critically, the strength of the phasic dopamine signal was related to the magnitude of the reward prediction error (i.e., the “temporal difference error”), defined as the change in Value associated with state transitions (Sutton, 1988). The RPE was used to modify the Value weights according to the temporal difference learning rule (Sutton, 1988; Sutton and Barto, 1998). Consistent with previous simulations (Holroyd and Coles, 2002, 2008; Nieuwenhuis et al., 2002) and with empirical practice (Holroyd and Coles, 2002; Holroyd and Krigolson, 2007), the simulated ERN was determined by subtracting the RPE on correct trials from the RPE on error trials. For all simulations response selection was “epsilon-greedy” (Sutton and Barto, 1998), meaning that the model chose the response with the highest Value on a fraction of randomly selected trials (70%) and chose a response at random on the remaining trials (30%). The learning rate parameter for the simulated control subjects was equal to 0.5.
Results
Probabilistic learning task. The PLT is a trial-and-error learning task where participants are required to press one of two buttons on each trial in response to presentation of an arbitrary visual image and are provided feedback indicating that they received or were penalized a small amount of money. Key to the task is that the imperative stimuli are probabilistically related to the appropriate response. Here we simulated the data of Morris et al. (2008), wherein the optimal response was associated with reward on either 100, 80, or 50% of encounters with the associated stimulus (See also Nieuwenhuis et al., 2002). The demographic and clinical characteristics of the participants were highly similar to those of the participants in the current study. The empirical accuracies for the control participants and for participants with schizophrenia are presented in Table 3. Note that the accuracies for the two groups are comparable, as are the accuracies for all of the simulations.
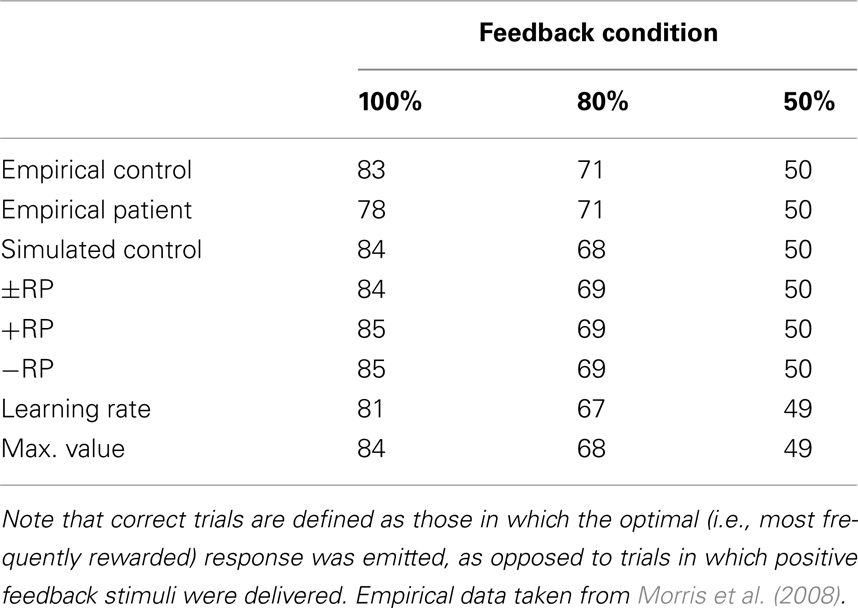
Table 3. Empirical and simulated accuracy rates for control subjects and schizophrenia patients on the probabilistic learning task.
For the purposes of the computational modeling, we have re-analyzed the data of Morris et al. (2008) using a difference wave approach. Figure 6 illustrates the ERN difference wave data for the control participants and for participants with schizophrenia. These results replicate the common finding that the response ERN and feedback ERN amplitude are inversely related such that they are larger and smaller, respectively, with increasing certainty of the outcome (Holroyd and Coles, 2002; Nieuwenhuis et al., 2002, 2005). Although a Group × Feedback type ANOVA did not show any main effects or interactions involving group, these data suggest that this inverse relationship was stronger for the control participants than for the participants with schizophrenia, who exhibited relatively less variation in ERN amplitude across conditions. To examine this more closely, we applied separate linear regressions to each individual’s response ERN and feedback ERN data, with conditions entered in the order of smallest to largest ERN (response ERN: 50%, 80%, 100%; feedback ERN: 100%, 80%v, 50%, 80%i). A two-way ANOVA on the regression intercepts, with levels for group (controls, schizophrenia patients) and ERN type (response, feedback), indicated a main effect for group, F(1, 51) = 5.8, p = 0.02, such that the regression intercepts were more negative for the participants with schizophrenia than for the control participants. This observation was supported by a comparable ANOVA on the regression slopes that indicated a strong trend for a main effect of group, F(1, 51) = 3.7, p = 0.06, such that the regression slopes were smaller for the people with schizophrenia than for the control subjects. These findings confirm the visual impression in Figure 6 that the ERN amplitudes of the participants with schizophrenia were relatively insensitive to condition, leading relatively negative intercepts and shallower slopes for the patient group. Because the RL–ERN theory is mainly concerned with the inverse relationship between the amplitudes of the response ERN and feedback ERN across conditions (Holroyd and Coles, 2002), our modeling efforts focused on accounting for the blunting of this relationship in the patient data.
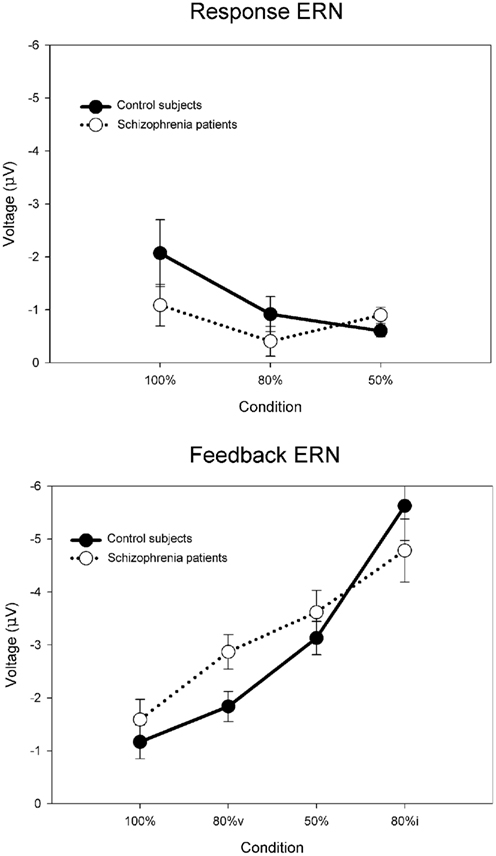
Figure 6. Empirical control and schizophrenia ERN difference wave data (mean amplitude and SE) for the probabilistic learning task, for the response ERN (top) and feedback ERN (bottom). Note that “80%v” and “80%i” correspond to trials in the 80% condition with either valid or invalid feedback, respectively. Data recorded at FCz and re-analyzed from Morris et al. (2008).
Each simulation consisted of 27 runs of four blocks of 300 trials of the PLT, with each run corresponding to a simulated “participant.” For the control simulation, the default parameters reproduced the inverse relationship between the response and feedback ERN amplitudes (solid lines in Figure 7) typically observed in this task (Holroyd and Coles, 2002; Nieuwenhuis et al., 2002, 2005). To evaluate the RPE vs. predictive Value theories of schizophrenia, we followed a hypothesis-driven approach in which we explored how plausible changes to specific model parameters would affect behavior and the ERN (see, e.g., Nieuwenhuis et al., 2002). Each hypothesis was explored by utilizing the parameters of the control simulation and scaling the size of a parameter that implemented the hypothesis above and below its default value. This was achieved by alternatively increasing and decreasing the size of the parameter of interest in increments of 1% from 0 to 200% relative to the parameter value for the control simulation. For example, we first explored the hypothesis that schizophrenia is associated with faulty phasic dopamine signals (e.g., Frank, 2008; Fletcher and Frith, 2009) that have been posited to be either larger or smaller in schizophrenia relative to the normal population (Bilder et al., 2004). To do so, we reran the model through multiple iterations that systematically increased the size of the RPE from 0 to twice its default value in the control simulation. The iteration with the parameter value that produced the best fit to the patient electrophysiological data was then taken as the model that best accounted for the hypothesis, e.g., if the patient data were best fit by a model with a RPE signal reduced by 25% of its default (control) value. Then, this procedure was repeated for the subsequent hypothesis, for example, by systematically manipulating the maximum possible size of the predictive Values from very small (0) to very large (200% normal), and so on. Multiple sets of simulations were run in this way to investigate related hypothesis (disrupted positive and negative RPEs, disrupted negative RPEs only, disrupted positive RPEs only, normal RPEs with disrupted learning rate, etc.). Critically, each hypothesis was explored by changing only a single parameter while the remaining parameters remained fixed to those of the control simulation, so multiple parameters were never simultaneously varied within a single simulation; this practice addresses the degrees of freedom problem that is sometimes leveled at the computational modeling approach (O’Reilly and Farah, 1999).
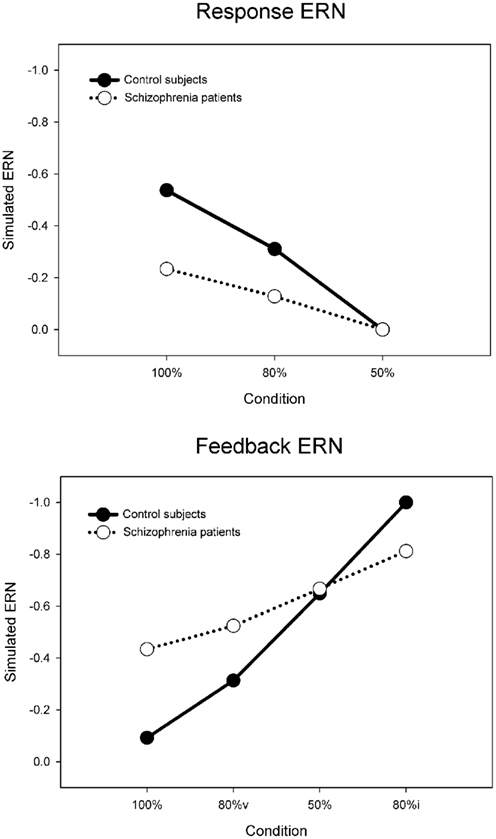
Figure 7. Simulated control (default model) and schizophrenia (maximum value model) ERN difference wave data for the probabilistic learning task, for the response ERN (top) and feedback ERN (bottom). Note that “80%v” and “80%i” correspond to 80% condition trials with either valid or invalid feedback, respectively.
The sum of squared errors (SSE) between the simulated and empirical schizophrenia ERN data was used to evaluate the fit of each simulation (Figure 8). In Figure 8, note that the horizontal dashed line at SSE = 0.14 indicates the error value associated with the control simulation compared to the empirical control data, whereas the horizontal dotted line at SSE = 0.36 indicates the error value associated with the control simulation compared to the empirical schizophrenia data; values below the dotted line indicate improvements in model fit to the schizophrenia data and values below the dashed line indicate that the fit of the schizophrenia model to the schizophrenia data is even better than that of the control model to the control data. Further, note that parameter values of 100% correspond to those of the control simulation, thus the SSEs for each set of simulations cross the dotted line at parameter values of 100%. In other words, because each of the schizophrenia simulations is the same as the control simulation except for the value of one parameter, when that one parameter is in fact the same as that of the control simulation (100%), then the schizophrenia simulation is identical to the control simulation. In that case, the SSE of the schizophrenia model is the same as that of the control model when fit to the empirical schizophrenia data, i.e., SSE = 0.36. Finally, note that for the purpose of comparison the empirical and simulated data were normalized between values of 0 and −1, where the smallest value combined across control and schizophrenic groups was equal to zero and the largest negative value was set equal to −1.
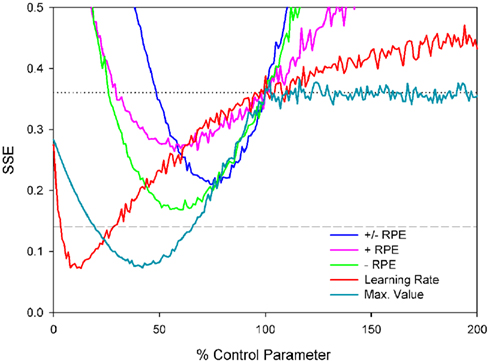
Figure 8. Sum of squared errors (SSE) for each of the probabilistic learning task simulations. Note that the horizontal dashed line at SSE = 0.14 indicates the error value associated with the control simulation compared to the empirical control data and the horizontal gray dotted line at SSE = 0.36 indicates the SSE of the control simulation data compared to the empirical schizophrenia data; values below this line indicate better fits.
We first examined the basic hypothesis that schizophrenia would be associated with an abnormal ERN resulting from a disturbed dopamine/RPE signal. As described above, we scaled the size of RPE signal from 0 to 200% of the control simulation values (Figure 8, blue line). The best fit corresponded to RPE sizes that were 75% of normal (SSE = 0.21), producing simulated ERN amplitudes shown in Figure 9 (blue lines, which for the feedback ERN plot is hidden by the pink and green lines). These ERN values are relatively inconsistent with the empirical schizophrenia data (Figure 9, black dotted lines) as they reflect less than a 50% reduction in the SSE of the control simulation relative to the schizophrenia data (Figure 8, gray dotted line), as well as a fit that was worse than the control simulation to the control data (Figure 8, gray dashed line). We also investigated whether schizophrenia might impact either the positive or negative RPE signal independently of the other by varying each while holding the other constant. Both sets of simulations were associated with optimal parameter values of 60%, but the reduced negative RPEs (green lines in Figures 8 and 9) produced better fits (SSE = 0.17) than the reduced positive RPE (pink lines in Figures 8 and 9) did (SSE = 0.26). We also explored whether changes to the positive and negative RPE signals might be inversely related such that an increase to one was associated with a commensurate decrease to the other. The best fit was associated with an SSE of 0.26 (data not shown).
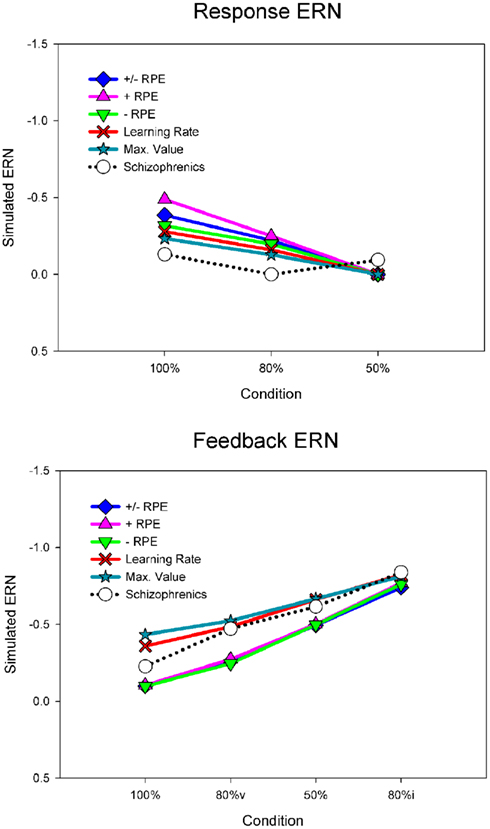
Figure 9. Error-related negativity difference wave data for the probabilistic learning task, for the response ERN (top) and feedback ERN (bottom), for the simulated and empirical schizophrenia data. Note that “80%v” and “80%i” correspond to 80% condition trials with either valid or invalid feedback, respectively. Empirical data are from FCz.
Although reducing the negative RPEs to 60% of normal yielded a better fit to the empirical schizophrenia data than did the other parameter changes, inspection of Figure 9 suggests that this result is also sub-optimal. The problem stems from the fact that for the empirical data the response ERN in the 100 and 80% conditions is smaller for the patients than for the control participants, but the feedback ERN in the 50% condition is as large or larger for the patients than for the controls (Figure 6). Importantly, because the feedback stimuli in the 50% condition are unpredictable, the feedback ERN in this condition reflects the “true” feedback ERN amplitude free from any learning-related changes. Taken together, these results suggest that whereas the feedback ERN for the patients is relatively normal (as inferred from the 50% condition), the response ERN is reduced (as inferred from the other conditions). By contrast, scaling the RPE produces a main effect on ERN amplitude: Increases and decreases in RPE size result, respectively, in increases and decreases in both the response ERN and feedback ERN amplitudes. Thus these results reflect the optimal solution to the competing constraints of minimizing response ERN amplitude while maximizing feedback ERN amplitude.
We next explored the related possibility that even if the phasic dopamine signal were intact, the neural targets of the dopamine system might nevertheless be insensitive to the signal. To investigate this possibility, we systematically varied the size of the model learning rate parameter from 0 to 200% of normal. Note that in terms of the impact on behavior, scaling the learning rate is formally equivalent to scaling the RPE as the change in Value is proportional to the learning rate times the RPE (see, e.g., Cockburn and Holroyd, 2010). However, ERN amplitude is hypothesized to be related to the size of the RPE rather than to the learning rate (Holroyd and Coles, 2002). Thus this manipulation dissociates indirect changes to ERN amplitude as a consequence of learning vs. direct changes to ERN amplitude as a consequence of the RPE signal itself. Figure 8 (red line) illustrates that the optimal solution (SSE = 0.07) was associated with a learning rate that was only 13% of the control value. Unlike the previous simulations, this simulation substantially reduced response ERN amplitudes while maintaining high feedback ERN amplitudes (Figure 9, red lines). In this case the reduced learning rate impaired the ability of the model to develop strong predictions of trial outcomes, leading to reduced response ERNs and large feedback ERNs that were relatively insensitive to outcome probability.
Finally, we explored the alternative hypothesis that schizophrenia is characterized by a deficit in the representation of the predictive value of response options (Gold et al., 2008; Krawitz et al., 2011). According to this idea, both the dopamine/RPE signal and the impact of this signal on behavior (i.e., the learning rate) are normal in schizophrenia. Rather, this position holds that schizophrenia compromises the ability to represent the value of different response options for a given imperative stimulus. To explore this possibility, the Values associated with stimulus–response conjunctions in the model, as putatively implemented as a neural target of the DA system in the basal ganglia (Samejima et al., 2005; Lau and Glimcher, 2008), were capped at a maximum. Thus, for these simulations the RPE (dopamine/ERN signal) and the learning rate were unchanged from the control simulation but the stimulus–response conjunction Values were prevented from exceeding the maximum. Figure 8 (cyan line) illustrates the simulation SSEs when the maximum stimulus–response conjunction Value was systematically varied from 0 to 200% of normal. As can be seen, the simulations were insensitive to increases in the maximum value beyond 100% of normal because the control simulation levels never exceed this range anyway. By contrast, capping the maximum stimulus–response conjunction value at 38% of normal yielded an optimal solution with SSE = 0.08, nearly equivalent to the best SSE associated with the learning rate simulations (Figure 8, red line), resulting in similar fashion with relatively small response ERNs and large feedback ERNs that are insensitive to condition (Figure 9, cyan lines). A plot of these ERN amplitudes with the simulated control ERN amplitudes (Figure 7) reproduces in a qualitative manner the key relationships observed in the empirical data shown in Figure 6, namely more negative intercepts and shallower slopes for the simulated patient data relative to the simulated control data (when the response ERN and feedback ERN amplitudes are ordered from smallest to largest).
Flanker Task. The above simulations suggest two possibilities: First, that schizophrenia may be associated with a reduced RPE learning rate, and second, that schizophrenia may be characterized by weak representation of the predictive value of stimulus–response conjunctions. Here we simulated ERN amplitudes on the EFT to decide between these two possibilities. For consistency with the PLT simulation and to ensure a high signal-to-noise ratio, we simulated the data of 27 control participants and 27 participants with schizophrenia engaged in the EFT (as opposed to the actual numbers in the empirical experiment, which were 20 and 14, respectively). Imperative stimuli consisted of 54 encounters with each of the six flanker stimuli and no feedback was provided. Interference effects on accuracy and response time induced by the presence of the incompatible flanker stimuli (Eriksen and Eriksen, 1974) were not simulated as these were not central to the hypothesis under investigation (cf. Holroyd et al., 2005). We conducted three simulations: For the first simulation the parameter values were identical to those of the control simulation in the PLT, for the second simulation the learning rate was reduced to its optimal value for the schizophrenia simulation of the PLT (i.e., 13% of that of the control simulation), and for the third simulation the response value was reduced to its optimal value for the schizophrenia simulation of the PLT (i.e., 38% of the control simulation). All other parameter values were held equivalent across simulations. In other words, we explored whether the two optimal models of the PLT schizophrenia data could, without any changes, also account for the EFT schizophrenia data. Note that the same parameter values were used as in the corresponding PLT simulations, but in contrast to the PLT simulations no parameter searches were conducted. This procedure allowed for an unbiased examination of whether the results of the PLT simulations would generalize to the EFT data.
Figure 10 illustrates the simulation results. As is evident by inspection, reducing the learning rate to 13% of normal did not reduce the simulated response ERN whereas capping the maximum value of stimulus–response conjunctions at 38% of normal induced a commensurate reduction in response ERN amplitude. These results follow for the simple reason that the EFT is not a learning task and so manipulating the learning rate does not affect ERN amplitude. By contrast, capping the stimulus–response conjunction Values at a low level leads to an immediate deficit in response ERN production irrespective of whether the tasks involves feedback or not. These results indicate that a single parameter change to the maximum size of the stimulus–response conjunction Value accounts for the empirical schizophrenia data for both the PLT and the EFT better than competing models involving changes to the RPE signal or the impact of this signal on behavior.
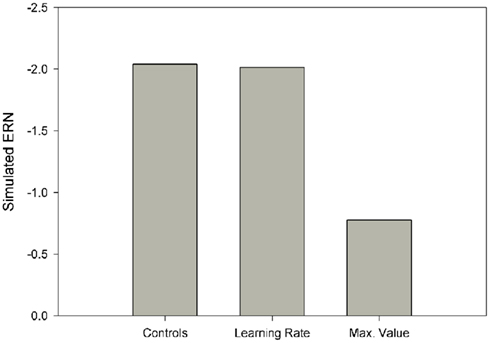
Figure 10. Simulated response ERNs for the Eriksen flanker task.
Discussion
Recent empirical and theoretical advances in our understanding about the role of phasic dopamine in schizophrenia have informed contrasting models of the illness which focus on disruption of the RPE signal (Corlett et al., 2007; Frank, 2008; Fletcher and Frith, 2009) and impairment in the representation of response value (Gold et al., 2008). In order to examine these hypotheses, we administered two tasks that elicit the feedback ERN and one that elicits the response ERN, re-analyzed data from a previous study involving both types of ERN, and used a computational instantiation of the RL–ERN theory to aid the interpretation of the empirical results. Taken together, these data show that the feedback ERN is intact in schizophrenia patients despite abnormalities in the response ERN. It should be noted that the tasks used by our group to elicit the feedback ERN include a range of response–feedback contingencies but regardless of whether the outcomes were determined by handedness of response, accuracy of time estimation or were independent of responding, schizophrenia patients generated feedback negativities that were similar in amplitude to those of control subjects. The tasks used to elicit the feedback ERN included sufficient trials to obtain a reliable feedback ERN component and the reduction in response ERN was detected despite a smaller sample of patients completing this task.
We used computational modeling to examine the hypothesis that the locus of patients’ difficulties is in the evaluation of response options rather than feedback processing. Our simulations did indeed suggest that the functioning of the system is selectively disrupted due to weakened representation of response values, presumably encoded in the basal ganglia and orbitofrontal cortex (Gold et al., 2008). The rationale for this conclusion is as follows: Our empirical findings indicate that in schizophrenia the feedback ERN is relatively normal whereas the response ERN is reduced relative to controls. Because manipulations of the dopamine/RPE parameter alter the size of both the response ERN and the feedback ERN concomitantly, these simulations cannot satisfy both of these constraints in the schizophrenia data simultaneously. Further, although reducing the learning rate yields both a reduced response ERN together with a normal feedback ERN, this result occurs only for tasks that actually involve feedback-based learning. By contrast, impairment in the representation of response value leads to smaller response ERNs irrespective of whether the task involves feedback or not.
Thus, according to the model, patients are impaired at associating predictions of future outcomes with particular response options. This result is consistent with the conclusion of Gold et al. (2008) that decision making in patients is compromised by deficits in their ability to represent fully the value of different response options and stimuli predictive of outcomes and with recent fMRI data indicating that schizophrenia patients have difficulty predicting response–outcome associations (Krawitz et al., 2011). The results of this previous study and our present findings converge in that patients’ difficulty in predicting response–outcome associations occurs in the presence of spared outcome monitoring. The Krawitz et al. (2011) study, however, did not rule out the possibility that patients’ impaired predictions resulted from impaired learning because of a faulty evaluation mechanism. By contrast, our empirical and simulated data indicate that outcome processing is normal in schizophrenia, and thus the impairment lies with the predictive mechanism. This conclusion is also bolstered by a recent report from Gold et al. (in press) that combined behavioral and computational modeling to show that patients were able to use prediction errors to guide learning, but failed to prefer stimuli previously associated with gains over those associated with successful loss avoidance. The gain seeking vs. loss avoidance stimuli were presented at the same probabilistic levels and thus were learned by the same frequency of positive and negative prediction errors. Despite that, patients failed to prefer the gain seeking stimulus suggesting that the deficit appears to be specific to weighing the expected value of alternatives at the time of decision, rather than in processing outcomes per se. This formulation would suggest that patients are likely to display alterations in a host of decision making contexts where the relative prospective value of different stimuli and response alternatives must be weighed. Indeed, there is evidence that this is the case as seen in studies of delay discounting (Heerey et al., 2007, 2011) and in the demonstration of reduced transitivity of preferences (Strauss et al., 2011).
Furthermore, impaired response selection in schizophrenia has been associated with increased response times (Luck et al., 2009). Although we did not simulate response times here, previous reinforcement learning models have related response times to the strength of response values (e.g., Suri et al., 2001; Frank et al., 2007). We suggest that the decreased response values implicated by our simulations may also give rise to the increased response times observed in schizophrenia as the system takes longer to decide the appropriate course of action, a direction for future research.
The results of neuroimaging studies of RPEs in schizophrenia are mixed with regard to group differences observed following +RPEs and −RPEs. Koch et al. (2010) found that chronic schizophrenia patients showed relative hypoactivation of frontal areas following positive PEs on a PLT. Waltz et al. (2009), using a primary reinforcer, found diminished hemodynamic response in reward-related circuits following positive RPEs. In two studies (Murray et al., 2008; Koch et al., 2010), schizophrenia patients exhibited significant hypoactivation compared to control subjects following negative RPEs but in other studies (Waltz et al., 2009; Simon et al., 2010) activation following negative RPEs did not differ between patients and healthy comparison subjects. The conflicting results between our findings of normal feedback ERN in schizophrenia and these reports of diminished reward-related activation in schizophrenia are possibly a result of differences among experimental tasks and the inherent difficulty in comparing findings obtained using hemodynamic and electrophysiological methods with their differences in temporal scale and localization properties (Logothetis, 2003). Our empirical and modeling data suggest that future work examining the intersection of stimulus and response would be a fruitful path forward for resolving some remaining questions about the source of the reward processing deficit in schizophrenia.
On the passive gambling task, difference wave peak amplitude was larger following unexpected compared to expected outcomes. The effect of expectedness was not significant, however. This may be because passive guessing tasks which do not require a response produce expectancy effects on feedback ERN amplitude with smaller effect sizes (Holroyd et al., 2009). Other differences in study procedures compared to the Potts et al. (2006) study, including the amount of the bonus and the long duration of our testing session may also have contributed to the reduced expectancy effects in our data.
Consistent with patients’ intact feedback ERN, the behavioral data from the time estimation paradigm suggest that patients did effectively make use of negative feedback to improve their subsequent responses. Patients’ neural and behavioral sensitivity to negative feedback was surprising in light of substantial evidence of poor incorporation of feedback on a wide range of behavioral tasks, including the Wisconsin Card Sorting Task (e.g., Bryson et al., 2001; Nieuwenstein et al., 2001; Prentice et al., 2008) and the probabilistic weather prediction task (e.g., Weickert et al., 2002; Horan et al., 2008). In contrast to this apparently intact use of negative feedback, patients exhibited impaired ability to sustain accurate responding following positive feedback during this task. Similar difficulty in adjusting behavior following positive outcomes has been observed in studies using probabilistic selection (Waltz et al., 2007), reversal learning (Weiler et al., 2009), and cued reinforcement (Murray et al., 2008) tasks. This pattern is consistent with the clinical impression that many schizophrenia patients are successful at learning to avoid punishment but do not seek out rewarding activities. Much of the existing ERP literature has focused on the brain’s response to negative outcomes, so the ongoing study of neural and behavioral sensitivity to positive feedback holds promise for understanding schizophrenia patients’ responsiveness to environmental contingencies.
All of the patient participants in this study were taking APM, so it is important to consider the possible effects of these medications on the DA system and on the results of this study. The results of prior work examining the impact of APM on the ERN are mixed. Acute administration of haloperidol (Zirnheld et al., 2004; de Bruijn et al., 2006) and olanzapine (de Bruijn et al., 2006) to healthy participants diminishes ERN amplitude; however, Kopp and Rist (1999) found that medication dose was unrelated to ERN amplitude in schizophrenia patients and Bates et al. (2004) found that schizophrenia patients’ ERNs increased in amplitude following hospital admission and clinical stabilization (presumably involving optimization of APM). Similarly, ACC activity during a response competition task normalized in medication-naïve schizophrenia patients after treatment with atypical APM (Snitz et al., 2005). Functional MRI studies suggest that medication effects on reward-related activity vary depending on the class of APM and the phase of reward processing. Ventral striatal activity in schizophrenia patients taking atypical APMs, but not those taking typical APMs, does not differ from controls during reward anticipation (Juckel et al., 2006; Schlagenhauf et al., 2008). Patients taking typical APMs showed less ventral striatal activity than patients taking atypical APMs during reward anticipation but not following reward receipt (Kirsch et al., 2007). In the current study, it is unlikely that APM caused the feedback ERN to be normalized in schizophrenia since the response ERN was reduced in these patients, although it is arguable that the dissociation that we have documented suggests that APM could have a differential effect on the feedback and response ERN. Alternatively, it is possible that APM does indeed normalize the functioning of the DA system and the mechanisms that generate the error-related ERPs but, as described above, the input into that system (the stimulus–response values) is weak, causing the system to be responsive to external stimuli (feedback) but not internal stimuli.
Our empirical data and modeling results suggest that schizophrenia patients have a deficit in representing the value of actions to be taken in the context of stimuli that offer some type of outcome. Our findings are consistent with Feinberg’s (1978) prescient observation that some symptoms of schizophrenia may arise from disturbed efference copy, a duplicate motor command signal used for the purpose of action monitoring (Angel, 1976). This concept has since been refined into computationally specific theories of motor control and their disruption in schizophrenia (e.g., Frith and Done, 1988; Frith et al., 2000). Evidence for this impairment consisted at first of behavioral data indicating abnormal error correction (Malenka et al., 1982, 1986; Frith and Done, 1989) and later of electrophysiological data indicating a reduced response ERN (Kopp and Rist, 1999; Alain et al., 2002; Mathalon et al., 2002; Bates et al., 2004; Morris et al., 2006, 2008) in this population, both of which appear to depend on a neural mechanism for evaluating internally generated motor signals (e.g., Rabbitt, 1966; Gehring et al., 1993; Allain et al., 2004). Our data do not distinguish between a reduction of ERN amplitude in schizophrenia due directly to a weakened representation of response value or indirectly to impaired efference copy giving rise to abnormal valuation. Either way, our results demonstrate that this monitoring impairment is in fact limited to internal sources of performance information and does not extend to external sources of information. Further, our computational modeling of these findings suggests that the impairment may reflect a specific inability to attribute values to behavior – that is, whether a response is “good” or “bad” – and to utilize that information to guide action selection for a specific end (Gold et al., 2008).
Conflict of Interest Statement
The authors declare that the research was conducted in the absence of any commercial or financial relationships that could be construed as a potential conflict of interest.
Acknowledgments
This work was supported by the Department of Veterans Affairs Rehabilitation Research and Development Service (grant number D6064W to Sarah E. Morris); and the National Institute of Mental Health (grant numbers 1R01 MH080066, 1R24 MH72647 to James M. Gold).
References
Alain, C., McNeely, H. E., He, Y., Christensen, B. L., and West, R. (2002). Neurophysiological evidence of error-monitoring deficits in patients with schizophrenia. Cereb. Cortex 12, 840–846.
Allain, S., Hasbroucq, T., Burle, B., Grapperon, J., and Vidal, F. (2004). Response monitoring without sensory feedback. Clin. Neurophysiol. 115, 2014–2020.
Andreasen, N. (1982). The Scale for the Assessment of Negative Symptoms (SANS). Iowa City: University of Iowa.
Baker, T. E., and Holroyd, C. B. (2011). Dissociated roles of the anterior cingulate cortex in reward and conflict processing as revealed by the feedback error-related negativity and N200. Biol. Psychol. 87, 25–34.
Bates, A. T., Kiehl, K. A., Laurens, K. R., and Liddle, P. F. (2002). Error-related negativity and correct response negativity in schizophrenia. Clin. Neurophysiol. 113, 1454–1463.
Bates, A. T., Liddle, P. F., Kiehl, K. A., and Ngan, E. T. C. (2004). State dependent changes in error monitoring in schizophrenia. J. Psychiatr. Res. 38, 347–356.
Bilder, R. M., Volavka, J., Lachman, H. M., and Grace, A. A. (2004). The catechol-O-methyltransferase polymorphism: relations to the tonic-phasic dopamine hypothesis and neuropsychiatric phenotypes. Neuropsychopharmacology 29, 1943–1961.
Bryson, G., Whelahan, H., and Bell, M. (2001). Memory and executive function impairments in deficit syndrome schizophrenia. Psychiatry Res. 102, 29–37.
Cockburn, J., and Holroyd, C. B. (2010). Focus on the positive: computational simulations implicate asymmetrical reward prediction error signals in childhood attention-deficit/ hyperactivity disorder. Brain Res. 1365, 18–34.
Cohen, M. X. (2008). Neurocomputational mechanisms of reinforcement-guided learning in humans: a review. Cogn. Affect. Behav. Neurosci. 8, 113–125.
Cohen, M. X., Elger, C. E., and Ranganath, C. (2007). Reward expectation modulates feedback-related negativity and EEG spectra. Neuroimage 35, 968–978.
Cohen, M. X., and Frank, M. J. (2009). Neurocomputational models of basal ganglia function in learning, memory and choice. Behav. Brain Res. 199, 141–156.
Corlett, P. R., Honey, G. D., Aitken, M. R. F., Dickinson, A., Shanks, D. R., Absalom, A. R., Lee, M., Pomarol-Clotet, E., Murray, G. K., McKenna, P. J., Robbins, T. W., Bullmore, E. T., and Fletcher, P. C. (2006). Frontal responses during learning predict vulnerability to the psychotogenic effects of ketamine: linking cognition, brain activity, and psychosis. Arch. Gen. Psychiatry 63, 611–621.
Corlett, P. R., Honey, G. D., and Fletcher, P. C. (2007). From prediction error to psychosis: ketamine as a pharmacological model of delusions. J. Psychopharmacol. 21, 238–252.
Davis, K. L. K., Rene, S., Ko, G., and Davidson, M. (1991). Dopamine in schizophrenia: a review and reconceptualization. Am. J. Psychiatry 148, 1474–1486.
Dayan, P., and Daw, N. D. (2008). Decision theory, reinforcement learning, and the brain. Cogn. Affect. Behav. Neurosci. 8, 429–453.
de Bruijn, E., Sabbe, B., Hulstijn, W., Ruigt, G., and Verkes, R. (2006). Effects of antipsychotic and antidepressant drugs on action monitoring in healthy volunteers. Brain Res. 1105, 122–129.
Eppinger, B., Kray, J., Mock, B., and Mecklinger, A. (2008). Better or worse than expected? Aging, learning, and the ERN. Neuropsychologia 46, 521–539.
Eriksen, B. A., and Eriksen, C. W. (1974). Effects of noise letters upon the identification of a target letter in a nonsearch task. Percept. Psychophys. 16, 143–149.
Falkenstein, M. (1990). “Effects of errors in choice reaction tasks on the ERP under focused and divided attention,” in Psychophysiological Brain Research, eds C. K. Brunia, A. Gaillard, and A. Kok (Tilburg: Tilburg University Press), 192–195.
Feinberg, I. (1978). Efference copy and corollary discharge: implications for thinking and its disorders. Schizophr. Bull. 4, 636–640.
First, M., Spitzer, R., Gibbon, M., and Williams, J. (1994). Structured Clinical Interview for Axis I DSM-IV. New York: Biometrics Research Department, New State Psychiatric Institute.
Fletcher, P. C., and Frith, C. D. (2009). Perceiving is believing: a Bayesian approach to explaining the positive symptoms of schizophrenia. Nat. Rev. Neurosci. 10, 48–58.
Frank, M. J. (2008). Schizophrenia: a computational reinforcement learning perspective. Schizophr. Bull. 34, 1008–1011.
Frank, M. J., Samanta, J., Moustafa, A. A., and Sherman, S. J. (2007). Hold your horses: impulsivity, deep brain stimulation, and medication in Parkinsonism. Science 318, 1309–1312.
Frith, C. D., Blakemore, S., and Wolpert, D. M. (2000). Explaining the symptoms of schizophrenia: abnormalities in the awareness of action. Brain Res. Rev. 31, 357–363.
Frith, C. D., and Done, D. J. (1988). Towards a neuropsychology of schizophrenia. Br. J. Psychiatry 153, 437–443.
Frith, C. D., and Done, D. J. (1989). Experiences of alien control in schizophrenia reflect a disorder in the central monitoring of action. Psychol. Med. 19, 359–363.
Gehring, W. J., Goss, B., Coles, M. G., Meyer, D. E., and Donchin, E. (1993). A neural system for error detection and compensation. Psychol. Sci. 4, 385–390.
Gehring, W. J., and Willoughby, A. R. (2002). The medial frontal cortex and the rapid processing of monetary gains and losses. Science 295, 2279–2282.
Gold, J. M., Waltz, J. A., Matveeva, T. M., Kasanova, Z., Strauss, G. P., Herbener, E. S., Collins, A. G. E., and Frank, M. J. (in press). Negative symptoms in schizophrenia result from a failure to represent the expected value of rewards: behavioral and computational modeling evidence. Arch. Gen. Psychiatry.
Gold, J. M., Waltz, J. A., Prentice, K. J., Morris, S. E., and Heerey, E. A. (2008). Reward processing in schizophrenia: a deficit in the representation of value. Schizophr. Bull. 34, 835–847.
Gratton, G., Coles, M. G. H., and Donchin, E. (1983). A new method for off-line removal of ocular artifact. Electroencephalogr. Clin. Neurophysiol. 55, 468–484.
Heerey, E. A., Bell-Warren, K. R., and Gold, J. M. (2008). Decision-making impairments in the context of intact reward sensitivity in schizophrenia. Biol. Psychiatry 64, 62–69.
Heerey, E. A., and Gold, J. M. (2007). Patients with schizophrenia demonstrate dissociation between affective experience and motivated behavior. J. Abnorm. Psychol. 116, 268–278.
Heerey, E. A., Matveeva, T. M., and Gold, J. M. (2011). Imagining the future: degraded representations of future rewards and events in schizophrenia. J. Abnorm. Psychol. 120, 483–489.
Heerey, E. A., Robinson, B. M., McMahon, R. P., and Gold, J. M. (2007). Delay discounting in schizophrenia. Cogn. Neuropsychiatry 12, 213–221.
Holroyd, C. B., and Coles, M. G. (2008). Dorsal anterior cingulate cortex integrates reinforcement history to guide voluntary behavior. Cortex 44, 548–559.
Holroyd, C. B., and Coles, M. G. H. (2002). The neural basis of human error processing: reinforcement learning, dopamine, and the error-related negativity. Psychol. Rev. 109, 679–709.
Holroyd, C. B., Hajcak, G., and Larsen, J. T. (2006). The good, the bad and the neutral: electrophysiological responses to feedback stimuli. Brain Res. 1105, 93–101.
Holroyd, C. B., and Krigolson, O. E. (2007). Reward prediction error signals associated with a modified time estimation task. Psychophysiology 44, 913–917.
Holroyd, C. B., Krigolson, O. E., Baker, R., Lee, S., and Gibson, J. (2009). When is an error not a prediction error? An electrophysiological investigation. Cogn. Affect. Behav. Neurosci. 9, 59–70.
Holroyd, C. B., Krigolson, O. E., and Lee, S. (2011). Reward positivity elicited by predictive cues. Neuroreport 22, 249–252.
Holroyd, C. B., Pakzad-Vaezi, K. L., and Krigolson, O. E. (2008). The feedback correct-related positivity: sensitivity of the event-related brain potential to unexpected positive feedback. Psychophysiology 45, 688–697.
Holroyd, C. B., Yeung, N., Coles, M. G., and Cohen, J. D. (2005). A mechanism for error detection in speeded response time tasks. J. Exp. Psychol. Gen. 134, 163–191.
Horan, W. P., Green, M. F., Knowlton, B. J., Wynn, J. K., Mintz, J., and Nuechterlein, K. H. (2008). Impaired implicit learning in schizophrenia. Neuropsychology 22, 606–617.
Juckel, G., Schlagenhauf, F., Koslowski, M., Filonov, D., Wustenberg, T., Villringer, A., Knutson, B., Kienast, T., Gallinat, J., Wrase, J., and Heinz, A. (2006). Dysfunction of ventral striatal reward prediction in schizophrenic patients treated with typical, not atypical, neuroleptics. Psychopharmacology (Berl.) 187, 222–228.
Kapur, S. (2003). Psychosis as a state of aberrant salience: a framework linking biology, phenomenology, and pharmacology in schizophrenia. Am. J. Psychiatry 160, 13–23.
Kirsch, P., Ronshausen, S., Mier, D., and Gallhofer, B. (2007). The influence of antipsychotic treatment on brain reward system reactivity in schizophrenia patients. Pharmacopsychiatry 40, 196–198.
Koch, K., Schachtzabel, C., Wagner, G., Schikora, J., Schultz, C., Reichenbach, J. R., Sauer, H., and Schlosser, R. G. (2010). Altered activation in association with reward-related trial-and-error learning in patients with schizophrenia. Neuroimage 50, 223–232.
Kopp, B., and Rist, F. (1999). An event-related brain potential substrate of disturbed response monitoring in paranoid schizophrenic patients. J. Abnorm. Psychol. 108, 337–346.
Krawitz, A., Braver, T. S., Barch, D. M., and Brown, J. W. (2011). Impaired error-likelihood prediction in medial prefrontal cortex in schizophrenia. Neuroimage 54, 1506–1517.
Lau, B., and Glimcher, P. W. (2008). Value representations in the primate striatum during matching behavior. Neuron 58, 451–463.
Logothetis, N. K. (2003). The underpinnings of the BOLD functional magnetic resonance imaging signal. J. Neurosci. 23, 3963–3971.
Luck, S. J. (2005). An Introduction to the Event-Related Potential Technique. Cambridge, MA: MIT Press.
Luck, S. J., Kappenman, E. S., Fuller, R. L., Robinson, B., Summerfelt, A., and Gold, J. M. (2009). Impaired response selection in schizophrenia: evidence from the P3 wave and the lateralized readiness potential. Psychophysiology 46, 776–786.
Malenka, R. C., Angel, R. W., Hampton, B., and Berger, P. A. (1982). Impaired central error-correcting behavior in schizophrenia. Arch. Gen. Psychiatry 39, 101–107.
Malenka, R. C., Angel, R. W., Thiemann, S., Weitz, C. J., and Berger, P. A. (1986). Central error-correcting behavior in schizophrenia and depression. Biol. Psychol. 21, 263–273.
Marco-Pallares, J., Cucurell, D., Münte, T. F., Strien, N., and Rodriguez-Fornells, A. (2011). On the number of trials needed for a stable feedback-related negativity. Psychophysiology 48, 852–860.
Mathalon, D. H., Fedor, M., Faustman, W. O., Gray, M., Askari, N., and Ford, J. M. (2002). Response-monitoring dysfunction in schizophrenia: an event-related brain potential study. J. Abnorm. Psychol. 111, 22–41.
Matthysse, S. (1973). Antipsychotic drug actions: a clue to the neuropathology of schizophrenia? Fed. Proc. 32, 200–205.
Miller, G. A., Gratton, G., and Yee, C. M. (1988). Generalized implementation of an eye movement correction procedure. Psychophysiology 25, 241–243.
Miltner, W., Braun, C. H., and Coles, M. G. H. (1997). Event-related brain potentials following incorrect feedback in a time-estimation task: evidence for a generic neural system for error detection. J. Cogn. Neurosci. 9, 788–798.
Montague, P. R., and Sejnowski, T. J. (1994). The predictive brain: temporal coincidence and temporal order in synaptic learning mechanisms. Learn. Mem. 1, 1–33.
Morris, S. E., Heerey, E. A., Gold, J. M., and Holroyd, C. B. (2008). Learning-related changes in brain activity following errors and performance feedback in schizophrenia. Schizophr. Res. 99, 274–285.
Morris, S. E., Yee, C. M., and Nuechterlein, K. H. (2006). Electrophysiological analysis of error monitoring in schizophrenia. J. Abnorm. Psychol. 115, 239–250.
Murray, G. K., Corlett, P. R., Clark, L., Pessiglione, M., Blackwell, A. D., Honey, G., Jones, P. B., Bullmore, E. T., Robbins, T. W., and Fletcher, P. C. (2008). Substantia nigra/ventral tegmental reward prediction error disruption in psychosis. Mol. Psychiatry 13, 267–276.
Nieuwenhuis, S., Nielen, M. M., Mol, N., Hajcak, G., and Veltman, D. J. (2005). Performance monitoring in obsessive-compulsive disorder. Psychiatry Res. 134, 111–122.
Nieuwenhuis, S., Ridderinkhof, K. R., Talsma, D., Coles, M. G. H., Holroyd, C. B., Kok, A., and van der Molen, M. W. (2002). A computational account of altered error processing in older age: dopamine and the error-related negativity. Cogn. Affect. Behav. Neurosci. 2, 19–36.
Nieuwenstein, M. R., Aleman, A., and de Haan, E. H. (2001). Relationship between symptom dimensions and neurocognitive functioning in schizophrenia: a meta-analysis of WCST and CPT studies. J. Psychiatr. Res. 35, 119–125.
O’Doherty, J., Dayan, P., Schultz, J., Deichmann, R., Friston, K., and Dolan, R. J. (2004). Dissociable roles of ventral and dorsal striatum in instrumental conditioning. Science 304, 452–454.
O’Reilly, R. C., and Farah, M. J. (1999). Simulation and explanation in neuropsychology and beyond. Cogn. Neuropsychol. 16, 49–72.
Overall, J. E., and Gorham, D. R. (1962). The brief psychiatric rating scale. Psychol. Rep. 10, 799–812.
Potts, G. F., Martin, L. E., Burton, P., and Montague, P. (2006). When things are better or worse than expected: the medial frontal cortex and the allocation of processing resources. J. Cogn. Neurosci. 18, 1112–1119.
Prentice, K. J., Gold, J. M., and Buchanan, R. W. (2008). The Wisconsin card sorting impairment in schizophrenia is evident in the first four trials. Schizophr. Res. 106, 81–87.
Ruchsow, M., Grothe, J., Spitzer, M., and Kiefer, M. (2002). Human anterior cingulate cortex is activated by negative feedback: evidence from event-related potentials in a guessing task. Neurosci. Lett. 325, 203–206.
Samejima, K., Ueda, Y., Doya, K., and Kimura, M. (2005). Representation of action-specific reward values in the striatum. Science 310, 1337–1340.
Schlagenhauf, F., Juckel, G., Koslowski, M., Kahnt, T., Knutson, B., Dembler, T., Kienast, T., Gallinat, J., Wrase, J., and Heinz, A. (2008). Reward system activation in schizophrenic patients switched from typical neuroleptics to olanzapine. Psychopharmacology (Berl.) 196, 673–684.
Schultz, W., Romo, R., Ljungberg, T., Mirenowicz, J., Hollerman, J. R., and Dickinson, A. (1995). “Reward-related signals carried by dopamine neurons,” in Models of Information Processing in the Basal Ganglia, eds J. Houk, J. Davis, and D. Beiser (Cambridge, MA: MIT Press), 233–248.
Simon, J. J., Biller, A., Walther, S., Roesch-Ely, D., Stippich, C., Weisbrod, M., and Kaiser, S. (2010). Neural correlates of reward processing in schizophrenia – relationship to apathy and depression. Schizophr. Res. 118, 154–161.
Smith, A., Li, M., Becker, S., and Kapur, S. (2006). Dopamine, prediction error and associative learning: a model-based account. Network 17, 61–84.
Snitz, B. E., MacDonald, A. III, Cohen, J. D., Cho, R. Y., Becker, T., and Carter, C. S. (2005). Lateral and medial hypofrontality in first-episode schizophrenia: functional activity in a medication-naive state and effects of short-term atypical antipsychotic treatment. Am. J. Psychiatry 162, 2322–2329.
Strauss, G. P., Robinson, B. M., Waltz, J. A., Frank, M. J., Kasanova, Z., Herbener, E. S., and Gold, J. M. (2011). Patients with schizophrenia demonstrate inconsistent preference judgments for affective and nonaffective stimuli. Schizophr. Bull. 37, 1295–1304.
Suri, R. E. (2002). TD models of reward predictive responses in dopamine neurons. Neural Netw. 15, 523–533.
Suri, R. E., Bargas, J., and Arbib, M. A. (2001). Modeling functions of striatal dopamine modulation in learning and planning. Neuroscience 103, 65–85.
Sutton, R. S. (1988). Learning to predict by the method of temporal differences. Mach. Learn. 3, 9–44.
Sutton, R. S., and Barto, A. G. (1998). Reinforcement Learning: An Introduction. Cambridge, MA: MIT Press.
Ursu, S., Kring, A. M., Gard, M. G., Minzenberg, M. J., Yoon, J. H., Ragland, J. D., Solomon, M., and Carter, C. S. (2011). Prefrontal cortical deficits and impaired cognition-emotion interactions in schizophrenia. Am. J. Psychiatry 168, 276–285.
Waltz, J. A., Frank, M. J., Robinson, B. M., and Gold, J. M. (2007). Selective reinforcement learning deficits in schizophrenia support predictions from computational models of striatal-cortical dysfunction. Biol. Psychiatry 62, 756–764.
Waltz, J. A., Schweitzer, J. B., Gold, J. M., Kurup, P. K., Ross, T. J., Salmeron, B. J., Rose, E. J., McClure, S. M., and Stein, E. A. (2009). Patients with schizophrenia have a reduced neural response to both unpredictable and predictable primary reinforcers. Neuropsychopharmacology 34, 1567–1577.
Weickert, T. W., Terrazas, A., Bigelow, L. B., Malley, J. D., Hyde, T., Egan, M. F., Weinberger, D. R., and Goldberg, T. E. (2002). Habit and skill learning in schizophrenia: evidence of normal striatal processing with abnormal input. Learn. Mem. 9, 430–442.
Weiler, J. A., Bellebaum, C., Brune, M., Juckel, G., and Daum, I. (2009). Impairment of probabilistic reward-based learning in schizophrenia. Neuropsychology 23, 571–580.
Ziauddeen, H., and Murray, G. K. (2010). The relevance of reward pathways for schizophrenia. Curr. Opin. Psychiatry 23, 91–96.
Keywords: schizophrenia, error-related negativity, feedback, reward, dopamine
Citation: Morris SE, Holroyd CB, Mann-Wrobel MC, and Gold JM (2011) Dissociation of response and feedback negativity in schizophrenia: electrophysiological and computational evidence for a deficit in the representation of value. Front. Hum. Neurosci. 5:123. doi: 10.3389/fnhum.2011.00123
Received: 28 July 2011;
Accepted: 10 October 2011;
Published online: 28 October 2011.
Edited by:
Patrizia Thoma, Ruhr-University Bochum, GermanyReviewed by:
Martin Brüne, Ruhr University Bochum, GermanyChristian Bellebaum, Ruhr University Bochum, Germany
Copyright: © 2011 Morris, Holroyd, Mann-Wrobel and Gold. This is an open-access article subject to a non-exclusive license between the authors and Frontiers Media SA, which permits use, distribution and reproduction in other forums, provided the original authors and source are credited and other Frontiers conditions are complied with.
*Correspondence: Sarah E. Morris, Division of Adult Translational Research, National Institute of Mental Health, Room 7107, 6001 Executive Blvd, Bethesda, MD 20892, USA. e-mail: sarah.morris@nih.gov
†Present address: Monica C. Mann-Wrobel, VISN 6 Mental Illness Research, Education, and Clinical Center, Durham VA Medical Center, 508 Fulton Street, Durham, NC 27705, USA.