
- 1 Institute for Biomagnetism and Biosignalanalysis, University of Muenster, Muenster, Germany
- 2 Department of Integrative Physiology, National Institute for Physiological Sciences, Okazaki, Japan
Natural sounds contain complex spectral components, which are temporally modulated as time-varying signals. Recent studies have suggested that the auditory system encodes spectral and temporal sound information differently. However, it remains unresolved how the human brain processes sounds containing both spectral and temporal changes. In the present study, we investigated human auditory evoked responses elicited by spectral, temporal, and spectral–temporal sound changes by means of magnetoencephalography. The auditory evoked responses elicited by the spectral–temporal change were very similar to those elicited by the spectral change, but those elicited by the temporal change were delayed by 30–50 ms and differed from the others in morphology. The results suggest that human brain responses corresponding to spectral sound changes precede those corresponding to temporal sound changes, even when the spectral and temporal changes occur simultaneously.
Introduction
Natural sounds such as bird songs or human speech are complex and time-varying signals. Previous studies have suggested that the perception of such sounds depends on the simultaneous decoding of both fine frequency structures (spectral information) and slowly modulated temporal patterns (temporal information; Deboer and Dreschler, 1987; Eggermont, 1998; Lu et al., 2001; Zatorre and Belin, 2001; Obleser et al., 2008). Interestingly, human auditory perception seems disproportionately driven by these two features, depending on the sound type. Spectral sound information plays a dominant role in perceiving pitch and music, whereas temporal information is more important for speech and melody perception (Houtgast and Steeneke, 1973; Rosen, 1992; Belin et al., 1998; Zatorre et al., 2002; Zatorre and Gandour, 2008). Additionally, recent neuroimaging studies have demonstrated that spectral information processing is functionally lateralized to the right hemisphere, while temporal information is predominantly processed in the left hemisphere (Zatorre and Belin, 2001; Jamison et al., 2006; Okamoto et al., 2009).
Sound waves entering the cochlea cause different parts of the basilar membrane to vibrate in a frequency-dependent manner, and thereby spectral sound information is systematically translated into a place code (cochleotopy or tonotopy; Robles and Ruggero, 2001). This place coding is maintained throughout the central auditory pathway (Reale and Imig, 1980; Schreiner and Langner, 1988). Previous magnetoencephalography (MEG; Romani et al., 1982; Pantev et al., 1988, 1996), functional MRI (Wessinger et al., 1997; Bilecen et al., 1998), and positron emission tomography (Lauter et al., 1985) based studies have demonstrated tonotopic maps in the human auditory cortex. Additionally, in cats, at the level of the auditory nerve, for frequencies of up to 3–4 kHz the fine-structure of auditory signals (spectral information) is also precisely represented by the firing patterns of nerve fibers; Johnson, 1980). However, the synchronized firing patterns of primary auditory cortex neurons no longer accurately represent this spectral fine-structure (Joris et al., 2004). Therefore, it is reasonable to assume that the spectral fine-structure is not coded by the firing patterns of neurons in the human auditory cortex.
In contrast to spectral information processing, slowly modulated temporal patterns are not translated into a place code in the cochlea. Rather, this information is coded into slowly modulated, temporally synchronized activation patterns of auditory nerve fibers (Joris and Yin, 1992). This slowly modulated temporal sound information is represented also in the primary auditory cortex by synchronized spike timing (Eggermont, 1994; Liang et al., 2002; Joris et al., 2004). Recent studies (Bendor and Wang, 2007; Wang et al., 2008) in monkeys showed that in cortical fields rostral to the primary auditory cortex, slow sound wave modulations are represented by a monotonic rate code without stimulus-synchronized neural discharges, suggesting that the temporal sound information is both processed and recoded by auditory cortical neurons.
Under natural circumstances, spectral and temporal changes usually co-occur. Spectral–temporal receptive fields in the auditory pathways have been recorded in cats (Miller et al., 2002; Atencio and Schreiner, 2008), mice (Linden et al., 2003), and zebra finches (Theunissen et al., 2000; Woolley et al., 2005). Until now, studies investigating sound decoding in the human auditory cortex have mainly focused on neural activity elicited by either solely spectral or solely temporal sound pattern changes. Mäkelä et al. (1987) investigated adaptation effects of spectral and temporal modulations on the N1m response by means of MEG. The results demonstrated that pairs of the same modulation caused reduced and delayed N1m responses. The findings suggested that the neural mechanisms underlying spectral and temporal sound processing differ in the human auditory cortex. Recently, Altmann et al. (2010) investigated adaptation effects of spectral and/or temporal envelopes of natural sounds in the human auditory cortex by means of functional MRI. The results showed that encoding of the spectrotemporal features takes place in the non-primary auditory cortex. However, it still remains unclear how the human brain deals with spectral change (SC), temporal change (TC), as well as combinations of the two. Notably, it is known that sound transitions can elicit auditory evoked responses (Mäkelä et al., 1988; Martin and Boothroyd, 2000). In the present study, we have investigated auditory evoked neural activity time-locked to spectral, temporal, or spectral–temporal changes by means of MEG.
Materials and Methods
Subjects
Fifteen healthy subjects participated in experiment 1 (seven females; 22–29 years), and 14 healthy subjects participated in experiment 2 (eight females; 23–29 years). All participants were right-handed (assessed via the “Edinburgh Handedness Inventory”; Oldfield, 1971), and had no history of psychological and otorhinolaryngological disorders. All participants gave written informed consent in accordance with procedures approved by the Ethics Commission of the Medical Faculty, University of Muenster.
Stimuli and Experimental Design
Experiment 1 (tonal stimuli)
We used tonal test stimuli (TS) with a duration of 1600 ms, as in our previous study (Okamoto et al., 2009). The TS were composed of two parts, each having a duration of 800 ms: 500 Hz (PT500) or 2000 Hz (PT2000) pure tones with 12.5 ms rise and fall times, and 40 Hz fully amplitude-modulated (AM) tones with a carrier frequency of 500 Hz (AM500) or 2000 Hz (AM2000). Combinations of two of these stimuli resulted in three conditions: SC, TC, or spectral–temporal change (STC; Figure 1). The SC condition was characterized by a carrier frequency change, which occurred at the middle of the TS. The first part of the TS had a 12.5-ms sigmoid offset ramp starting at a latency of 787.5 ms, and the second part, which was characterized by a different carrier frequency but the same slow temporal modulation pattern, had a 12.5-ms sigmoid onset ramp starting at a latency of 787.5 ms. Thus, the carrier frequency of the TS changed between 787.5 and 800 ms after the TS-onset, but the slow temporal modulation pattern remained constant. On the other hand, in the TC condition, a modulation pattern change started at a latency of 787.5 ms, and ended at a latency of 800 ms, while the carrier frequency remained constant. In the STC condition, the carrier frequency and the temporal pattern changed at the same time, between 787.5 and 800 ms after the TS-onset.
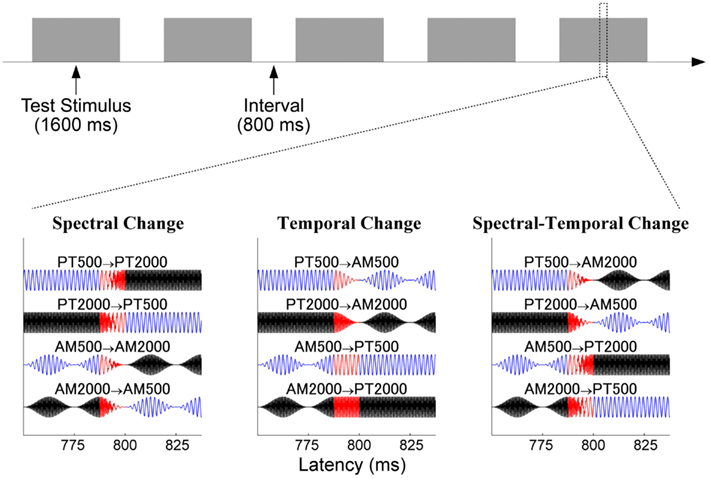
Figure 1. Experimental procedure in experiment 1. The upper panel shows the schematic time course of the sound presentation. The lower panels show the sound waveforms of the tonal test stimuli around the time point of sound change in the spectral change (SC: left column), temporal change (TC: middle), and spectral–temporal change (STC: right) conditions. Blue and black lines represent 500 and 2000 Hz, and red lines represent the sound change interval between 787.5 and 00 ms after sound onset.
All sound stimuli (sampling rate = 48000 Hz) were presented under the control of Presentation software (Neurobehavioral Systems, Albany, CA, USA). All sounds were presented through 0.6 m plastic tubes and silicon earpieces fitted individually to each subject’s ears. The hearing threshold for the PT500 was determined prior to each MEG measurement, and PT500 was presented binaurally at an intensity level 60 dB above the individual sensation level. The maximal amplitudes for the PT500, PT2000, AM500, and AM2000 were set to be identical. Hundred stimulus sequences for each TS were presented in a random order, resulting in 400 trials for each condition (SC, TC, or STC). The sound onset asynchrony between the TS was fixed to 1600 ms (Figure 1).
Experiment 2 (pulse-train stimuli)
As in experiment 1, TS were composed of two sound stimuli. However, here the sounds were prepared from band-pass filtered pulse-trains, as in our previous study (Okamoto et al., 2009). First, we generated 32 and 48 Hz pulse-trains with durations of 750 ms. The initial pulses of the 32 and 48 Hz pulse-trains occurred after silent intervals of 15.6 and 10.4 ms durations, respectively. These pulse-trains were then filtered either between 2800 and 4000 Hz (TS32_Low and TS48_Low), or between 4000 and 5600 Hz (TS32_High and TS48_High). As in experiment 1, in each case two pulse-train stimuli were combined to represent three experimental conditions (Figure 2): SC, TC, and STC. In the SC condition, the band-pass filter settings changed in the middle of the TS, while the type of train-pulse remained identical. In the TC condition, the filter settings remained identical, but the type of pulse-train changed in the middle of the TS. In the STC condition, the filter settings and pulse-patterns changed at the same time.
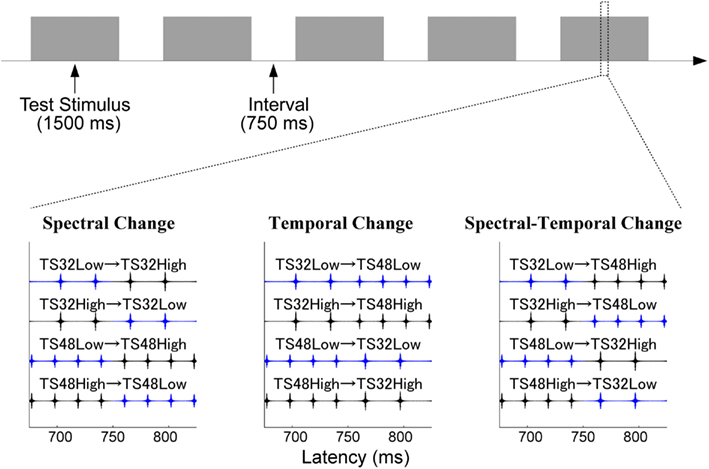
Figure 2. Experimental procedure in experiment 2. The figure displays the sound waveforms of the test stimuli (band-pass filtered train pulses) arranged according to Figure 1. Blue and black lines represent low and high band-pass filtered pulse-trains.
All sound stimuli (sampling rate = 48000 Hz) were prepared and presented as in experiment 1. First, the hearing threshold for TS32_Low was determined, and the intensity was set to 60 dB above the hearing threshold. The other TS were adjusted to have identical power to the TS32_Low. In each change condition (SC, TC, or STC), 100 stimulus sequences for each TS were presented in random order, resulting in 400 trials. The sound onset asynchrony between the TS was fixed to 1500 ms (Figure 2).
Data Acquisition and Analysis
Auditory evoked fields were measured with a helmet-shaped 275 channel whole head MEG system (Omega; CTF Systems, Coquitlam, BC, Canada) in a quiet and magnetically shielded room. The magnetic field signals were digitally recorded using a sampling rate of 600 Hz. In order to keep subjects in a stable alert state, they watched a silent movie of their choice during the MEG recordings. The status of the subjects was continuously monitored by the experimenters via video camera.
Epochs of magnetic field data, starting 300 ms prior to the TS-onset and ending 300 ms after the TS-offset, were averaged selectively for each condition and each experiment after the rejection of artifact-affected epochs containing field changes larger than 3 pT. The averaged magnetic field signals were 30 Hz low-pass filtered and baseline-corrected based on the 300 ms pre-stimulus silent interval in order to evaluate the transient auditory evoked magnetic responses elicited by the sound changes. Thereafter, the time courses of the root-mean-square (RMS) amplitudes of the magnetic fields of all sensors elicited in each condition (SC, TC, or STC) were calculated in experiments 1 and 2. The most prominent RMS peak around 100 ms after the sound change was defined as N1m response. The valleys preceding and following the N1m response were defined as P1m and P2m responses. The P1m, N1m, and P2m RMS amplitudes and latencies were evaluated separately by means of repeated-measures analyses of variance (ANOVA) using one factor (CONDITION: SC, TC, and STC). Thereafter, planned contrasts were calculated in order to reveal the P1m-, N1m-, and P2m-response differences between the SC and STC and between the TC and STC conditions.
Additionally, in order to compare the complete auditory evoked fields between STC and SC and between STC and TC, we subtracted the auditory evoked field of each sensor in the SC and TC conditions from the auditory evoked field of the corresponding sensor elicited in the STC condition (STC – SC and STC – TC) in experiments 1 and 2. Thereafter, the time courses of the means and the 95% confidence interval limits of the RMS values of the subtracted magnetic fields of all sensors (STC – SC and STC – SC) were calculated by means of bootstrap resampling tests (iteration = 10000).
Results
Magnetic Waveforms
We obtained clear auditory evoked fields from all participants in both experiments 1 and 2. Examples of individual magnetic field waveforms obtained in each experimental condition (SC, TC, and STC) and the difference waveforms between STC and SC and between STC and TC are shown in Figure 3 (experiment 1) and 4 (experiment 2). The auditory evoked fields elicited by the TS sound onsets demonstrate clear N1m responses (Näätänen and Picton, 1987) as well as further N1m-responses peaking at around 100 ms after the sound changes in all conditions (SC, TC, and STC).
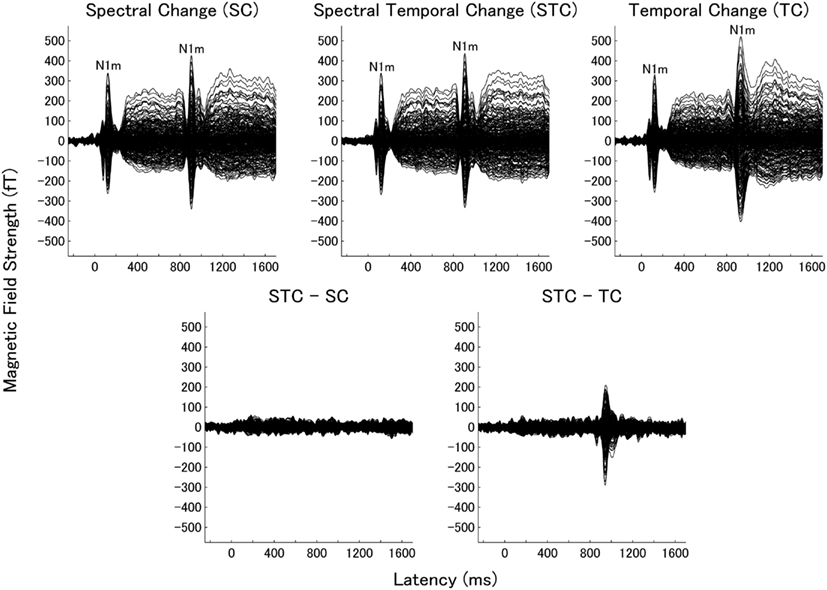
Figure 3. Examples of individual magnetic waveforms of all sensors in experiment 1. The upper panels represent the auditory evoked fields of one representative subject elicited by the spectral change (SC: left), spectral–temporal change (STC: middle), and temporal change (TC: right). The lower panels show the difference waveforms between STC and SC (STC – SC: left) and between STC and TC (STC – TC: right).
The subtracted magnetic waveforms (STC – SC and STC – TC, Figures 3 and 4), however, do not exhibit clear responses elicited by the TS-onset. Additionally, the subtracted STC – SC magnetic waveforms did not show clear neural response elicited by the sound changes at the TS-middle. In contrast, the subtracted magnetic STC – TC waveforms demonstrated clear evoked responses elicited by the sound changes. The calculated means of the RMS values of the auditory evoked fields for each condition averaged across all participants are displayed in Figure 5 (for experiment 1) Figure 6 (for experiment 2). Clear auditory evoked responses corresponding to both the onset of the test stimulus as well as the stimulus changes were observed. The RMS peaks corresponding to the N1m responses elicited by TC were delayed compared to those for the SC and STC conditions in experiments 1 (Figure 5) and 2 (Figure 6).

Figure 4. Examples of individual magnetic waveforms of all sensors in experiment 2. The figure displays the auditory evoked fields elicited by the test stimuli (band-pass filtered train pulses). All graphs are arranged according to Figure 3.
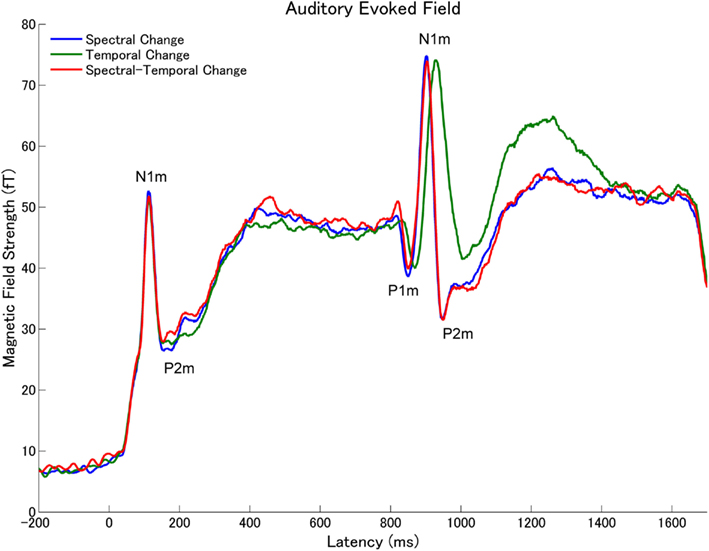
Figure 5. Grand averaged root-mean-square (RMS) values of the magnetic fields of all sensors across all subjects (N = 15) elicited by the tonal test stimuli (Figure 1) in experiment 1. The lines represent the spectral change (SC: blue line), temporal change (TC: green), or spectral–temporal change (STC: red) condition.
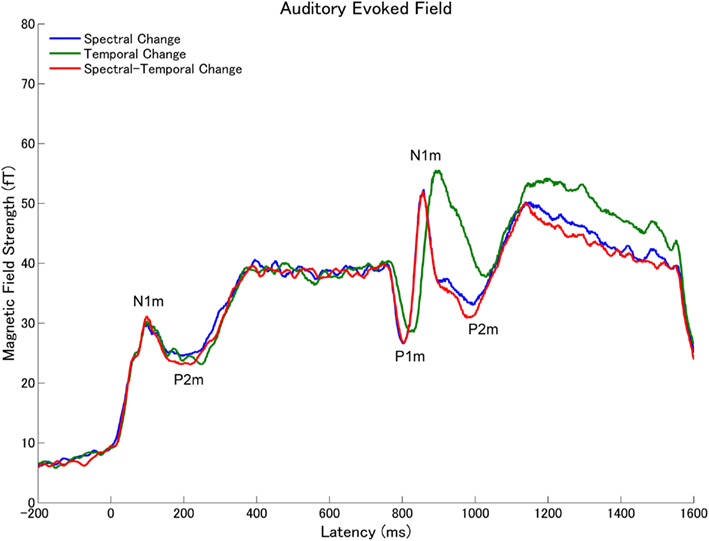
Figure 6. Grand averaged root-mean-square (RMS) values of the magnetic fields of all sensors across all subjects (N = 14) elicited by the band-pass filtered train pulses (Figure 2) in experiment 2 (arrangement according to Figure 5).
Auditory Evoked Components
The repeated-measures ANOVAs applied to the P1m, N1m, and P2m RMS amplitudes in experiments 1 (Figure 7) and 2 (Figure 8) resulted in significant main effects [P1m (experiment 1): F(2, 28) = 4.57, p < 0.02; P1m (experiment 2): F(2, 26) = 3.43, p < 0.05; N1m (experiment 2): F(2, 26) = 5.06, p < 0.02; P2m (experiment 1): F(2, 28) = 24.10, p < 0.001; P2m (experiment 2): F(2, 26) = 12.34, p < 0.001], but no significant main effect was found for the N1m RMS amplitudes in experiment 1 [F(2, 28) = 0.06, p = 0.944]. The planned contrasts applied to the P1m and P2m RMS amplitudes showed significant differences between TC and STC [P1m (experiment 1): p < 0.03; P1m (experiment 2): p < 0.03; P2m (experiment 1): p < 0.001; P2m (experiment 2): p < 0.001], but no significant differences between SC and STC [P1m (experiment 1): p = 0.59; P1m (experiment 2): p = 0.77; P2m (experiment 1): p = 0.58; P2m (experiment 2): p = 0.52]. The planned contrasts applied to the N1m RMS amplitudes showed a significant difference between TC and STC (p < 0.01) in experiment 2, but no significant differences between TC and STC (p = 0.76) in experiment 1 and between SC and STC (experiment 1: p = 0.78; experiment 2: p = 0.66) were found.
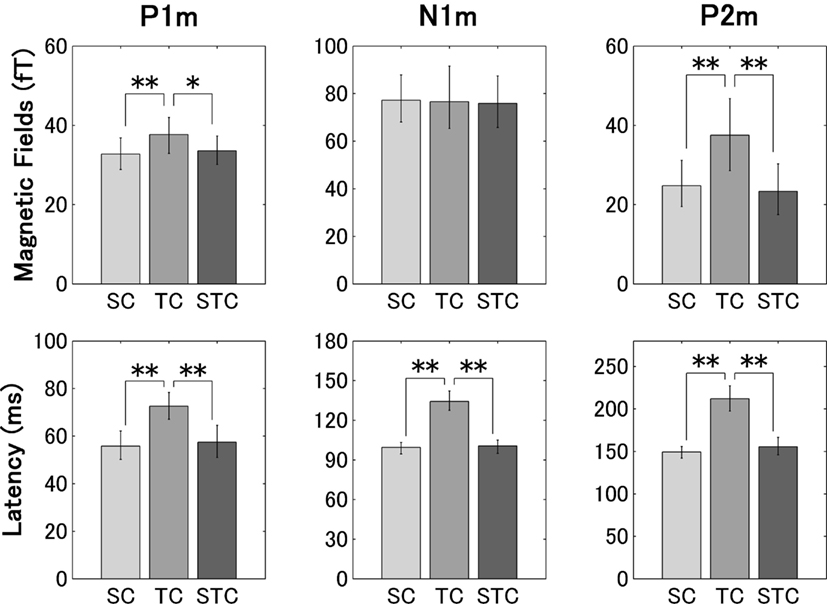
Figure 7. The graphs display the group means (N = 15) of the P1m (left column), N1m (middle column), and P2m (right column) root-mean-square (RMS) amplitudes (upper row), and latencies (lower row) after the sound changes for the spectral change (SC), temporal change (TC), and spectral–temporal change (STC) conditions, with error bars denoting the 95% confidence intervals in experiment 1 (*p < 0.05; **p < 0.01).
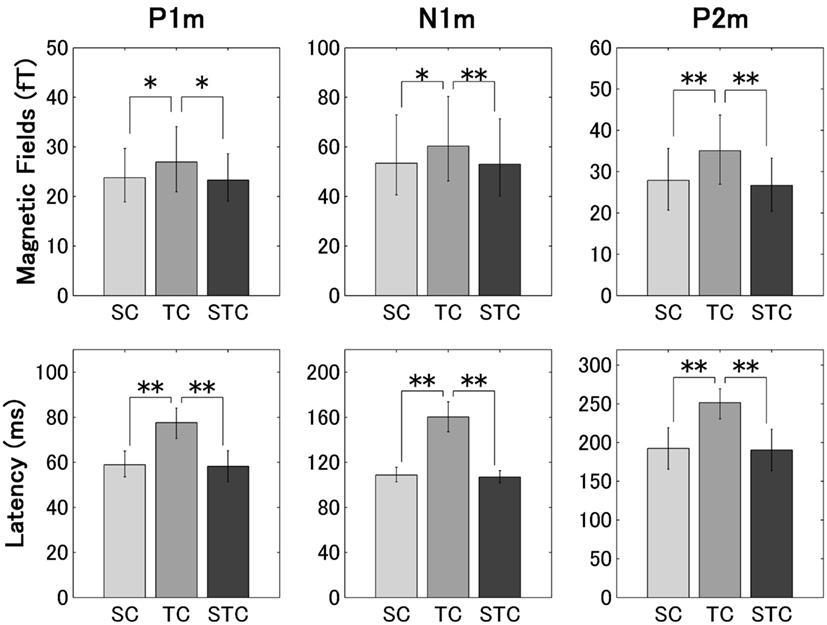
Figure 8. The group means (N = 14) of the P1m, N1m, and P2m RMS amplitudes and latencies in experiment 2 (arrangements according to Figure 7).
The repeated-measures ANOVAs applied to the P1m, N1m, and P2m latencies in experiments 1 (Figure 7) and 2 (Figure 8) resulted in significant main effects [P1m (experiment 1): F(2, 28) = 14.91, p < 0.001; P1m (experiment 2): F(2, 26) = 20.63, p < 0.001; N1m (experiment 1): F(2, 28) = 49.02, p < 0.001; N1m (experiment 2): F(2, 26) = 69.28, p < 0.001; P2m (experiment 1): F(2, 28) = 76.85, p < 0.001; P2m (experiment 2): F(2, 26) = 22.21, p < 0.001]. The planned contrasts applied to the P1m, N1m, and P2m latencies showed significant differences between TC and STC [P1m (experiment 1): p < 0.001; P1m (experiment 2): p < 0.001; N1m (experiment 1): p < 0.001; N1m (experiment 2): p < 0.001; P2m (experiment 1): p < 0.001; P2m (experiment 2): p < 0.001], but no significant differences were found between SC and STC [P1m (experiment 1): p = 0.63; P1m (experiment 2): p = 0.76; N1m (experiment 1): p = 0.78; N1m (experiment 2): p = 0.75; P2m (experiment 1): p = 0.24; P2m (experiment 2): p = 0.78].
Subtracted Auditory Evoked Fields
The means of the calculated RMS values of the subtracted auditory evoked fields (STC – SC and STC – TC) with the 95% confidence limits are displayed in Figure 9 (experiment 1) Figure 10 (experiment 2). The subtracted waveforms corresponding to the first part of the TS in experiments 1 and 2 did not demonstrate clear responses, because the first parts of the TS were totally counterbalanced between conditions. The RMS values of the difference waveforms between the STC and SC with 95% confidence limits did not exhibit clear neural responses elicited by the sound changes, which happened at the middle of the TS in both experiments 1 and 2. This result indicated that the auditory evoked fields elicited by SC were very similar to those elicited by STC. On the other hand, the auditory evoked fields in the STC and TC conditions exhibited significant neural activity differences elicited by the sound changes in experiments 1 (Figure 9) and 2 (Figure 10). Please note that Figures 9 and 10 represent the RMS values of the subtracted magnetic waveforms, not the subtraction of the RMS values of the magnetic fields of each condition displayed in Figures 5 and 6.
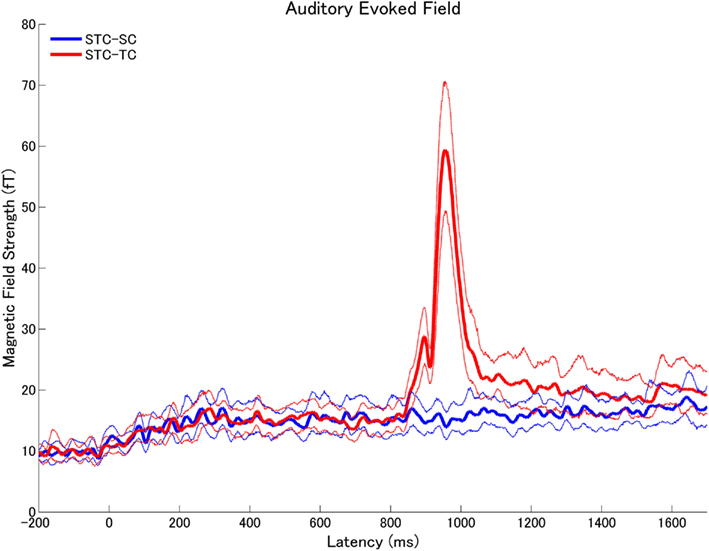
Figure 9. The means (solid lines) and the 95% confidence interval limits (dashed lines) of the root-mean-square (RMS) values of the subtracted auditory evoked fields (STC – SC: blue, STC – TC: red) across all subjects in experiment 1.
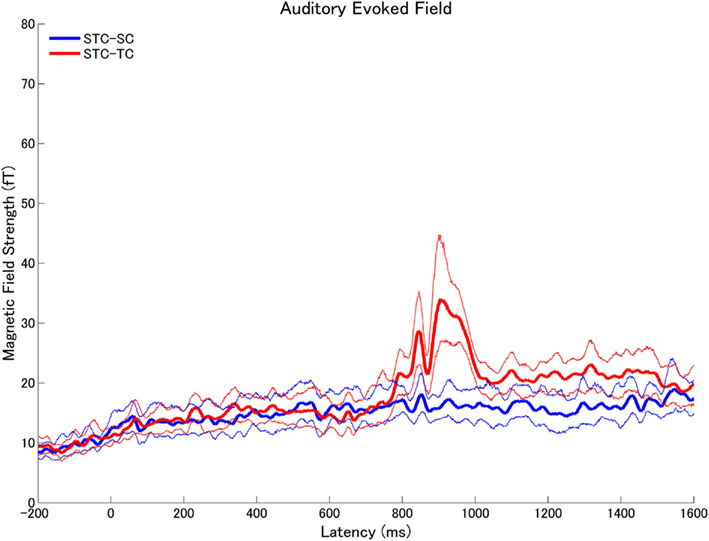
Figure 10. The means and the 95% confidence interval limits of the root-mean-square (RMS) values of the subtracted magnetic fields (STC – SC: blue, STC – TC: red) across all subjects in experiment 2.
Discussion
The results of the present study demonstrated that the neural responses elicited by spectral–temporal sound changes (STC) were very similar to those elicited solely by SC. However, they differed from the neural responses elicited solely by temporal sound changes (TC). Notably, the total physical sound input was identical between these conditions (SC, TC, and STC). Therefore, the summation of onset-, offset-, and sustained-responses elicited by the first and second parts of the TS could not have caused any differences between these conditions. In fact, the auditory evoked responses corresponding to the first part of the TS (i.e., 0–800 ms in experiment 1, and 0–750 ms in experiment 2) did not show any significant differences between the three conditions (Figures 3–6, 9, and 10). Only the interactions between the first and second parts of the TS could have caused the differences in the neural activity elicited by the sound changes. Furthermore, the congruent results of experiments 1 (tonal stimuli) and 2 (pulse-trains) indicate that the neural responses elicited by the spectral, temporal, and STC did not depend on a specific sound type. In our experiments, we did not use complex natural sounds (i.e., voices, music, birdsongs, etc.), but basic artificial sounds (i.e., tones and train pulses), which were carefully designed to include specific sound changes in the spectral and temporal domains within a short stimulus duration. Therefore, we suppose that the brain responses obtained in the present study represented general auditory neuronal responses to sound signals, which do not necessarily convey specific contents, as for instance speech sounds and music do. Additionally, the participants were distracted from the auditory signals during the MEG measurement by watching self-chosen silent movies. Therefore, top-down attentional neural modulation should have had little influence on the obtained results.
In the present study, we have performed two experiments. In experiment 1, we used combinations of pure tones and amplitude-modulated tones, which were adjusted to have identical maximal sound wave amplitude (the power of the AM sounds was 4.2 dB smaller). Therefore, sound power differed between the first and second parts of the TS in the TC and the STC, but not in the SC. In order to exclude the possibility that these power differences caused the observed results, we performed experiment 2, where sound power was balanced between the first and the second TS parts. However, the maximal amplitudes differed between the 32 and 48 Hz pulse-trains. Both experiments showed a similar results pattern. The auditory evoked fields elicited by the SC (characterized by identical maximal amplitude and identical power between the first and the second parts of the TS) were almost identical to the auditory evoked fields elicited by the STC, in case of which the second TS part was different in power (experiment 1) or maximal amplitude (experiment 2) compared to the first TS part. Therefore, the differences in power or maximal amplitude seem to have only little influence on the obtained results.
Spectral sound changes would cause shifts in the location of maximal vibration on the basilar membrane (Robles and Ruggero, 2001). Therefore, the first and second parts of the TS in the SC condition were encoded by different neural groups from the beginning of the auditory pathway on. In contrast, in the TC condition the location of maximal vibration did not change between the first and second parts of the TS, because the two parts were characterized by very similar spectral components. However, in the central auditory system, temporal information is not only represented by synchronized neural activity, but it is also encoded into rate codes, which are not synchronized to temporal modulation (Lu et al., 2001; Liang et al., 2002; Bendor and Wang, 2007). Yin et al. (2011) reported that primary auditory cortex neurons encoded temporal modulation patterns at least partially into firing rate patterns. Therefore, the neural processing of temporal sound changes seems to take place mainly at higher levels of the central auditory system than that of spectral sound changes. This might result in a delayed N1m in the TC compared to SC condition. In the combined STC condition, the earlier neural processing of the SC would elicit auditory evoked fields similar to the SC condition, and it might mask the subsequent neural responses corresponding to the TC, which would be processed at higher levels of the auditory pathway. Shamma et al. (2011) also suggested that two sound processing stages are necessary for auditory stream formation. First, in a feature-analytic stage, timbre, pitch, and location are predominantly processed. Thereafter, sounds are processed in a temporal-coherence analytic stage, which computes correlations among the outputs of the different feature-selective neurons. In the present study, the sound changes in the SC and STC conditions would be first detected in the feature-analytic stage, whereas the sound changes in the TC would be processed in the later temporal-coherence analytic stage. Eventually, this would lead to similar auditory evoked fields between the SC and STC conditions and to delayed and different auditory evoked fields elicited by the TC.
In order to elicit clear auditory evoked responses without distorting frequency characteristics, onset and offset ramps of around 10 ms duration were usually used. In the present study, we have used temporal modulations of 40 Hz, which corresponds to 12.5 ms onset- and offset-ramps. Previous studies have shown that human auditory cortex responses are preferentially time-locked to 40-Hz stimuli (Ross et al., 2000, 2002). Even though we used the most preferential temporal modulation rate for the human auditory cortex, the auditory evoked fields in the STC were similar to those in the SC and differed from those in the TC. Therefore, it appears less likely that using other temporal modulation frequencies would result in STC-evoked auditory evoked fields being very similar to auditory evoked fields elicited by TC alone.
The temporal integration window is an important factor in the analysis of spectral and temporal sound changes in the human brain. As suggested by previous studies (Joos, 1948; Zatorre et al., 2002), the window’s lengths might differ between spectral and temporal information processing. The detection of TC needs a longer temporal integration window than that of SC. The delayed N1m observed in the TC also demonstrates that the neural processing of temporal sound changes takes longer. Therefore, in the STC condition, the neural processing corresponding to the SCs may precede temporal processing in the human auditory cortex, and the temporal pattern changes may not elicit neural responses which are detectable by MEG.
Moreover, the results showed that the P1m, N1m, and P2m latencies were significantly delayed in the TC as compared to the SC condition in both experiments 1 and 2 (Figures 7 and 8). Thus, one might argue that the timing of the sound changes differed between the SC and the TC conditions. However, from a physical point of view, the onset latency of sound change was identical between the SC and the TC conditions, as shown in Figure 1 (experiment 1) and Figure 2 (experiment 2). Therefore, the physical sound stimulus properties alone cannot explain the finding that the P1m, N1m, and P2m responses were significantly delayed in the TC compared to the SC condition (Figure 7). The cyclic nature of sound signals plays an important role for the perception of spectral and temporal sound changes. The 40 Hz AM sound that we used was constituted of repeating cycles of a 25-ms sound signal segment. If the auditory evoked fields had been elicited after the completion of at least one cycle of audible (i.e., above threshold) sound change, the latencies of the auditory evoked responses would have been delayed in the TC compared to the SC condition, in which one cycle of the 500 or 2000 Hz pure tones took only 2 or 0.5 ms, respectively. However, it still remains elusive whether one complete cycle of the modulated sound was essential for eliciting the auditory evoked fields, or whether a partial 40 Hz cycle was enough. Nevertheless, as shown in Figures 5–8, the RMS amplitudes of the P1m and P2m responses were significantly different between the SC and the TC conditions in both experiments 1 and 2, indicating that the auditory evoked fields elicited by the TC were not only delayed, but also significantly different from those elicited by the SC.
The neural activity elicited by more salient changes is known to elicit larger N1m responses in the human auditory cortex (Näätänen and Picton, 1987). One might argue that the perceived sound differences between the first and second parts of the TS were more salient in the SC than TC condition, which might have led to the very similar auditory evoked fields in the SC and STC, but different auditory evoked fields in the TC and STC. The neural activity corresponding to the TCs might have been too small to cause any difference between the SC and STC conditions. However, both the spectral and the temporal changes were easily detected by the participants, and the maximal RMS amplitudes of the N1m responses in the SC condition were similar (experiment 1) or even smaller (experiment 2) compared to the N1m RMS amplitudes in the TC condition(Figures 7 and 8). Therefore, it is less likely that the neural processing corresponding to the STC in the human cortex was caused merely by more salient changes in the spectral domain compared to the temporal domain.
In conclusion, using sophisticated sound stimuli, which contained spectral, temporal, or spectral and temporal changes at the same time, the present study demonstrated that the auditory evoked fields elicited by spectral–temporal sound changes were similar to those elicited by spectral sound changes, but differed from those elicited by temporal sound changes. Even though previous studies showed that natural sounds (e.g., voices) could elicit different neural activity compared to artificial sounds (Belin et al., 2000; Theunissen et al., 2000; Woolley et al., 2005; Petkov et al., 2008), the results contribute to our understanding of how the human brain deals with complex auditory environments containing multiple and correlated spectral and temporal sound changes.
Conflict of Interest Statement
The authors declare that the research was conducted in the absence of any commercial or financial relationships that could be construed as a potential conflict of interest.
Acknowledgments
We thank Andreas Wollbrink for technical support, Karin Berning for organizing the data acquisition, and our test subjects for their diligent collaboration. This work has been supported by the “Deutsche Forschungsgemeinschaft” (Pa 392/13-1, Pa 392/10-3), “Japan Society for the Promotion of Science for Young Scientists (23689070),” “Strategic Research Program for Brain Sciences” (Development of biomarker candidates for social behavior), and IZKF (Münster CRA05).
References
Altmann, C. F., Gomes De Oliveira Junior, C., Heinemann, L., and Kaiser, J. (2010). Processing of spectral and amplitude envelope of animal vocalizations in the human auditory cortex. Neuropsychologia 48, 2824–2832.
Atencio, C. A., and Schreiner, C. E. (2008). Spectrotemporal processing differences between auditory cortical fast-spiking and regular-spiking neurons. J. Neurosci. 28, 3897–3910.
Belin, P., Zatorre, R. J., Lafaille, P., Ahad, P., and Pike, B. (2000). Voice-selective areas in human auditory cortex. Nature 403, 309–312.
Belin, P., Zilbovicius, M., Crozier, S., Thivard, L., and Fontaine, A. (1998). Lateralization of speech and auditory temporal processing. J. Cogn. Neurosci. 10, 536–540.
Bendor, D., and Wang, X. Q. (2007). Differential neural coding of acoustic flutter within primate auditory cortex. Nat. Neurosci. 10, 763–771.
Bilecen, D., Scheffler, K., Schmid, N., Tschopp, K., and Seelig, J. (1998). Tonotopic organization of the human auditory cortex as detected by BOLD-FMRI. Hear. Res. 126, 19–27.
Deboer, E., and Dreschler, W. (1987). Auditory psychophysics – spectrotemporal representation of signals. Annu. Rev. Psychol. 38, 181–202.
Eggermont, J. (1998). Representation of spectral and temporal sound features in three cortical fields of the cat. Similarities outweigh differences. J. Neurosci. 80, 2743–2764.
Eggermont, J. J. (1994). Temporal-modulation transfer-functions for Am and Fm stimuli in cat auditory-cortex – effects of carrier type, modulating wave-form and intensity. Hear. Res. 74, 51–66.
Houtgast, T., and Steeneke, H. J. M. (1973). Modulation transfer-function in room acoustics as a predictor of speech intelligibility. Acustica 28, 66–73.
Jamison, H. L., Watkins, K. E., Bishop, D. V., and Matthews, P. M. (2006). Hemispheric specialization for processing auditory nonspeech stimuli. Cereb. Cortex 16, 1266–1275.
Johnson, D. H. (1980). The relationship between spike rate and synchrony in responses of auditory-nerve fibers to single tones. J. Acoust. Soc. Am. 68, 1115–1122.
Joris, P. X., Schreiner, C. E., and Rees, A. (2004). Neural processing of amplitude-modulated sounds. Physiol. Rev. 84, 541–577.
Joris, P. X., and Yin, T. C. T. (1992). Responses to amplitude-modulated tones in the auditory-nerve of the cat. J. Acoust. Soc. Am. 91, 215–232.
Lauter, J. L., Herscovitch, P., Formby, C., and Raichle, M. E. (1985). Tonotopic organization in human auditory cortex revealed by positron emission tomography. Hear. Res. 20, 199–205.
Liang, L., Lu, T., and Wang, X. Q. (2002). Neural representations of sinusoidal amplitude and frequency modulations in the primary auditory cortex of awake primates. J. Neurophysiol. 87, 2237–2261.
Linden, J. F., Liu, R. C., Sahani, M., Schreiner, C. E., and Merzenich, M. M. (2003). Spectrotemporal structure of receptive fields in areas AI and AAF of mouse auditory cortex. J. Neurophysiol. 90, 2660–2675.
Lu, T., Liang, L., and Wang, X. Q. (2001). Temporal and rate representations of time-varying signals in the auditory cortex of awake primates. Nat. Neurosci. 4, 1131–1138.
Mäkelä, J. P., Hari, R., and Leinonen, L. (1988). Magnetic responses of the human auditory cortex to noise/square wave transitions. Electroencephalogr. Clin. Neurophysiol. 69, 423–430.
Mäkelä, J. P., Hari, R., and Linnankivi, A. (1987). Different analysis of frequency and amplitude modulations of a continuous tone in the human auditory cortex: a neuromagnetic study. Hear. Res. 27, 257–264.
Martin, B. A., and Boothroyd, A. (2000). Cortical, auditory, evoked potentials in response to changes of spectrum and amplitude. J. Acoust. Soc. Am. 107, 2155–2161.
Miller, L. M., Escabi, M. A., Read, H. L., and Schreiner, C. E. (2002). Spectrotemporal receptive fields in the lemniscal auditory thalamus and cortex. J. Neurophysiol. 87, 516–527.
Näätänen, R., and Picton, T. (1987). The N1 wave of the human electric and magnetic response to sound: a review and an analysis of the component structure. Psychophysiology 24, 375–425.
Obleser, J., Eisner, F., and Kotz, S. A. (2008). Bilateral speech comprehension reflects differential sensitivity to spectral and temporal features. J. Neurosci. 28, 8116–8123.
Okamoto, H., Stracke, H., Draganova, R., and Pantev, C. (2009). Hemispheric asymmetry of auditory evoked fields elicited by spectral versus temporal stimulus change. Cereb. Cortex 19, 2290–2297.
Oldfield, R. C. (1971). The assessment and analysis of handedness: the Edinburgh inventory. Neuropsychologia 9, 97–113.
Pantev, C., Hoke, M., Lehnertz, K., Lutkenhoner, B., Anogianakis, G., and Wittkowski, W. (1988). Tonotopic organization of the human auditory cortex revealed by transient auditory evoked magnetic fields. Electroencephalogr. Clin. Neurophysiol. 69, 160–170.
Pantev, C., Roberts, L. E., Elbert, T., Ross, B., and Wienbruch, C. (1996). Tonotopic organization of the sources of human auditory steady-state responses. Hear. Res. 101, 62–74.
Petkov, C. I., Kayser, C., Steudel, T., Whittingstall, K., Augath, M., and Logothetis, N. K. (2008). A voice region in the monkey brain. Nat. Neurosci. 11, 367–374.
Reale, R. A., and Imig, T. J. (1980). Tonotopic organization in auditory cortex of the cat. J. Comp. Neurol. 192, 265–291.
Robles, L., and Ruggero, M. A. (2001). Mechanics of the mammalian cochlea. Physiol. Rev. 81, 1305–1352.
Romani, G. L., Williamson, S. J., and Kaufman, L. (1982). Tonotopic organization of the human auditory cortex. Science 216, 1339–1340.
Rosen, S. (1992). Temporal information in speech - acoustic, auditory and linguistic aspects. Philos. Trans. R. Soc. Lond. B Biol. Sci. 336, 367–373.
Ross, B., Borgmann, C., Draganova, R., Roberts, L. E., and Pantev, C. (2000). A high-precision magnetoencephalographic study of human auditory steady-state responses to amplitude-modulated tones. J. Acoust. Soc. Am. 108, 679–691.
Ross, B., Picton, T. W., and Pantev, C. (2002). Temporal integration in the human auditory cortex as represented by the development of the steady-state magnetic field. Hear. Res. 165, 68–84.
Schreiner, C. E., and Langner, G. (1988). Periodicity coding in the inferior colliculus of the cat. II. Topographical organization. J. Neurophysiol. 60, 1823–1840.
Shamma, S. A., Elhilali, M., and Micheyl, C. (2011). Temporal coherence and attention in auditory scene analysis. Trends Neurosci. 34, 114–123.
Theunissen, F. E., Sen, K., and Doupe, A. J. (2000). Spectral-temporal receptive fields of nonlinear auditory neurons obtained using natural sounds. J. Neurosci. 20, 2315–2331.
Wang, X., Lu, T., Bendor, D., and Bartlett, E. (2008). Neural coding of temporal information in auditory thalamus and cortex. Neuroscience 154, 294–303.
Wessinger, C. M., Buonocore, M. H., Kussmaul, C. L., and Mangun, G. R. (1997). Tonotopy in human auditory cortex examined with functional magnetic resonance imaging. Hum. Brain Mapp. 5, 18–25.
Woolley, S. M. N., Fremouw, T. E., Hsu, A., and Theunissen, F. E. (2005). Tuning for spectro-temporal modulations as a mechanism for auditory discrimination of natural sounds. Nat. Neurosci. 8, 1371–1379.
Yin, P., Johnson, J. S., O’Connor, K. N., and Sutter, M. L. (2011). Coding of amplitude modulation in primary auditory cortex. J. Neurophysiol. 105, 582–600.
Zatorre, R. J., and Belin, P. (2001). Spectral and temporal processing in human auditory cortex. Cereb. Cortex 11, 946–953.
Zatorre, R. J., Belin, P., and Penhune, V. B. (2002). Structure and function of auditory cortex: music and speech. Trends Cogn. Sci. (Regul. Ed.) 6, 37–46.
Keywords: amplitude modulation, evoked response, magnetoencephalography, N1m, P1m, P2m
Citation: Okamoto H, Teismann H, Kakigi R and Pantev C (2012) Auditory evoked fields elicited by spectral, temporal, and spectral–temporal changes in human cerebral cortex. Front. Psychology 3:149. doi: 10.3389/fpsyg.2012.00149
Received: 04 November 2011; Accepted: 25 April 2012;
Published online: 11 May 2012.
Edited by:
Micah M. Murray, Université de Lausanne, SwitzerlandReviewed by:
Gregg H. Recanzone, University of California, USAPiia Astikainen, University of Jyväskylä, Finland
Tommi Raij, Harvard Medical School, USA
Copyright: © 2012 Okamoto, Teismann, Kakigi and Pantev. This is an open-access article distributed under the terms of the Creative Commons Attribution Non Commercial License, which permits non-commercial use, distribution, and reproduction in other forums, provided the original authors and source are credited.
*Correspondence: Hidehiko Okamoto, Department of Integrative Physiology, National Institute for Physiological Sciences, 38 Nishigo-Naka, Myodaiji, Okazaki, 444-8585, Japan. e-mail: hokamoto@nips.ac.jp; Christo Pantev, Institute for Biomagnetism and Biosignalanalysis, University of Muenster, Malmedyweg 15, Muenster 48149, Germany. e-mail: pantev@uni-muenster.de