Neural mechanisms of intermodal sustained selective attention with concurrently presented auditory and visual stimuli
Institute of Psychology I, University of Leipzig, Leipzig, Germany
We investigated intermodal attention effects on the auditory steady-state response (ASSR) and the steady-state visual evoked potential (SSVEP). For this purpose, 40-Hz amplitude-modulated tones and a stream of flickering (7.5 Hz) random letters were presented concurrently. By means of an auditory or visual target detection task, participants’ attention was directed to the respective modality for several seconds. Attention to the auditory stream led to a significant enhancement of the ASSR compared to when the visual stream was attended. This attentional modulation was located mainly in the right superior temporal gyrus. Vice versa, attention to the visual stream especially increased the second harmonic response of the SSVEP. This modulation was focused in the inferior occipital and lateral occipitotemporal gyrus of both hemispheres. To the best of our knowledge, this is the first demonstration of amplitude modulation of the ASSR and the SSVEP by intermodal sustained attention. Our results open a new avenue of research to understand the basic neural mechanisms of intermodal attention in the human brain.
Everyday life in a complex multisensory environment requires shielding the perceptual system from overflow. To allow for adaptive behaviour it is pivotal to process relevant information while ignoring the rest. Although information from different modalities often needs to be integrated to form one perceptual object, it is as common that selection on the basis of only one modality is needed for optimal filtering of relevant information. A reversed situation would be, for instance, to concentrate on auditory information during an important telephone call while ignoring the surrounding visual input. If attention is seen as a collection of hierarchical filters providing various levels of selection (Hansen and Hillyard, 1983
; Heslenfeld et al., 1997
; de Ruiter et al., 1998
; Heslenfeld, 1998
; Talsma and Kok, 2001
), one of these levels is considered to select information among sensory modalities, which leads to amplified processing of stimuli in the attended modality compared to stimuli in the unattended modality as in the above examples. The difference in the attentional processing of a stimulus in one modality versus when attention is allocated to a different modality is described in the literature as intermodal attention (Alho et al., 1992
, 1994b
; Woods et al., 1992
; de Ruiter et al., 1998
; Eimer and Schröger, 1998
; Talsma and Kok, 2001
, 2002
). Intramodal attention on the other hand is needed when competing stimuli appear within the same modality (Alho et al., 1994b
; de Ruiter et al., 1998
; Talsma and Kok, 2001
, 2002
). A number of previous studies investigated the influence of intermodal attention on event-related potentials (Hillyard et al., 1973
; Hansen and Hillyard, 1980
, 1984
; Näätänen, 1992
; Alho et al., 1994a
,b
; Arnott and Alain, 2002
). Similar to intramodal attention (Hillyard et al., 1973
; Hansen and Hillyard, 1980
, 1984
; Näätänen, 1992
; Alho et al., 1994a
,b
; Arnott and Alain, 2002
), selective intermodal attention leads to a frontocentrally distributed enhanced negativity in the ERP, elicited by sounds when the auditory modality was attended compared to when the visual (Woods et al., 1992
; Alho et al., 1994b
; Eimer and Schröger, 1998
; Talsma and Kok, 2001
, 2002
) or the somatosensory (Hötting et al., 2003
) modality had to be attended. This negativity was sometimes followed by an enhanced positivity (Woods et al., 1992
). In the visual modality intermodal attention leads to an enhanced negativity in the ERP (elicited by the relevant visual stimulus) at posterior electrodes when the visual modality was attended compared to when the auditory modality was attended (Woods et al., 1992
; Eimer and Schröger, 1998
).
While ERP studies have been able to show post-perceptual processes when subjects attended to the one or the other modality, they have the serious limitation that ERP designs require the serial presentation of events in order to extract the relevant components of the ERP without superimposition of the brain response from the preceding stimulus. Furthermore, it is more difficult to maintain a focused state of attention to one modality when transient events are presented. In everyday life, the brain is confronted with simultaneous multisensory information and attention has to be focused at one modality for several seconds, as described in the examples above, while ignoring the information from other modalities. Thus, in the present study we presented our subjects auditory and visual repetitive stimuli concurrently and subjects were required to attend to the visual or auditory modality to detect and to respond to target stimuli for several seconds. Repetitive stimuli, e.g., flickering visual stimuli or amplitude modulations in a sound, evoke a continuous oscillatory brain response called the Steady-state visual evoked potential (SSVEP) or the Auditory steady-state response (ASSR), respectively. This brain response has the same fundamental frequency as the periodic rhythm of the stimulation (Regan, 1989
) and might also contain higher harmonics. Especially the second harmonic response of the fundamental frequency is reported to be particularly robust in the SSVEP (Herrmann, 2001
; Pei et al., 2002
; Fawcett et al., 2004
), and in contrast to higher harmonic responses, seems to be highly sensitive for attentional modulation (Pastor et al., 2007
). Previous studies have provided evidence for different neuronal generators of the fundamental and the harmonic response (Pei et al., 2002
; Pastor et al., 2007
) of the SSVEP, therefore the investigation of both responses might establish a more complex pattern of the intermodal attentional network.
The observation of harmonic responses in the ASSR stronger depends on the presentation rate/modulation frequency used. During stimulation with low modulation frequencies (10–20 Hz in Ross et al., 2000
; 12 Hz in Herdman et al., 2002
) previous studies observed a dominance of the harmonic responses in the response spectrum (in Ross et al., 2000
especially around 40 Hz), whereby during stimulation rates around 40 Hz the response spectrum was dominated by the fundamental frequency, with only a diminutive second harmonic response (Ross et al., 2000
; Herdman et al., 2002
). Using 80 Hz as modulation frequency (Ross et al., 2000
) the response spectrum showed only a single peak at the fundamental frequency, with no significant second harmonic response.
Intramodal attentional modulations of steady-state responses have been demonstrated in electroencephalographic (EEG) recordings in the visual (e.g., Morgan et al., 1996
; Müller et al., 1998a
,b
, 2006
), somatosensory (e.g., Giabbiconi et al., 2007
) and auditory modality (e.g., Bidet-Caulet et al., 2007
; Skosnik et al., 2007
; Müller et al., 2009
; but see Linden et al., 1987
for contradictory results). However, studies investigating the sensitivity of steady-state responses to intermodal attention are sparse. One study using SSVEPs to resolve the question if the attentional capacity is supramodal or modality specific was provided by Talsma et al. (2006)
. During a combined presentation of a letter stream (eliciting the SSVEP) and auditory, visual and audiovisual objects, largest SSVEPs were observed when the letter stream had to be attended. Moreover, the authors found higher SSVEP amplitudes when the auditory objects were attended exclusively compared to when only the visual objects were attended or auditory and visual objects were attended simultaneously. Between the latter two conditions no difference in the SSVEP amplitudes was observed. Therefore, the authors concluded that the attentional capacity between modalities is larger than the attentional capacity within one modality.
First evidence for attentional modulation of the ASSR during an intermodal attention design was provided by a magneto-encephalography (MEG) study by Ross et al. (2004)
. While participants were selectively attending to amplitude-modulated sine tones (‘attend’ condition) versus focusing on a visual picture-counting task (‘non-attend’ condition), an attention-related enhancement of the ASSR amplitude was demonstrated. These results have been replicated with EEG (Saupe et al., 2009
). However, in both studies attention effects were limited to the auditory modality. Because of fundamental differences between visual and auditory processing, qualitative task differences are predetermined in intermodal designs. Even more important is the adjustment of task difficulty between the auditory and the visual task. Because behavioural data are not reported in Ross et al. (2004)
it can not be excluded that the ASSR effect is due to more general processes such as arousal. Therefore, in a previous study (Saupe et al., 2009
) we controlled for task difficulty in order to exclude this possible influence on the level of arousal. But as with the study by Ross et al. (2004)
, we did not measure the cortical response to visual stimuli, thus we had no differential neural information when subjects attended to the auditory modality and when they attended to the visual stimuli. At present it is not known whether sustained selective attention to the auditory or visual modality selectively enhances the brain response for the attended modality compared to when that modality is ignored when visual and auditory stimuli are presented together. The present study aimed to answer that question.
Subjects
Seventeen subjects (eight females) participated in the experiment. Three subjects (two females) had to be excluded because of high alpha activity in the frequency range of the visual stimulation. Mean age of the remaining subjects was 25.5 years (range 21–30 years). All subjects reported normal hearing and normal or corrected-to-normal vision. None of the participants had a history of a neurological disease or injury. According to the Declaration of Helsinki, written informed consent was obtained from each subject prior to the beginning of the experiment. Subjects were paid or received course credits for their participation.
Stimuli and Task
Auditory stimuli were 500-Hz tones with a 40-Hz amplitude modulation. Frequency of amplitude modulation was chosen to elicit maximal ASSR amplitudes (Ross et al., 2000
; Herdman et al., 2002
; for review see Picton et al., 2003
). Stimulus duration was 3.45 s, including rise and fall times of 12.5 ms each. The amplitude modulation had a modulation depth of 100%; it started 25 ms after stimulus onset and lasted for 3.4 s. Fifty percent of all trials contained between one and three targets, with an equal distribution of trials with one, two, or three targets (33.3%). A target consisted of a reduction of the modulation frequency to 30 Hz for a period of 200 ms (Figure 1
A). The temporal position of targets in the target stimulus was pseudo-randomly chosen from fifteen 200 ms-windows, the earliest starting 425 ms after stimulus onset. Successive targets in one target stimulus were separated by at least 600 ms (3 sequence windows). Auditory stimulation was presented binaurally over headphones with an intensity of 60 dB SPL.
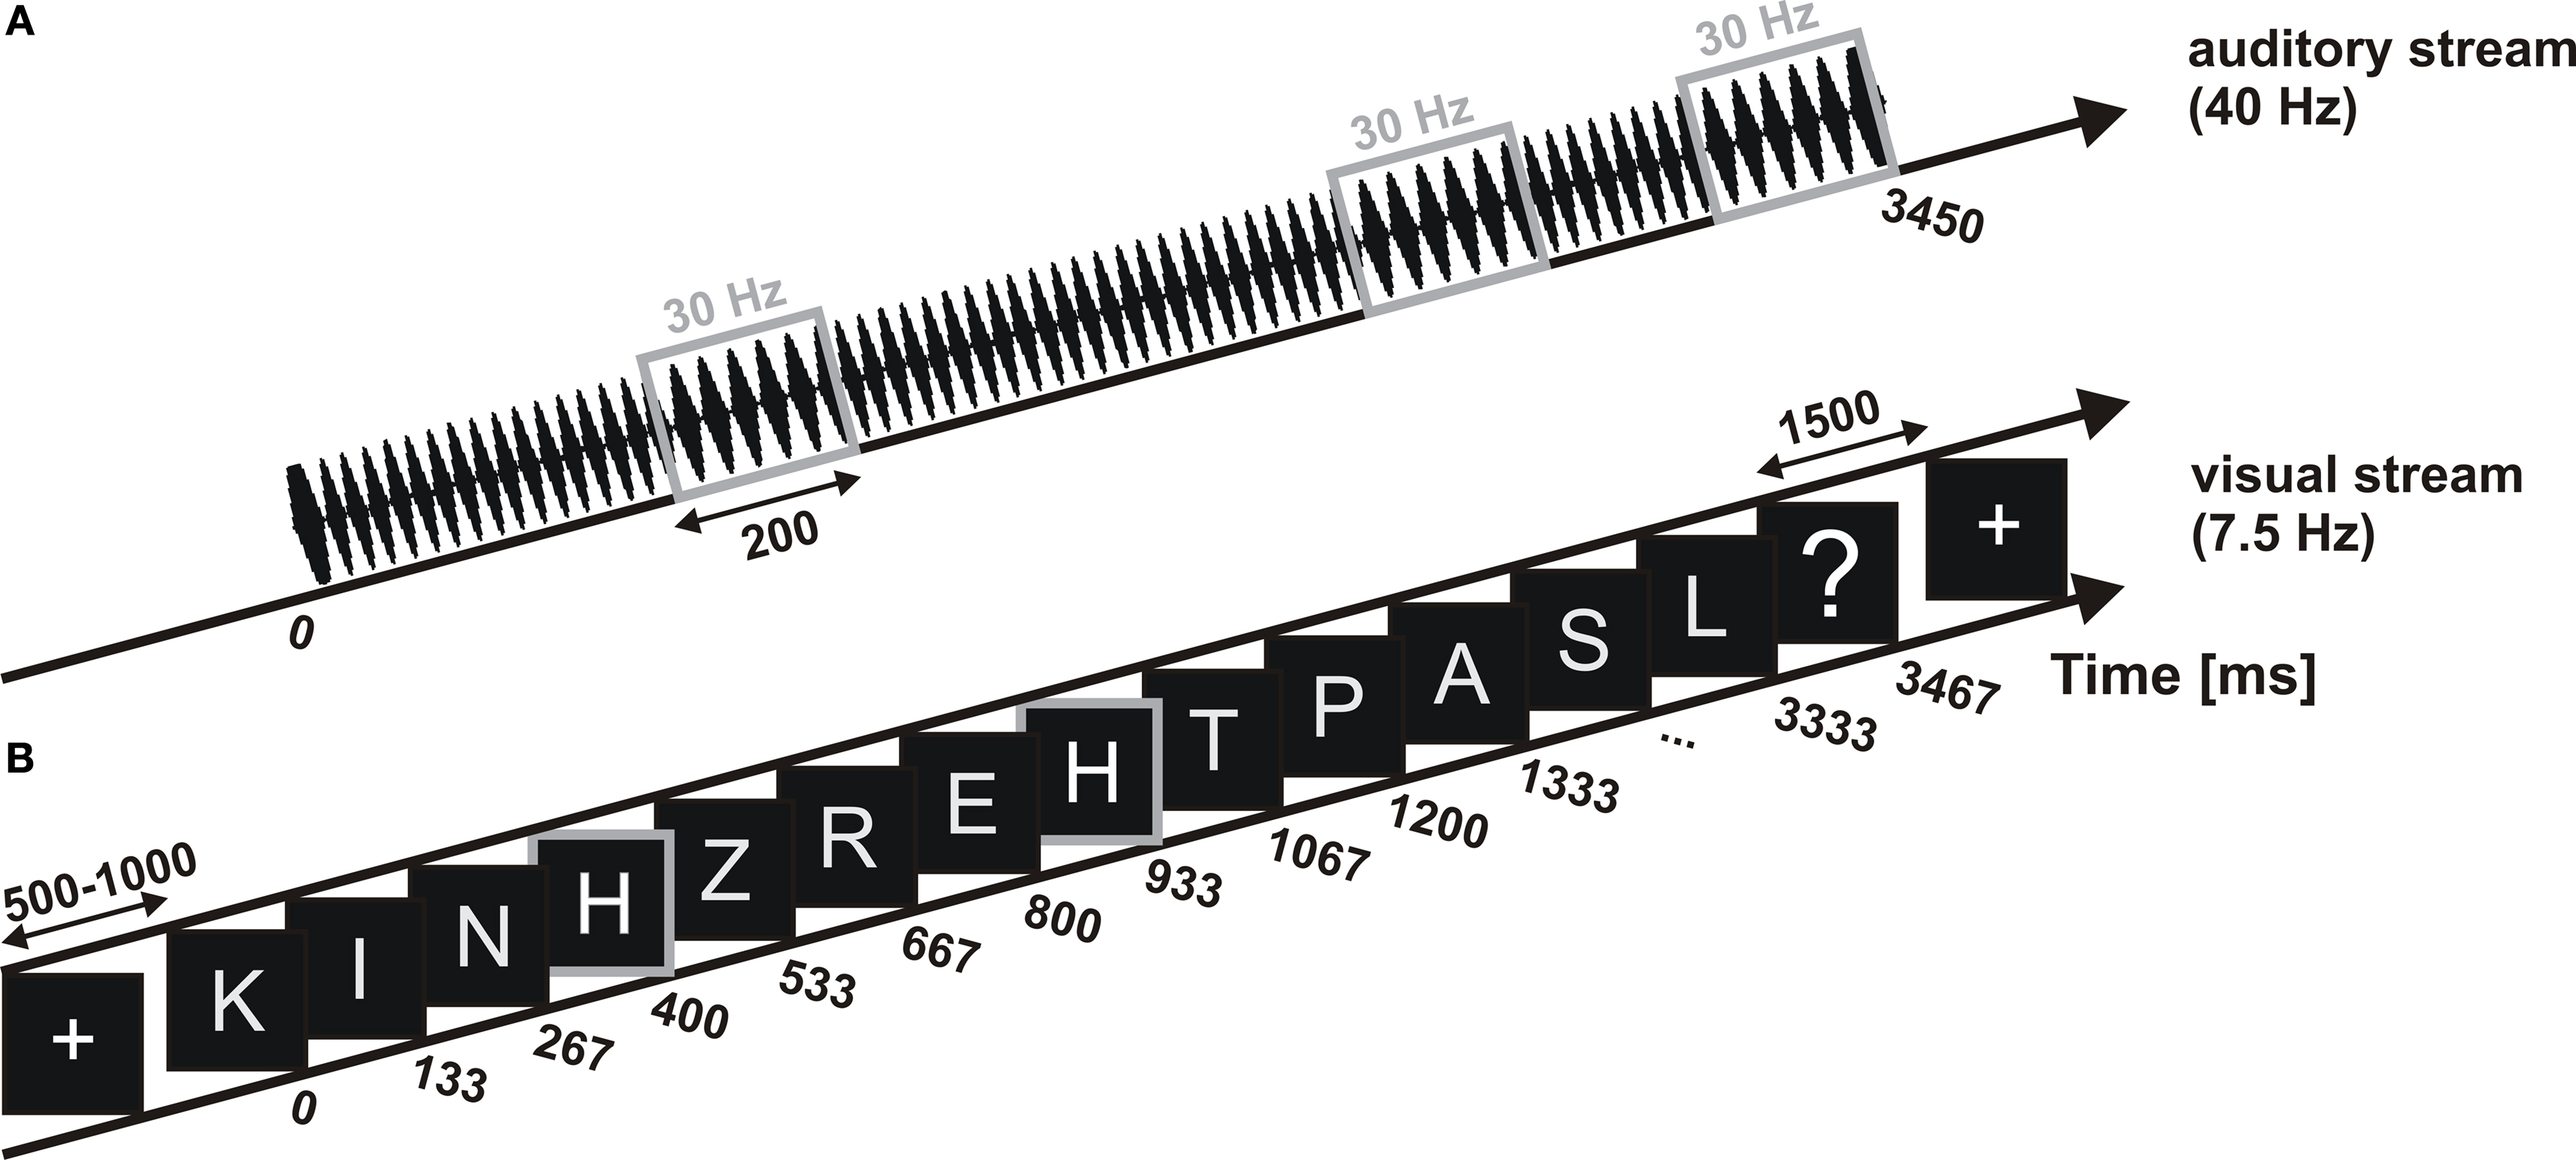
Figure 1. Schematic illustration of one trial. (A) 40-Hz amplitude-modulated auditory stimulus with three targets included. Targets (30-Hz amplitude-modulated sequences with a duration of 200 ms) are indicated by a grey box. (B) Visual letter stream with a presentation rate of 7.5 Hz with two targets included, the letter ‘H’ (grey border). Each trial started with the presentation of the fixation cross for a randomized duration of 500–1000 ms. Auditory and visual stimulation started simultaneously and lasted for 3450 ms and 3467 ms, respectively. After the end of the visual letter stream a question mark appeared for 1500 ms before the next trial started.
For visual stimulation a stream of random letters (selected from A to X of the alphabet, with the letter H serving as target letter, Figure 1
B) was presented in a rapid serial visual presentation manner in the center of a 19-inch computer monitor situated 103 cm in front of the subjects. The size of the letter stream corresponded to a visual angle of 1°× 0.6°. White colored letters (RGB 100, 100, 100) were presented against a black background (RGB 0, 0, 0) with the monitor set to a resolution of 1024 × 768 pixels. Stimulation frequency was synchronized to the 60-Hz refresh rate of the monitor, resulting in a presentation with five frames on (83.3 ms) plus three frames off (50 ms), corresponding to a frequency of 7.5 Hz. This stimulation frequency (i.e. presentation rate) was chosen mainly for an appropriate task difficulty. A second reason was the high amplitude in the range between 7 and 8 Hz demonstrated by Srinivasan et al. (2006)
(for similar results see Müller and Hübner, 2002
; Müller et al., 2006
) and the high attentional sensitivity observed in this frequency band in previous experiments of our own group (Müller and Hübner, 2002
; Müller et al., 2006
). Randomization was restricted to prevent two identical letters from being presented in succession. The visual letter streams were presented for a period of 3467 ms (26 letters per stream). In 50% of the visual streams the letter H was included, serving as visual target. Each target stream included one to three targets with an equal probability of 33.3%. The temporal position of targets in the letter streams was pseudo randomized, with the first target not earlier than 400 ms (fourth letter in the stream, see Figure 1
B). Targets in the letter stream were separated with a minimal distance between successive targets of 400 ms (three letters) in one letter stream.
Each trial started with the central presentation of a fixation cross for a randomized time interval between 500 ms and 1000 ms. After the fixation cross disappeared the auditory stimulus and the visual letter stream started synchronously, lasting 3.450 s and 3.467 s, respectively. After that, a question mark appeared on the screen for 1500 ms, indicating the response window for the subjects (see Figure 1
). Subjects were instructed in a block-wise manner to direct their attention either to the auditory or the visual stimulation and to count the number of targets included in one trial in this modality. Responses were given after stimulus offset, when the question mark appeared, by pressing one of four buttons, indicating zero, one, two or three targets in this trial in the to be attended modality. The order of the response buttons on the response box (0-1-2-3 or 3-2-1-0, from left to right) was counterbalanced across subjects. Physical stimulation was identical for the attend and ignore condition, that means targets occurred also in the non-attended stream, which necessitates the suppression of this stream. Targets for the auditory and visual streams were randomized independently, resulting in trials with auditory or visual targets alone and trials, in which both, auditory and visual targets occurred (non necessarily simultaneously).
Procedure
Subjects were comfortably seated in an electrically shielded and sound-attenuated cabin. Two experimental conditions (‘attend auditory’ and ‘attend visual’), each consisting of five blocks, were run alternately with the starting condition counterbalanced across subjects. Each block consisted of 60 trials (30 trials with and 30 trials without targets) and lasted for 5.7 min. This resulted in the presentation of 300 trials (=150 trials without targets) per condition and an experimental duration of 58 min. To familiarize subjects with the tasks, a training session was run at the beginning of the first block of each condition.
Data Recording and Analysis
Behavioral data
The response number (0–3, indicated by the button on the response box) was compared with the number of targets included in the preceding stimulus trial in the attended modality. To order responses to the categories hits, false alarms and misses the number of included targets was subtracted from the response number for each trial separately. If the response number was higher then the target number, the number of hits was defined by the target number, and the difference between response and target number defined the number of false alarms. If the response number was lower then the target number, the number of hits was defined by the response number with the number of misses indicated by the absolute value of the difference between response and target number. The number of hits is expressed as the number of detected targets compared to the total number of included targets in percent. The false alarm rate is expressed as an absolute number. Differences in hit rates (in percent) and false alarms (as absolute numbers) between the auditory and visual task were tested via paired two-tailed t-tests.
Electrophysiological data
The electroencephalogram was continuously recorded with a BioSemi Active-Two amplifier system (BioSemi, Amsterdam, the Netherlands) from 64 Ag-AgCl electrodes according to the international 10–20 system (Chatrian et al., 1985
; Oostenveld and Praamstra, 2001
). Electrodes were mounted in a nylon cap. Additional electrodes were placed at the tip of the nose, serving as reference after artefact correction, and at the left and right mastoids. Eye movements were monitored by bipolar recordings of the horizontal and vertical electrooculogram (EOG). EEG and EOG signals were sampled at 512 Hz.
For the analysis of the ASSR and the SSVEP, a 0.5-Hz high-pass filter (kaiser window, ripple: 0.001, length: 1856 points) was applied, and filtered data were epoched into periods of 800 ms pre to 3600 ms post-stimulus onset. The long pre-stimulus baseline was used to control for differences in the pre-stimulus alpha activity between conditions. Auditory targets differed from auditory standards in the critical attribute of modulation frequency and thus interrupted the 40-Hz ASSRs. Therefore, trials including target sequences were removed from the analysis of the ASSR. To keep the auditory and visual conditions comparable, trials containing visual targets were also excluded from the SSVEP-analysis. Only trials with correct responses (no false alarms) were included in the analyses.
Trials with horizontal and vertical eye movements exceeding 25 μV and all trials containing blinks were also excluded from the analysis. To correct for additional artefacts, such as single noisy electrodes, the ‘statistical correction of artefacts in dense array EEG/MEG studies’ (SCADS, Junghöfer et al., 2000
) was applied. This algorithm locates sensors that are contaminated by artifacts in single trials or during the entire recording session based on the statistical distributions over trials of maximum absolute voltages, maximal temporal gradients and standard deviations. Trials in which the number of artifact contaminated sensors exceeds a certain threshold (here 12 electrodes) were rejected. If the number of contaminated sensors is lower than this threshold, these sensors are replaced with spherical spline interpolations statistically weighted on the basis of all sensors. The mean rejection rate across trials was 15.2% and did not exceed 38.7% for any participant or condition.
In order to exclude the evoked response to the onset of the auditory and visual stimulus train in the ASSR and SSVEP amplitude, the first 500 ms of each trial were excluded from further analysis. The spectrum of each electrode was calculated by Fourier-transformation for each subject in the latency range between 500–2900 ms (representing 96 complete cycles of the 40-Hz ASSR, 18 complete cycles of the 7.5-Hz SSVEP and 36 complete cycles of the 15-Hz SSVEP, second harmonic response) after stimulus onset. Base-to-peak amplitudes of the ASSR and SSVEP were quantified as the absolute value of the complex Fourier-coefficients at the respective frequencies. Prior to Fourier-transformation, data within the time-window of analysis were detrended (removal of mean and linear trends).
To choose appropriate electrodes for statistical analysis, spherical-spline interpolated iso-contour voltage maps (Perrin et al., 1989
) of the mean ASSR- and SSVEP-amplitudes averaged across experimental conditions (see Figure 3
A) were calculated. The topography of the 40-Hz ASSR showed amplitude maxima over frontocentral electrodes. Due to differences in the distribution of the individual maxima, we chose two adjacent electrodes exhibiting the highest 40-Hz amplitudes in frontocentral areas for each subject individually. The average across these two electrodes was calculated and statistically compared between the condition when the auditory stimulation was attended compared to when it was ignored (meaning the visual stimulation was attended) by paired two-tailed t-tests (see also Lutzenberger et al., 1994
; Csibra et al., 2000
; Vidal et al., 2006
; Fuchs et al., 2008
for a similar procedure). Hemisphere effects of the attentional modulation of the ASSR were analyzed by comparing the amplitudes difference (‘attend auditory’ minus ‘ignore auditory’) averaged across left (F3, F5, FC3, FC5, C3, C5) and right (F4, F6, FC4, FC6, C4, C6) electrodes via a paired, two-tailed t-test.
In contrast to the auditory modality a stable topographical distribution of the SSVEP amplitude maxima was observed in the mean between conditions when visual stimulation was attended and when it was ignored (meaning the auditory stimulation was attended). Thus, for statistical analysis of the SSVEP, identical electrodes (O1, O2, PO7 and PO8) were chosen for each subject from occipital channels exhibiting the highest 7.5-Hz amplitude in the grand-average condition mean (see Figure 3
A). The estimates for the 7.5-Hz SSVEP as well as the 15-Hz SSVEP (the second harmonic response of the fundamental frequency) obtained from the mean across these four occipital electrodes were compared between conditions when visual modality was attended and when it was ignored by paired two-tailed t-tests.
Source analysis. In order to reveal the generators of the 40-Hz ASSR, the 7.5-Hz SSVEP and its second harmonic a source analysis was carried out. Furthermore, source analysis provided information on the cortical regions involved in attentional selection between modalities. We used a volumetric source model of a 3D regular grid consisting of 3244 voxel (7 mm grid spacing). Based on this model sources are estimated by means of a Discrete Spline EEG inverse solution known as Variable Resolution Electromagnetic Tomography (VARETA, Bosch-Bayard et al., 2001
) for each condition and frequency. This method appraises the spatially smoothest intracranial primary current density distribution corresponding to the observed scalp topographies and restricts the allowable solutions to the gray matter, based on the probabilistic brain tissue maps available from the Montreal Neurological Institute (Evans et al., 1993
). These calculations were based on the complex Fourier-coefficients for each frequency in the time-windows as described above. Areas of significant activation were identified by means of voxelwise Hotelling T2 tests (Hotelling, 1931
) against zero done for all three frequencies and both attentional conditions separately. In addition, the same method was used to localise the attention effect at 40 Hz and 15 Hz as well as hemispheric differences of the attention effect at 40 Hz. Corresponding statistical parametric maps (SPMs) were constructed based on the output of the T2 tests with a significance threshold of α = 0.001. Activation threshold was corrected for multiple comparisons by means of Random Field Theory (Worsley et al., 1996
). Standard electrode coordinates from the 10–20 system were employed in the above described calculations.
Behavioral Data
Average hit rates were 89.4% (±1.7%) for the auditory task and 93.1% (±1.2%) for the visual task. During the auditory task subjects made on average 9.2 (±3.1) false alarms, and 11.2 (±2.9) false alarms during the visual task. Statistical comparisons of hit rates and number of false alarms between auditory and visual task did not yield significant differences (hits: t(13) = −1.53, P = 0.15; false alarms: t(13) = −0.19, P = 0.85).
Electrophysiological Data
A schematic illustration of the ASSR and SSVEP waveforms for one typical subject are shown in Figure 2
. These waveforms were averaged between 500 and 2900 ms after stimulus onset, using a moving-window technique (e.g., Morgan et al., 1996
; Müller et al., 1998a
). Window length was 400 ms, thus including 16 cycles of the 40-Hz ASSR, 3 cycles of the 7.5-Hz SSVEP and 6 cycles of the 15-Hz SSVEP (second harmonic response), respectively.
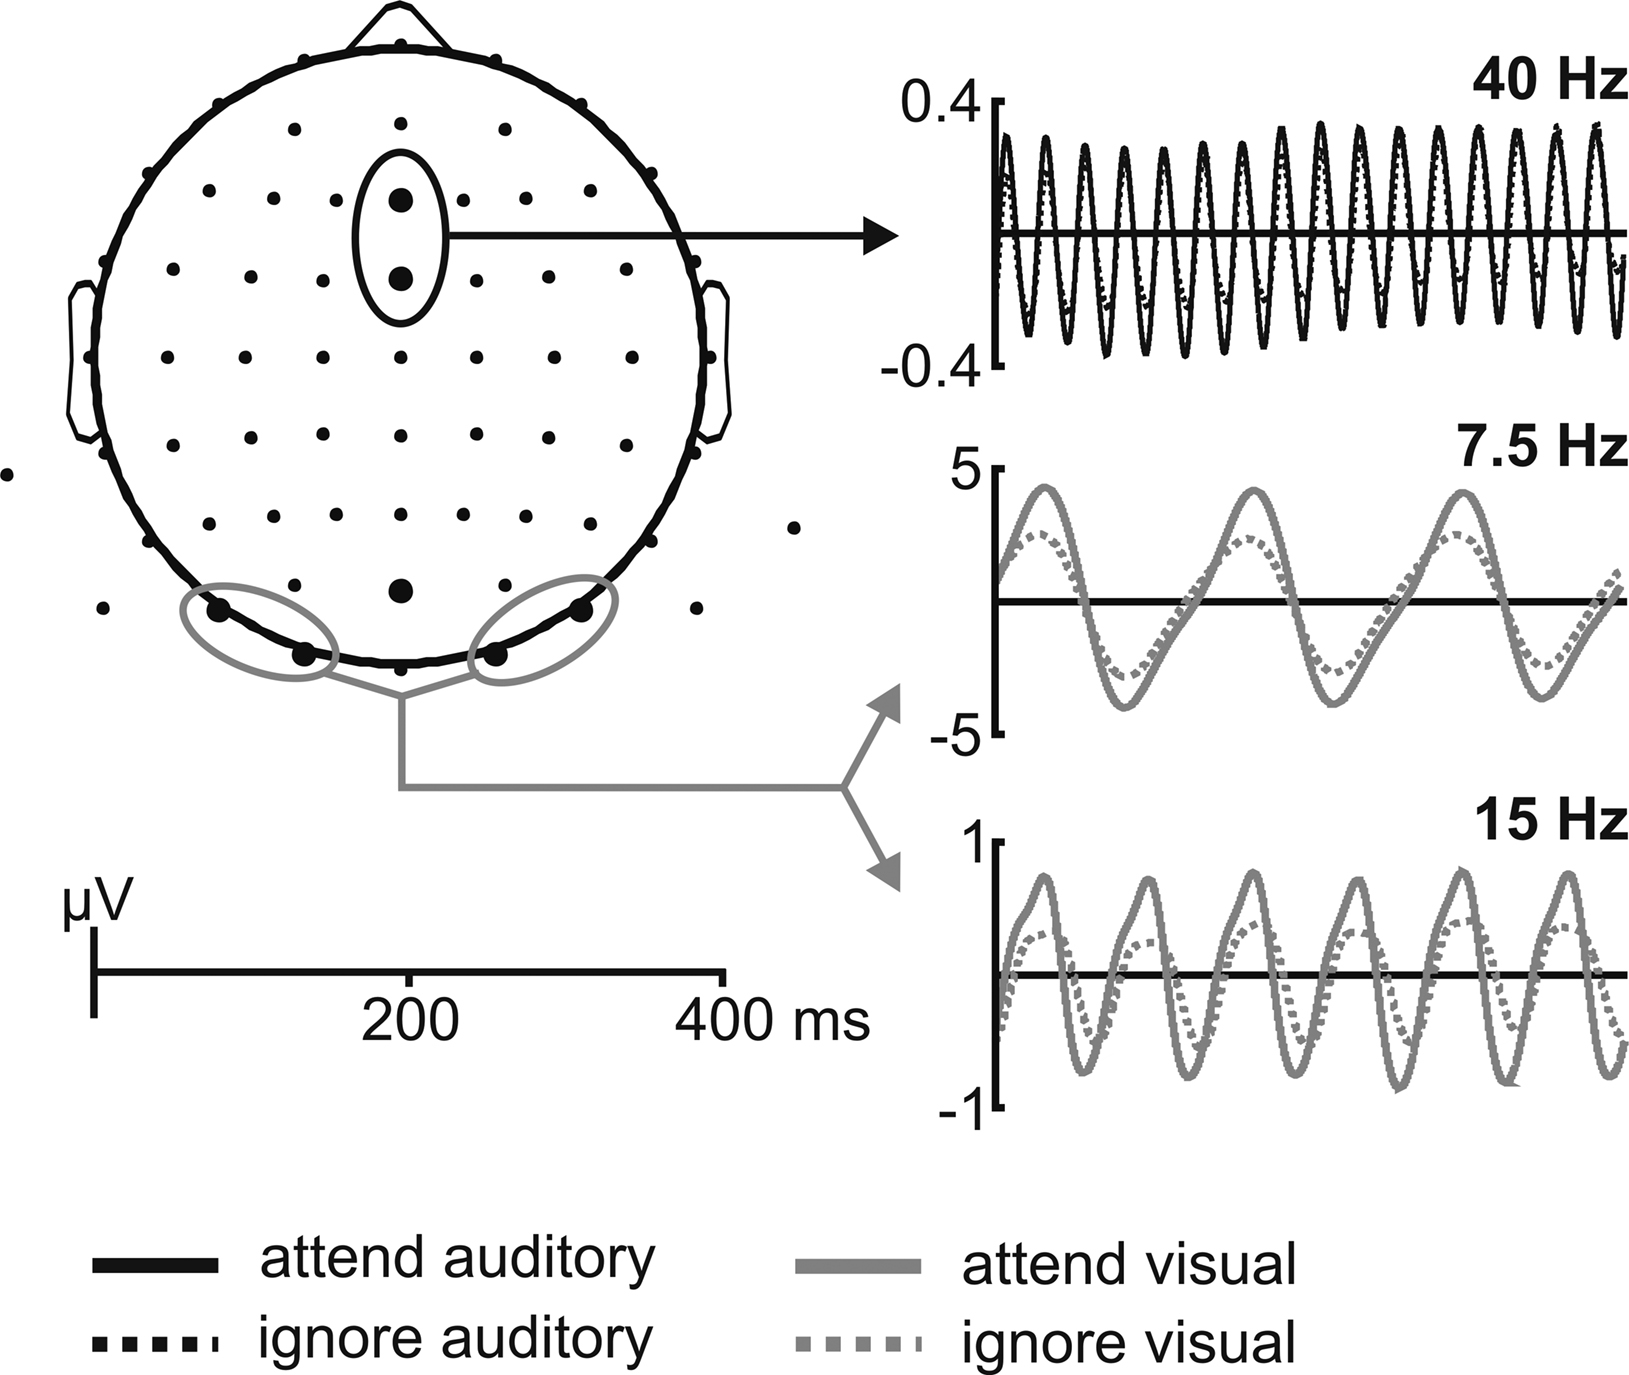
Figure 2. Schematic illustration of the ASSR and SSVEP waveforms at the respective electrode positions. 40-Hz ASSR (black lines), 7.5-Hz SSVEP and 15-Hz SSVEP (grey lines) waveforms for one representative subject, extracted by moving window averages when one modality was either attended (solid line) or ignored (dotted line) averaged across the respective electrode clusters. Analyzed electrode clusters are indicated by the black (for ASSR) and grey (for SSVEP) circles.
ASSR
The topographical scalp distribution of the 40-Hz ASSR across all subjects is shown in Figure 3
for the mean across conditions when auditory modality was attended and when it was ignored (Figure 3
A), as well as for the difference (attend minus ignore) between conditions (Figure 3
B). A frontocentral scalp distribution with maximum over Fz, F1, F2, FCz, FC1 and FC2 was observed in the mean across conditions as well as in the respective experimental conditions.
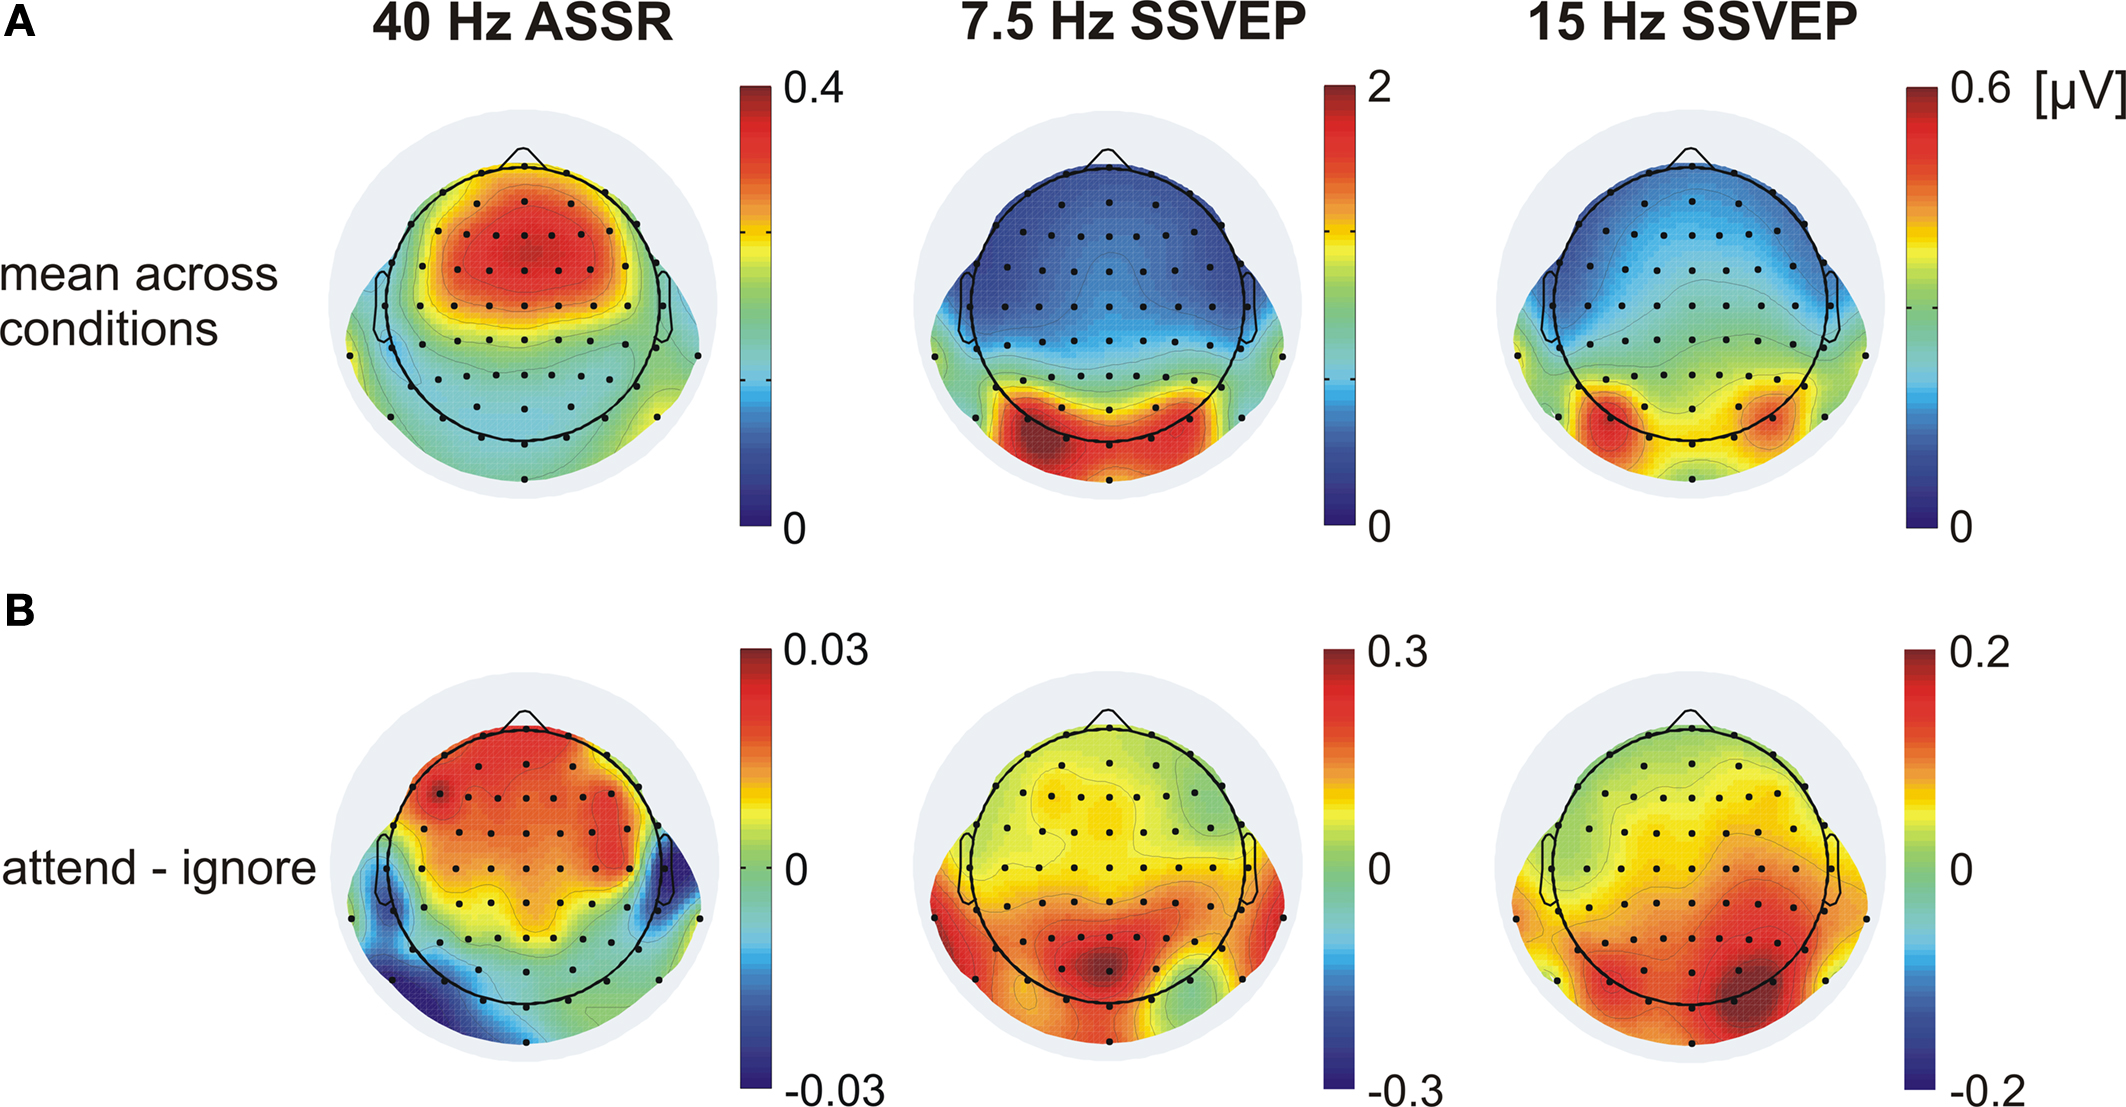
Figure 3. Topographical distribution of the 40-Hz ASSR, the 7. 5-Hz SSVEP and the 15-Hz SSVEP (second harmonic response) averaged across all subjects. (A) Mean across conditions when one modality was either attended or ignored. (B) The difference (attend minus ignore) between conditions. Note different scales.
Attention to the auditory stimulus stream significantly enhanced ASSR amplitudes (t(13) = 2.63, P < 0.05, for the grand-average spectrum see Figure 4
). The difference topography (attend minus ignore) of the ASSR (Figure 3
B) shows a broad frontocentral and parietocentral distribution of the attention effect of the ASSR with no hemisphere dominance (t(13) = 0.98, P = 0.34).
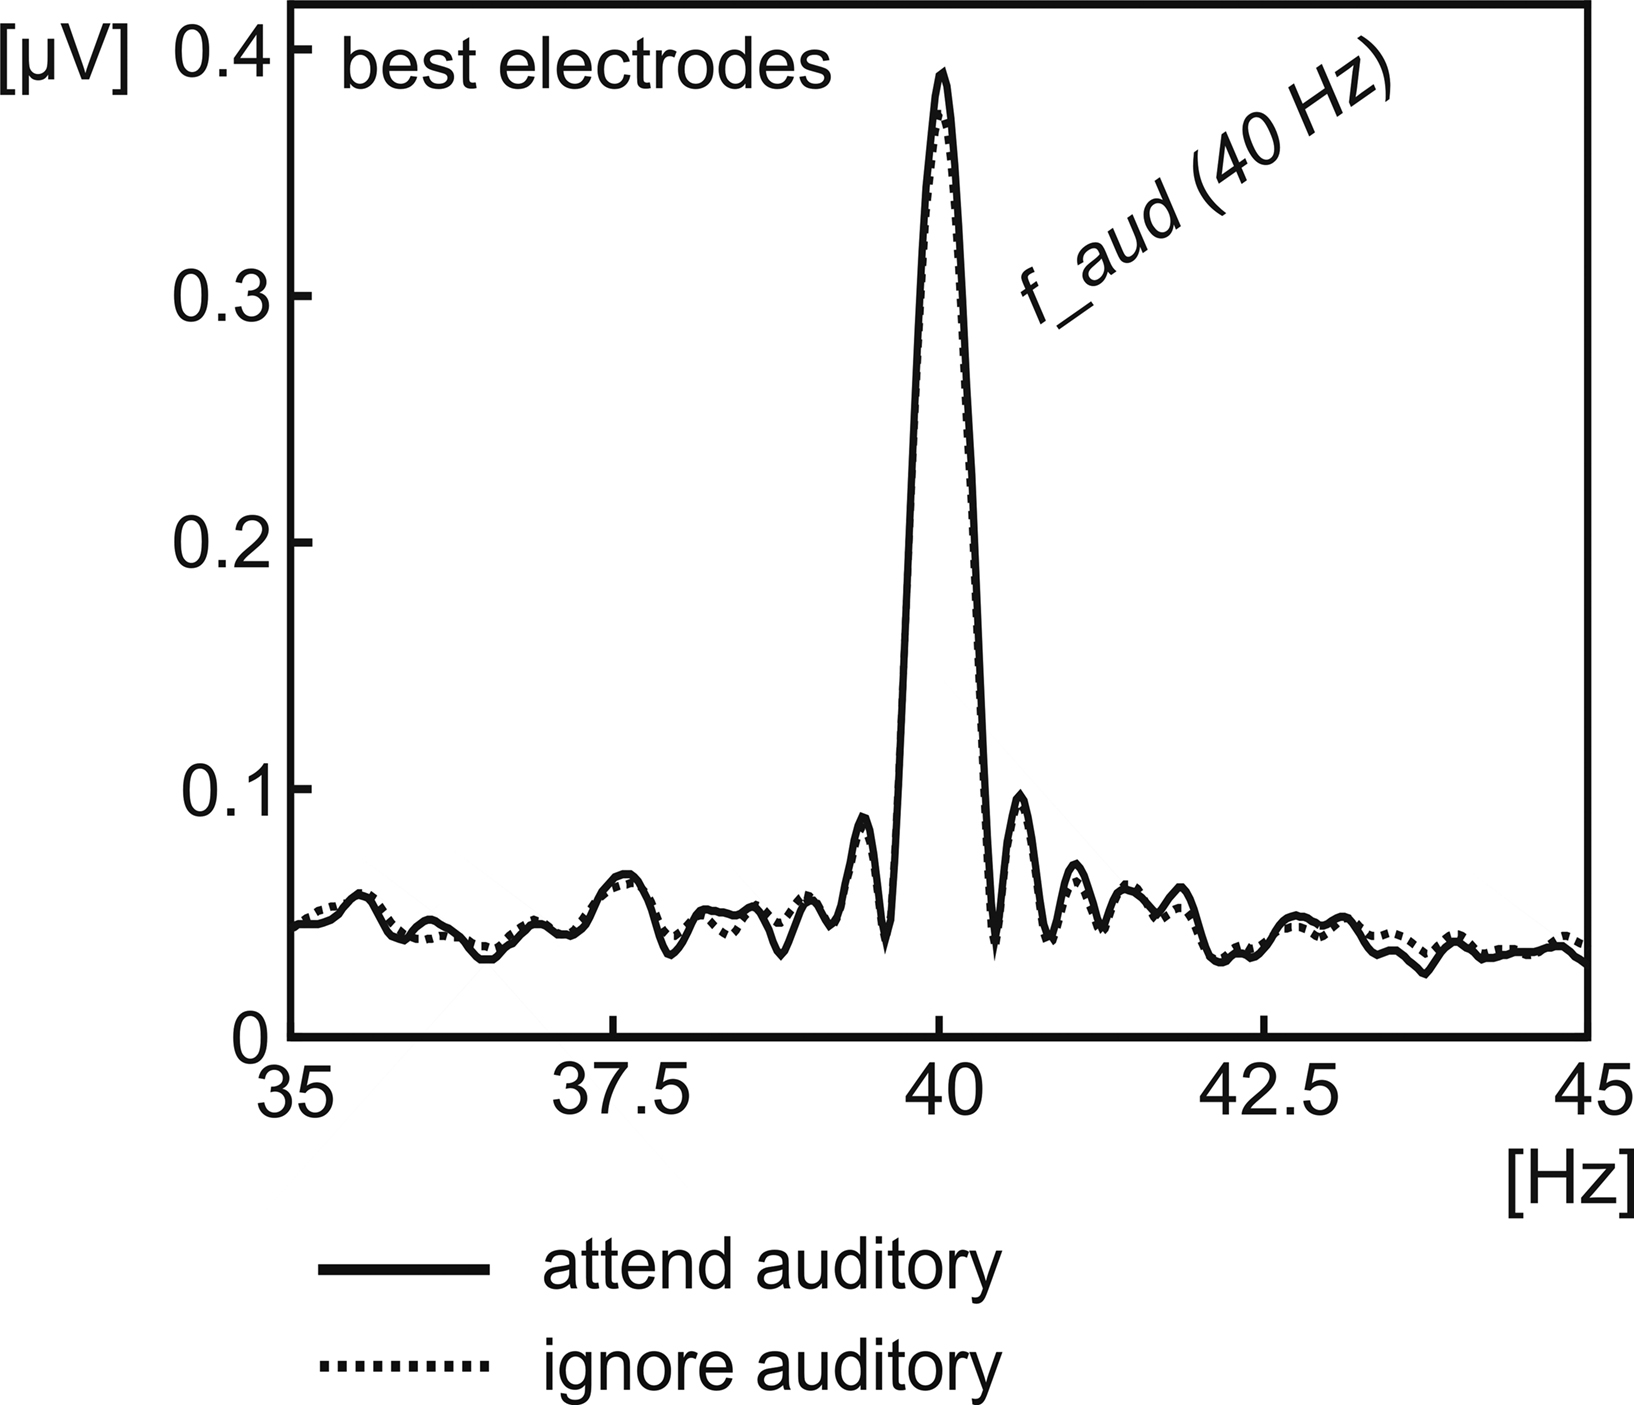
Figure 4. Signal amplitude of the 40-Hz ASSR averaged across all subjects. Amplitude was extracted for the conditions, when the auditory stream was either attended (solid line) or ignored (dotted line) by Fourier-Transformation, averaged across two individual adjacent electrodes, chosen from frontocentral channels exhibiting the highest 40-Hz amplitude in the mean across conditions.
SSVEP
The topographical scalp distribution of the 7.5-Hz SSVEP averaged across all subjects can be seen in Figure 3
A for the mean across the conditions when the visual modality was attended and when it was ignored. A bilateral occipitoparietal scalp distribution with one maximum over O1 and PO7 and one maximum over O2 and PO8 was observed in the mean across conditions as well as in the respective experimental conditions. Because the effects did not differ between these two maxima (t(13) = 1.58, P = 0.14), the activity of all four channels was averaged.
Figure 5
depicts the grand-average spectrum showing the signal amplitude for the 7.5-Hz SSVEP and its harmonics of the mean of four electrodes with highest amplitudes (O1, O2, PO7 and PO8) (Figure 5
A). At these electrode positions no attention effect can be observed for the 7.5-Hz SSVEP (t(13) = 0.29, P = 0.39). However, the iso-contour voltage map of the difference between conditions (Figure 3
B) seems to indicate an attentional modulation of the 7.5-Hz SSVEP at more parietal locations. Statistical comparison between conditions at POz (Figure 5
B) identifies a trend towards an attentional modulation of the 7.5-Hz SSVEP (t(13) = 1.89, P = 0.07).
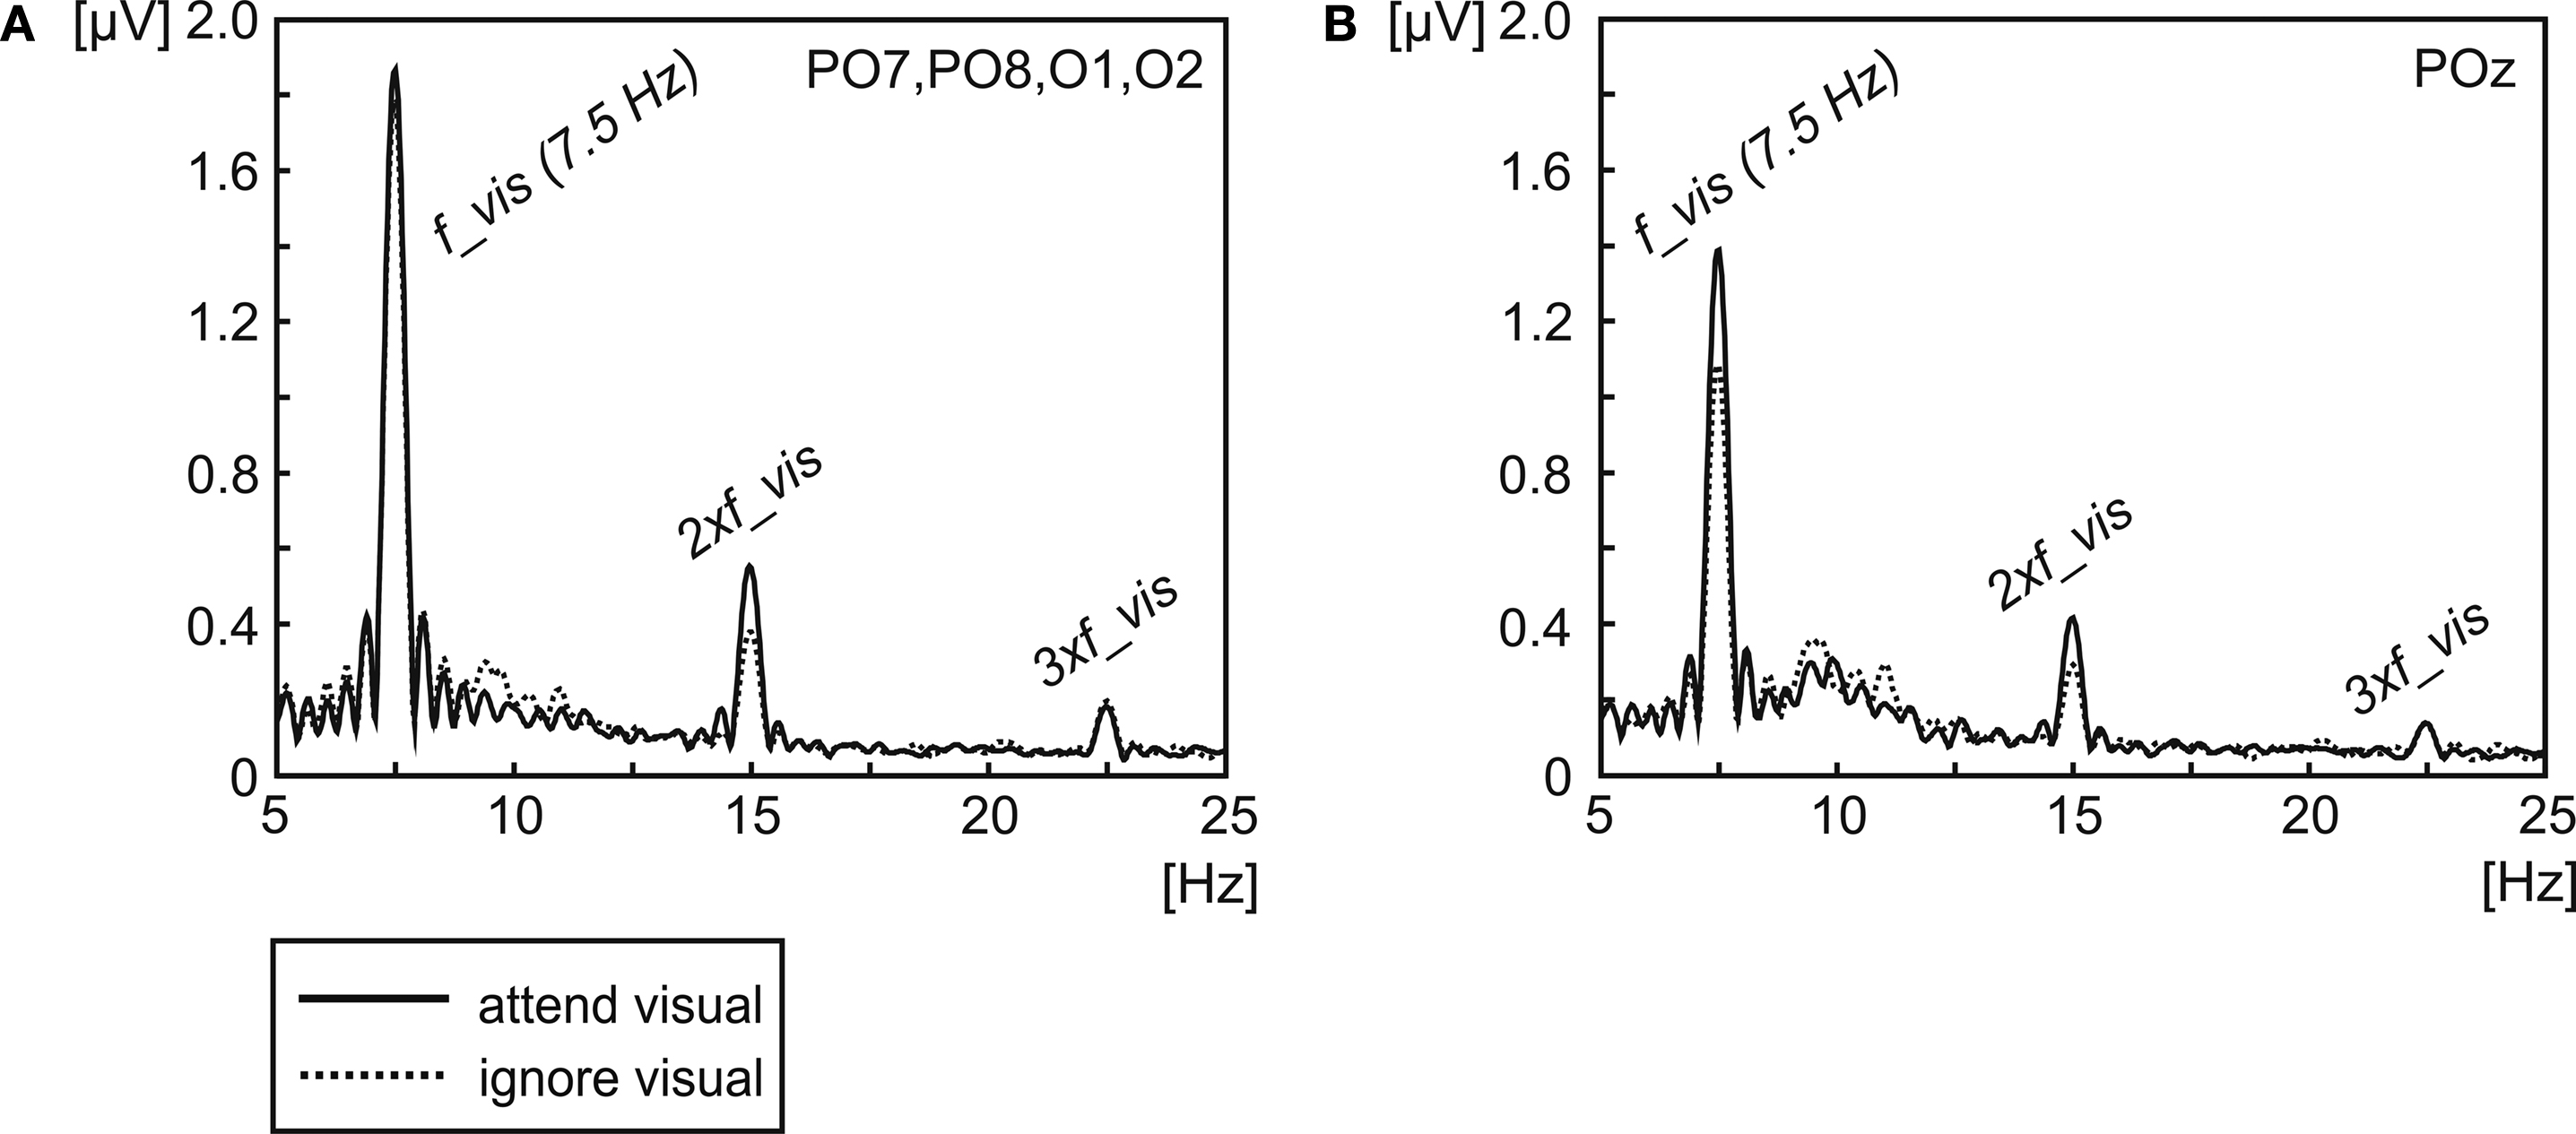
Figure 5. Signal amplitude of the 7.5-Hz SSVEP and its second and third harmonics (15 Hz and 22.5 Hz) averaged across all subjects. Amplitude was extracted for the conditions, when the visual stream was either attended (solid line) or ignored (dotted line) by Fourier-Transformation, averaged across the electrodes demonstrating the highest amplitude in the mean across conditions [O1, O2, PO7 and PO8, (A)] and the electrode position demonstrating the highest (but only marginal significant) difference between attentional conditions at 7.5 Hz [POz, (B)].
The amplitude spectrum (Figure 5
) shows a clear peak of the second harmonic response (15-Hz activity) of the 7.5-Hz SSVEP. Interestingly, the inspection of the topographical distribution of the 15-Hz activity (Figure 3
) shows that the scalp location of the greatest difference between conditions differs to some extent between 7.5 Hz and the second harmonic response. The topographical distribution of the 7.5-Hz SSVEP indicates a slight variation between the location of the highest amplitude and of the greatest (but only marginal significant) difference between attentional conditions with the maximum over POz. In contrast, the biggest attentional modulation of the 15-Hz activity is located at occipitoparietal electrodes (O1, O2, PO7 and PO8) with basically no difference to electrodes that exhibited the biggest amplitudes. Statistical comparison between conditions when the visual modality was attended or when it was ignored across the mean of these electrodes revealed a significant amplitude modulation of the second harmonic (t(13) = 2.70, P < 0.02).
Source analysis
To investigate the generators of the ASSR and the SSVEP, as well as brain areas modulated by attention a source analysis was carried out. Figure 6
A depicts the statistical parametric maps (SPMs) for the ASSR for the conditions when subjects attended or ignored the auditory stream, as well as for the difference between both conditions. The maxima in both conditions were located in the areas containing the right and left superior temporal gyrus and Heschl’s gyrus, areas that include the auditory cortex. Beyond this area, activation was also found to be significant in the inferior frontal gyrus, the precentral gyrus and the insula, as well as in the middle temporal gyrus of both hemispheres. Attentional modulation of the ASSR was found to be maximal in the right superior temporal gyrus/Heschl’s gyrus, with additional modulations of the lateral occipitotemporal gyrus, the inferior and middle temporal gyrus in the right hemisphere. Further maxima of attentional modulations were found to be in the left and right middle/inferior frontal gyrus (see Table 1
for MNI coordinates of the centres of gravity). Statistical parametric maps reveal significant differences in the distribution of the attentional modulations between left and right hemisphere (Figure 6
B).
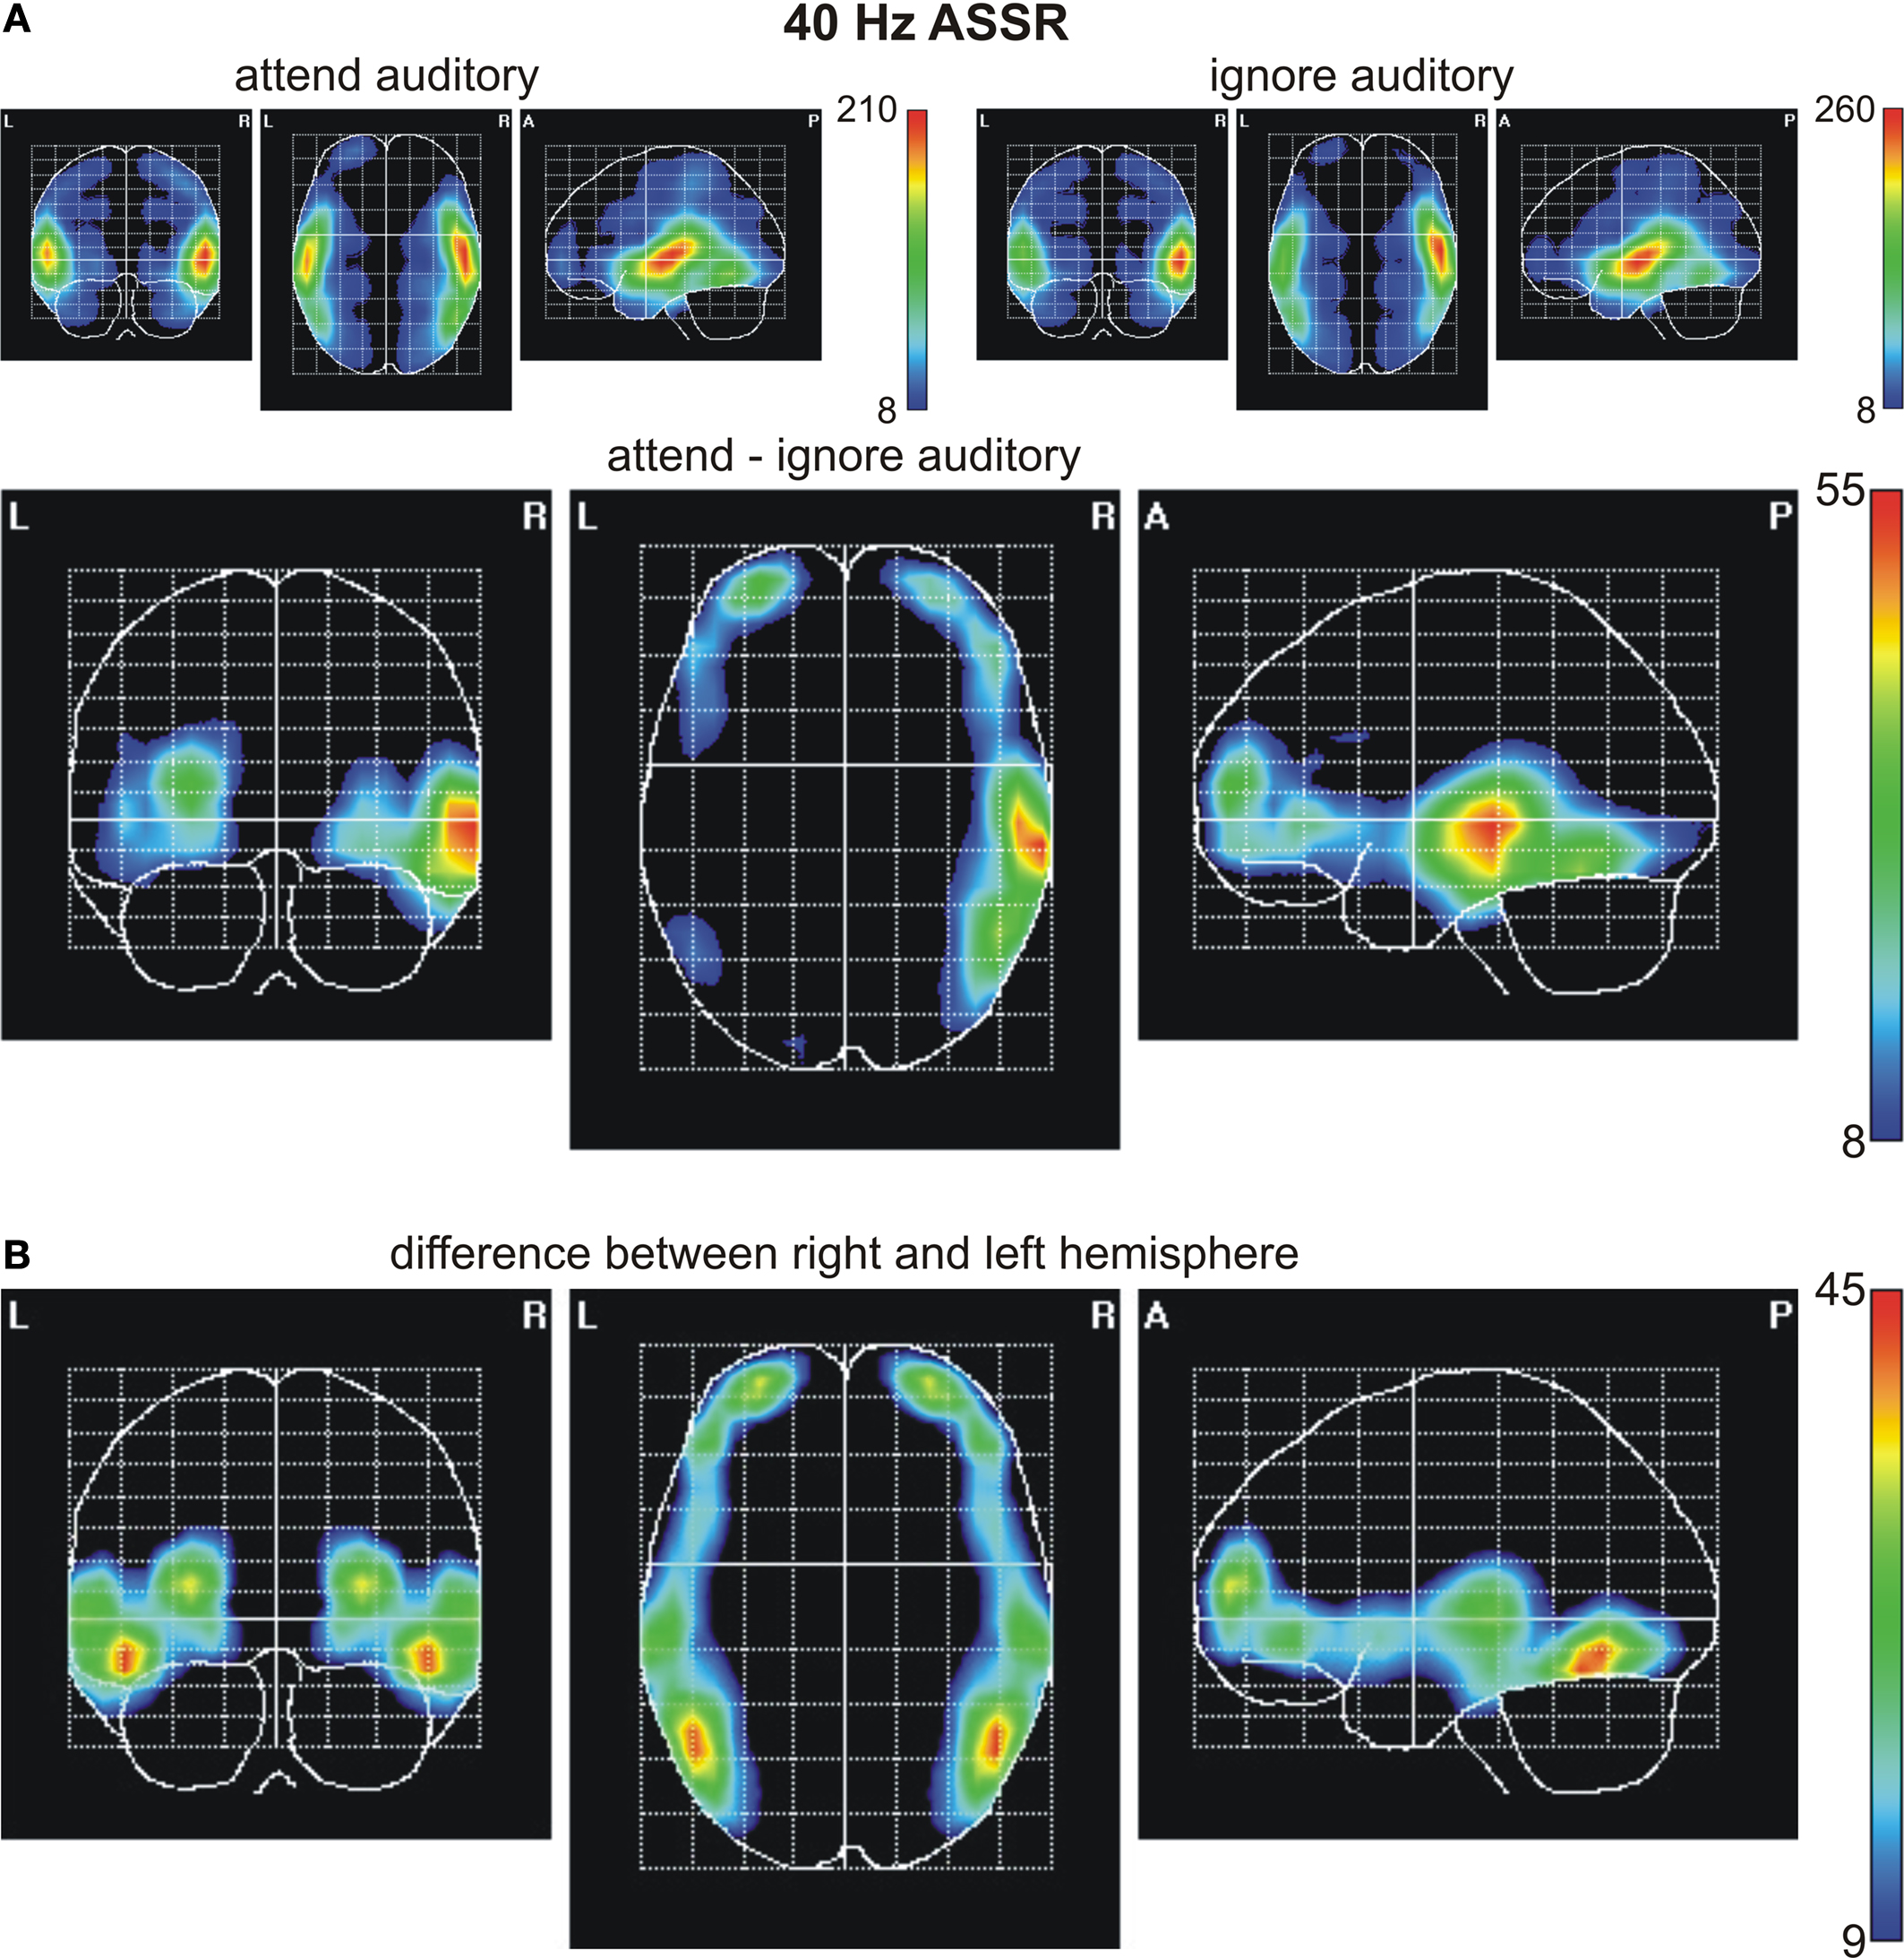
Figure 6. Statistical parametric maps of significant voxels of the inverse solution of the 40-Hz ASSR across all subjects for (A) the conditions when one modality was either attended or ignored and the difference values between conditions (attend minus ignore), and (B) for voxels, in which the deviation between conditions differed significantly between the right and left hemisphere. Scales represent t2-values (Hotelling, 1931
). A significance threshold of α = 0.001, corrected for multiple comparisons, was applied. Note different scales.
SPMs for the conditions when subjects attended or ignored the visual stream are given in Figure 7
for the 7.5-Hz SSVEP (Figure 7
A) and the second harmonic (15-Hz SSVEP, Figure 7
B). In addition, Figure 7
B depicts the SPM for the attention effect (attend minus ignore visual) for the second harmonic as well. The foci of activation in the conditions ‘attend visual’ and ‘ignore visual’ are located in the inferior occipital gyrus/lateral occipitotemporal gyrus of the left and right hemisphere for both the fundamental frequency and its second harmonic. To test the similarity of the involved cortical areas in the generation of the fundamental frequency and its second harmonic response we calculated the correlation coefficients between the t2-values of all voxels for each condition between both frequencies. Correlation coefficients of 0.94 in the ‘attend visual’ condition and 0.91 in the ‘ignore visual’ condition indicate a highly similar activation pattern for the fundamental frequency and its second harmonic response. Because the fundamental frequency exhibited no robust attentional modulation in our previous test, the source analysis of the attention effect for the visual modality was focused on the second harmonic response exclusively. Comparable to the maximal location in the respective conditions, attentional modulation of the 15-Hz activity was mainly present in the inferior occipital gyrus and the lateral occipitotemporal gyrus of both hemispheres. Further attentional modulations were found to be significant in the middle and superior temporal gyrus and the occipital poles of the left and right hemispheres.
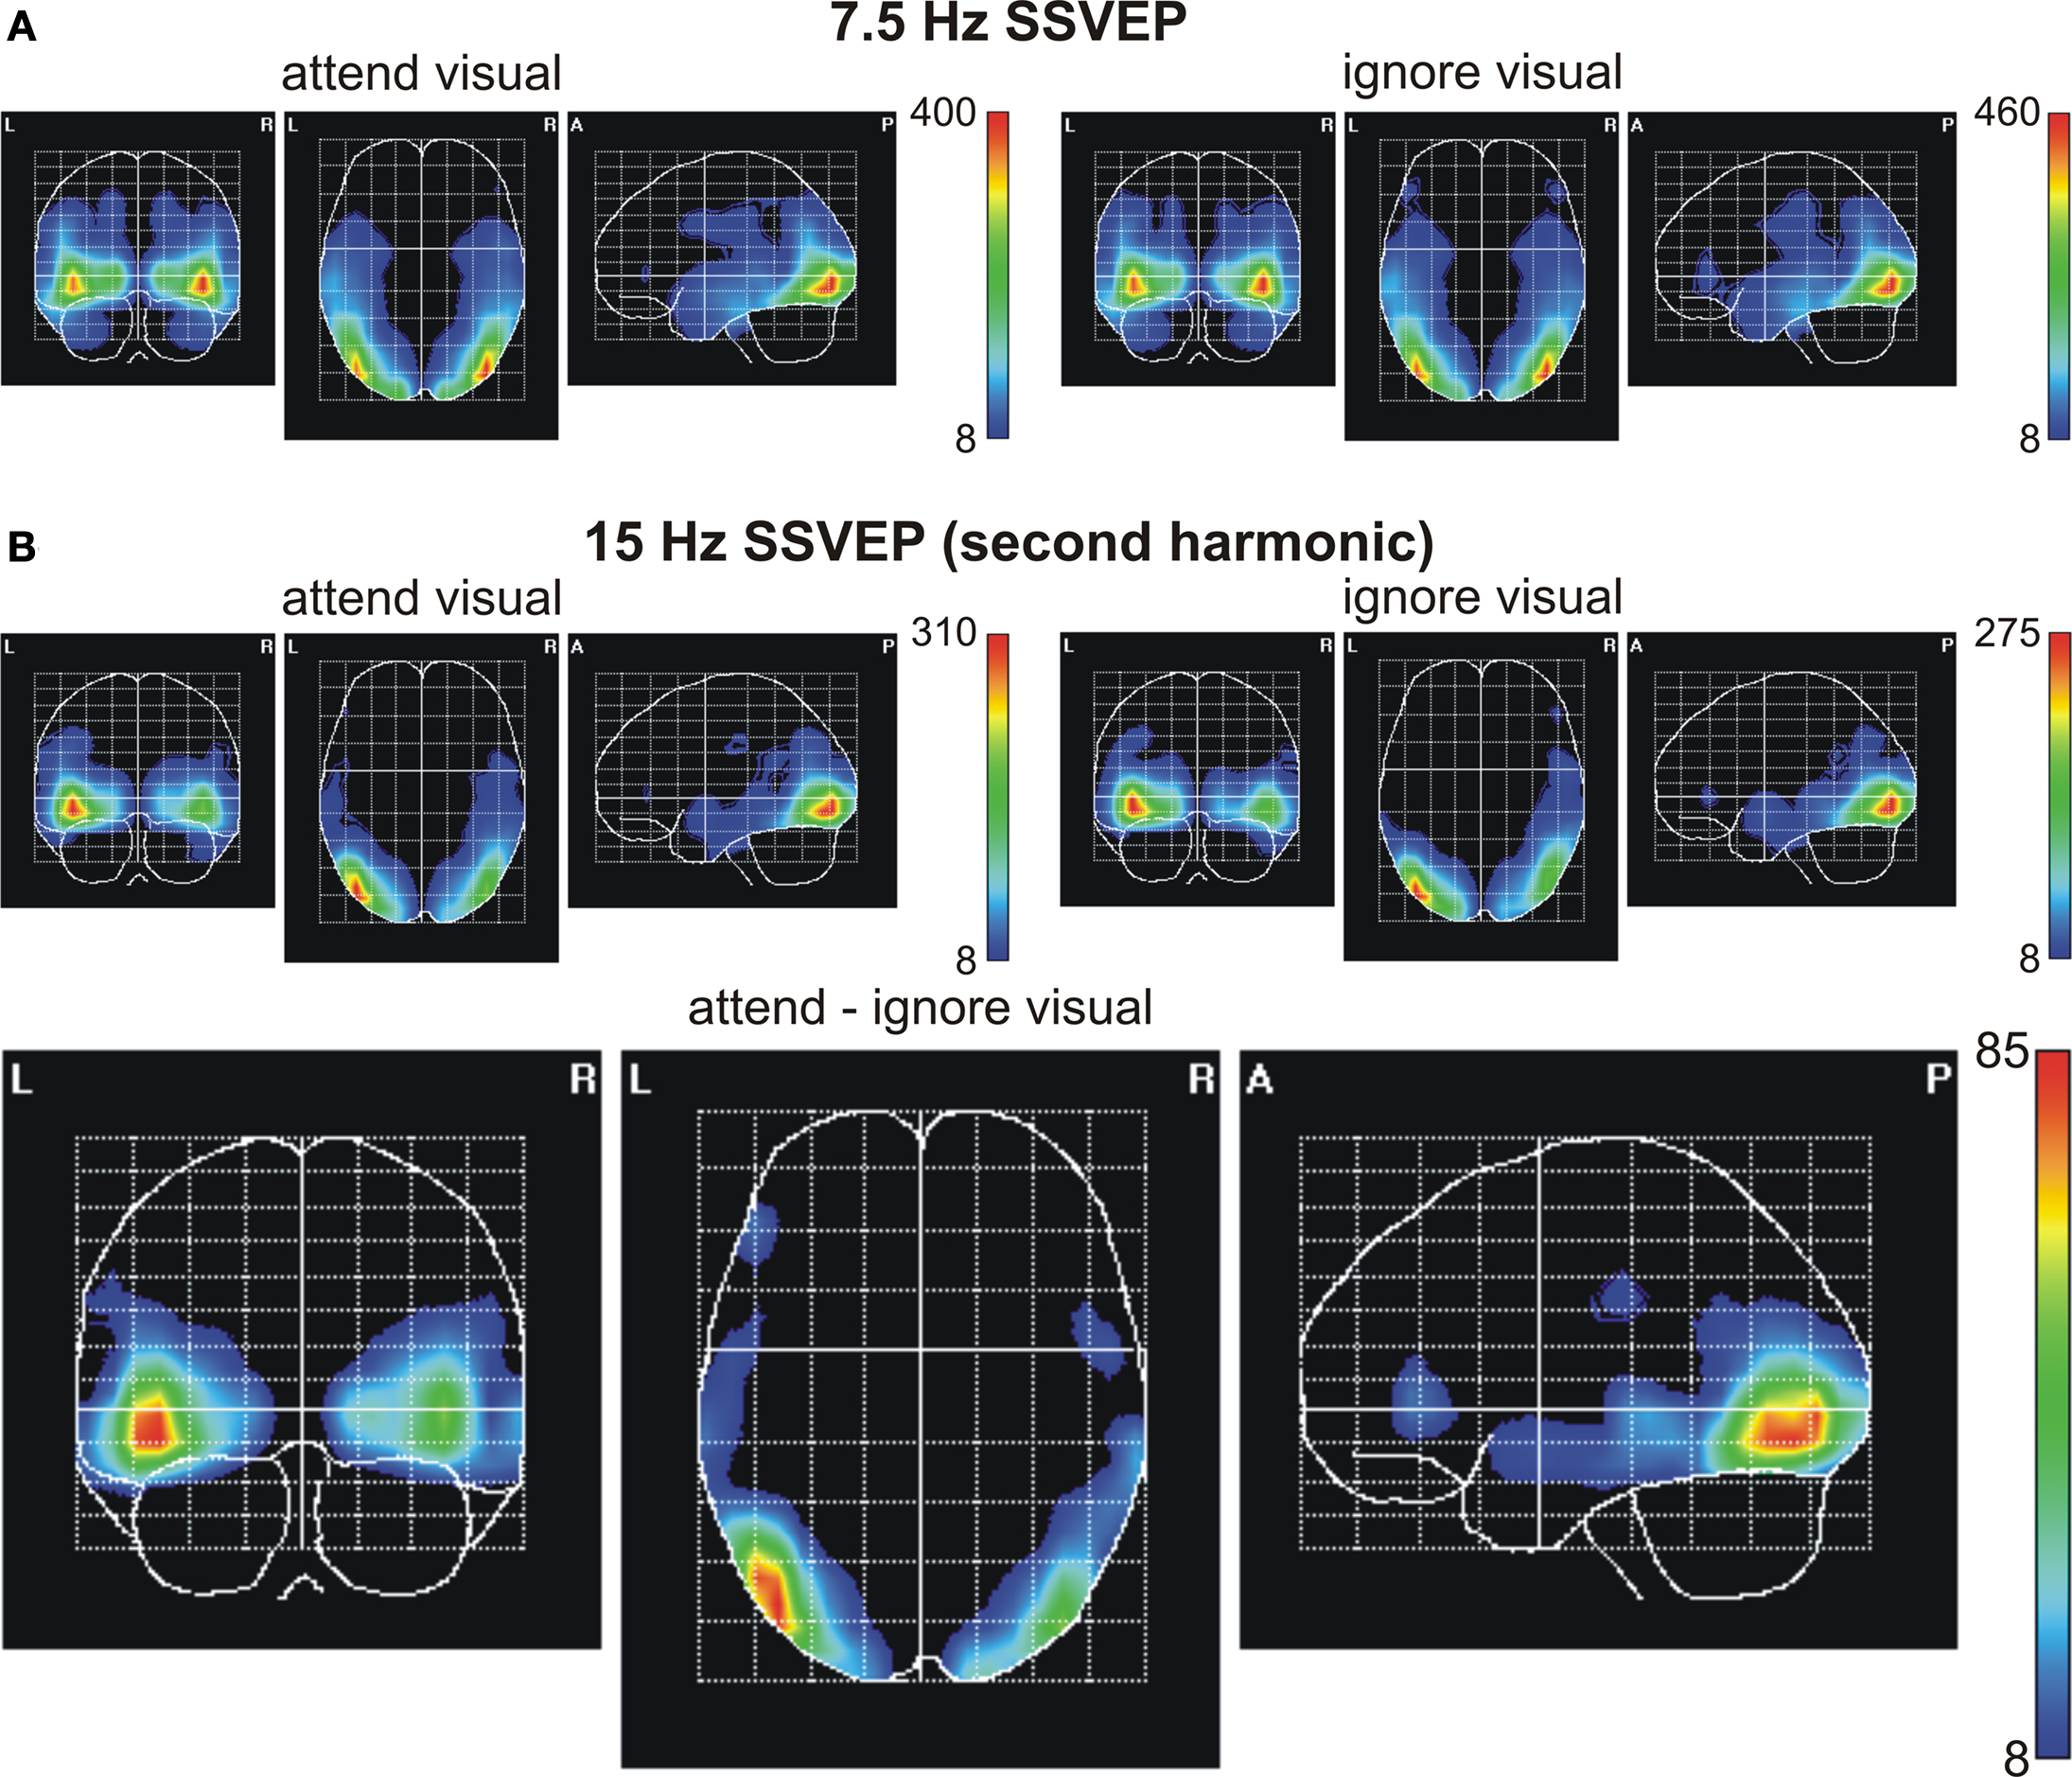
Figure 7. Statistical parametric maps of significant voxels of the inverse solution of the 7.5-Hz SSVEP (A) and the 15-Hz SSVEP [second harmonic, (B)] across all subjects for the conditions when one modality was either attended or ignored, and the difference values between conditions (attend minus ignore) for the second harmonic of the 7.5-Hz SSVEP. Scales represent t2-values (Hotelling, 1931
). A significance threshold of α = 0.001, corrected for multiple comparisons, was applied. Note different scales.
In a further, more explorative step, we plotted voxels that were significantly modulated by attention for both the ASSR and the 15-Hz SSVEP (Figure 8
) to look for supramodal activity. As visible in Figures 6 and 7
, the displayed activation for the 40-Hz ASSR and the 15-Hz SSVEP, as well as the attention effect of both responses seems to be quite widespread, possibly even beyond the real activated/modulated cortical areas. This effect might be a result of some smearing what also might result to “ghost” overlaps between sources for ASSR and SSVEP. To minimize such smearing effects between sources of the ASSR and 15-Hz SSVEP, a higher significance threshold (P = 0.0005) was applied. Overlapping areas were found in both hemispheres in the lateral occipitotemporal gyrus, the inferior, middle and superior temporal gyrus; in the right inferior occipital gyrus and in the left inferior frontal gyrus.
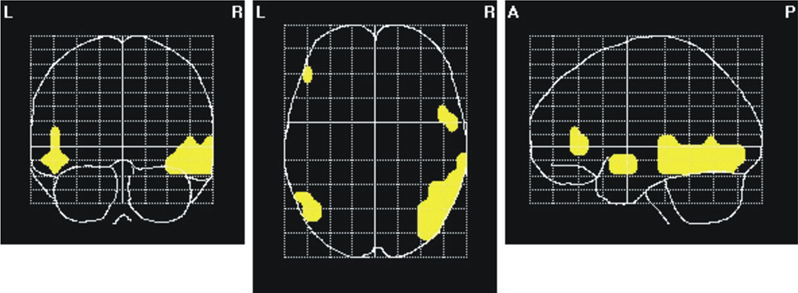
Figure 8. Areas of overlapping attentional modulation between 40-Hz ASSR and 15-Hz SSVEP (second harmonic). Yellow marks represent voxels significantly different between conditions when one modality was attended or ignored for both, the ASSR and the 15-Hz SSVEP. A significance threshold of α = 0.0005, corrected for multiple comparisons, was applied.
In the present experiment we examined the attentional modulation of concurrently presented visual and auditory stimuli when subjects had to attend to one modality for several seconds while ignoring the other modality. We presented repetitive visual and auditory stimuli that simultaneously elicited the ASSR and the SSVEP. We found that the amplitude of the steady-state response was significantly increased when the respective stimulus stream was attended compared to when that stream was ignored. In other words: Attention to sounds led to a significant enhancement of the ASSR amplitude compared to when the visual letter stream was attended. Vice versa, the SSVEP amplitude increased when the letter stream was attended compared to when it was ignored, i.e. the auditory modality was relevant.
Previous evidence for the attentional modulation of ASSR resulted from purely auditory stimulation designs, (Bidet-Caulet et al., 2007
; Skosnik et al., 2007
) as well as intermodal attention designs (Ross et al., 2004
; Saupe et al., 2009
). Also attentional modulation of the SSVEP has often been demonstrated during intramodal (e.g., Morgan et al., 1996
; Müller et al., 1998a
, 2006
; Müller and Hübner, 2002
) as well as intermodal attention (Talsma et al., 2006
) designs. However, the present study is to our knowledge the first to demonstrate concurrent intermodal attention effects upon the ASSR and SSVEP.
ASSR
In agreement with previous EEG studies that used binaural stimulation (Griskova et al., 2007
; Saupe et al., 2009
), we observed a frontocentral distribution of the 40-Hz activity for the auditory modality with no dominance of either hemisphere in the iso-contour voltage maps. Our source analyses indicate generators of the ASSR in an area containing the superior temporal gyrus and the Heschl’s gyrus, the location of the auditory cortex. This is in line with a previous PET study, in which repetitive auditory stimulation elicited regional cerebral blood flow increase in the area of the primary auditory cortex and in the superior temporal gyrus, surrounding the primary auditory cortex, as well as in the postcentral gyrus, inferior temporal gyrus and the posterior Sylvian area (Pastor et al., 2002
). Further studies referred generators of the ASSR to or close to the primary auditory cortex (Hari et al., 1989
; Pantev et al., 1993
, 1996
; Ross et al., 2005
) or anatomically to the Heschl’s gyrus (Gutschalk et al., 1999
; Bidet-Caulet et al., 2007
), respectively. The source localization (reconstruction) method employed here generally lacks the spatial resolution necessary for finer distinguishment between superior temporal gyrus and Heschl’s gyrus.
In the present study iso-contour voltage maps exhibit a symmetric attentional modulation of the ASSR (difference between ‘attend auditory’ condition and ‘ignore auditory’ condition). Interestingly, in contrast to previous studies (Ross et al., 2004
; Bidet-Caulet et al., 2007
; Müller et al., 2009
) source analysis found the focus of the attentional modulation to be lateralized in the right superior temporal gyrus/Heschl’s gyrus.
Several previous studies that investigated the asymmetrical processing of acoustical features revealed a specialization of the left hemisphere for rapid temporal processing (Robin et al., 1990
; Samson et al., 2001
; Zatorre and Belin, 2001
) and a right-hemispheric specialization for spectral processing (Robin et al., 1990
; Johnsrude et al., 2000
; Zatorre and Belin, 2001
). In line with these findings an asymmetry toward the right hemisphere was observed for stimuli containing melodic information, whereas noise and constant pitch stimuli rather lead to a bilateral activation of the auditory cortices (Patterson et al., 2002
). Considering these previous studies and the fact that the stimuli we used in the present study contained only little spectral information but reveal a high temporal structure, one could expect a rather left-hemispheric dominance for the attention effect. On the other hand, the ASSR reflects the periodic structure of the auditory stimulus, therefore Ross et al. (2005)
assumed a right-hemispheric specialization for processing the temporal periodicity of a sound, and speculated, that the ASSR may play a role for pitch processing based on stimulus regularities. In the present study targets were changes in the amplitude modulation embedded in longer sequences with a standard modulation frequency. Targets had an identical carrier frequency (500 Hz) compared to the standard stimulus train. Nevertheless, the change in stimulation frequency seemed to be perceived as a change in pitch for several of our subjects. This effect might have its source in the shift of the sidebands, which surrounds the carrier frequency due to the amplitude modulation. The subjective perception of a change in pitch and the possibility that subjects choose the strategy to detect targets by means of pitch changes could cause the location of the attention effect in the right hemisphere here.
SSVEP
The 7.5-Hz SSVEP and its second harmonic (15-Hz SSVEP) were found to be maximal over occipital and/or parieto-occipital electrodes. Statistical parametric maps of the inverse solution indicate the focus of both the 7.5-Hz SSVEP and the second harmonic response in the inferior occipital gyrus and the lateral occipitotemporal gyrus, respectively. The high correlation coefficient between activated voxels for both frequencies seems to indicate similar generators for the fundamental and the harmonic frequency, although the topographical distribution showed some slight differences.
Our finding of practically similar sources is in agreement with one MEG study, in which harmonic responses have been found in the same voxels that were activated by the fundamental response (Fawcett et al., 2004
). However, contrary results have also been reported. In a combined EEG/PET study evidence for different sources of the fundamental and the harmonic frequencies was found (Pastor et al., 2007
). Although these authors found partially overlapping regions in the primary visual cortex to be activated by the fundamental and the harmonic component, the source for the harmonic response was found to be located more rostrodorsal to the source of the fundamental frequency in the rostral portion of the calcarine sulcus and the inferior half of the parieto-occipital sulcus.
Interestingly, in the present study attentional modulation of the SSVEP was found to be more robust at the second harmonic frequency; whereas the amplitude of the fundamental frequency was only modulated by trend. Ding et al. (2006)
suggested that different flicker frequencies activate different cortical networks and that these networks possess different sensitivities to attention. In this study an increase in SSVEP amplitude was only observed for frequencies in the delta band (2–4 Hz) and in the upper alpha band (10–11 Hz), whereas flicker frequencies in the lower alpha band (8–10 Hz) elicited even a decrease in SSVEP amplitude. In contrast, no attentional modulations were found for frequencies between 5 and 7 Hz in this study. However, this is in contrast to studies that demonstrated high attentional sensitivity for SSVEP amplitudes around 7 Hz (Müller and Hübner, 2002
; Müller et al., 2006
). Furthermore, multiple studies investigating attentional modulations for SSVEP elicited in different frequency bands did not find any differences regarding the sensitivity of the SSVEPs (Müller et al., 2003
; Andersen et al., 2008
; Toffanin et al., 2009
). Also the high correlation between cortical activations elicited by the 7.5-Hz and the 15-Hz SSVEP in the present study speaks against the involvement of different cortical networks. However, because we presented only one driving frequency for each modality we can not draw any conclusion about the dependency of attentional modulations on the driving frequency.
When we looked at the sources of the second harmonic we found this response maximally modulated by attention in extrastriate visual areas. This is highly comparable to a study conducted by Hillyard et al. (1997)
, in which attentional modulations of the SSVEP were found to be maximal in the fusiform/inferior occipital gyri and the medial occipital/inferior-medial temporal gyri, with no modulation in the primary visual cortex. However, these sources were reported for the driving frequency. Similar to our study, randomized sequences of alphanumeric characters served as visual stimuli in this study, with a specified character serving as target stimulus. Using a flickering LED (light-emitting diode) display, Müller et al. (1998a)
observed a focal origin of the SSVEP attention effect in the contralateral parieto-occipital cortex. These studies support a model of spatial attention in which visual signals arising from attended locations are facilitated at the level of extrastriate cortical areas but not in the primary cortex itself. However, recent evidence exists demonstrating sources of the SSVEP, as well as the focus of maximal attentional modulation of the SSVEP to be in primary visual cortex (Müller et al., 2006
; Andersen et al., 2008
). As discussed in the Section “Introduction” , a number of ideas exist whether or not there are neural and/or functional differences between the fundamental and second harmonic response (cf. Fawcett et al., 2004
; Pastor et al., 2007
). Furthermore, the source of the attention effect seems to vary with the task as well. From the results of the present study we can conclude that the sources of both responses are highly identical; to what extend different neural mechanisms might contribute to fundamental and higher harmonic responses is subject to future studies.
Intermodal Attention Effects for ASSR and SSVEP
Source analyses demonstrate attentional modulations of the ASSR and the second harmonic response of the SSVEP to be mainly present in modality-specific areas in the present experiment. This argues for a substantial contribution of a modality-specific network in intermodal attention processes. Supporting this, several previous ERP-studies observed modulations by intermodal attention solely in modality-specific cortical areas (Woods et al., 1992
; Eimer and Schröger, 1998
; Talsma and Kok, 2001
). These authors concluded that sustained intermodal attention is a modality-specific phenomenon, in contrast to spatial attention which also includes supramodal mechanisms. In these studies, stimuli in different modalities were presented successively, a limitation of the ERP approach. Successive stimulation creates a highly artificial experimental situation given that in natural environments a selection between competing sensory information is necessary with stimuli that are present without a temporal delay. We assumed that selection under conditions of simultaneous stimulation involves supramodal mechanisms that could not be detected with sequential stimulation.
In a first explorative analysis our results hint indeed for additional supramodal attentional modulations in both hemispheres in the lateral occipitotemporal gyrus, the inferior and middle temporal gyrus, as well as in the right superior temporal gyrus and the right inferior occipital gyrus. Thus, the 40-Hz ASSR seems to be modulated by attention not only in the superior temporal gyrus/Heschl’s gyrus, including the auditory cortex, but also in visual areas, whereas the 15-Hz SSVEP seems to be modulated also in the region where the ASSR was generated. These modality-non-specific activations seem to be dominated by the right cerebral hemisphere in the present experiment.
Several previous studies provided evidence for a major role of the right hemisphere in attention processes, including arousal (Jeeves and Dixon, 1970
; Howes and Boller, 1975
; Heilman and Van Den Abell, 1979
, 1980
; Benton, 1986
), sustained attention (Pardo et al., 1991
; Whitehead, 1991
; Yamaguchi et al., 1994
), spatial attention (Weintraub and Mesulam, 1987
; Bisiach and Vallar, 1988
; Coull and Nobre, 1998
) and divided attention (Vohn et al., 2007
).
Taking this together the present results provide a first explorative indication for the involvement of a supramodal attention network in intermodal attention processes with a right hemisphere dominance. However, because of limitations of the source analysis used in the present experiment these results should be interpreted with caution: Especially the cortical areas activated by the ASSR seem to be unusually widespread compared to previous results, which demonstrated more focal activations (e.g., Pastor et al., 2002
). In the present experiment a distributed source analysis was applied, which prefers diffused sources to some extent. Therefore, it is possible, that the extent of overlap between attentional modulated areas was overestimated in our analysis.
Conclusion
We used the auditory and visual steady-state response to investigate neural mechanisms of intermodal sustained selective attention in the human brain. Our approach allowed us to present auditory and visual stimuli concurrently while subjects had to attend to the one or the other modality. We found increased amplitudes of the steady-state response when the respective modality attended compared to when that modality was ignored. Furthermore, results point into the direction of the involvement of a supramodal attention network in intermodal attention. We believe that the steady-state approach that allows to present stimuli concurrently opens a whole new and exciting avenue of research to uncover basic neural mechanisms of intermodal attention in the human brain.
The authors declare that the research was conducted in the absence of any commercial or financial relationships that could be construed as a potential conflict of interest.
We thank Nelson Trujillo from the Cuban Neuroscience Centre who provided algorithms for the calculation of the inverse solutions. Thanks also to Andreas Widmann and Uwe Hassler for the technical support. The experiment was realized using Cogent 2000 developed by the Cogent 2000 team at the FIL and the ICN. Processing of EEG data was performed using the EEGLab toolbox (Delorme and Makeig, 2004
) in combination with custom routines written in Matlab (The Mathworks, Natick, Massachusetts). This work was supported by a stipend of the German Research Foundation (graduate program “Function of attention in cognition”; DFG 1182).
Bosch-Bayard, J., Valdes-Sosa, P., Virues-Alba, T., Aubert-Vazquez, E., John, E. R., Harmony, T., Riera-Diaz, J. and Trujillo-Barreto, N. (2001). 3D statistical parametric mapping of EEG source spectra by means of Variable Resolution Electromagnetic Tomography (VARETA). Clin. Electroencephalogr. 32, 47–61.