 Jorge Gaete1,2*
 Daniela Valenzuela2
 María Inés Godoy3
 Cristian A. Rojas-Barahona4
 Christina Salmivalli5
 Ricardo Araya6
- 1Faculty of Education, Universidad de los Andes, Santiago, Chile
- 2Millennium Nucleus to Improve the Mental Health of Adolescents and Youths, Imhay, Santiago, Chile
- 3Departamento de Evaluación, Medición y Registro Educacional, Universidad de Chile, Santiago, Chile
- 4Faculty of Psychology, Universidad de Talca, Talca, Chile
- 5School of Psychology, University of Turku, Turku, Finland
- 6Department of Health Service and Population Research, King’s College London, David Goldberg Centre, London, United Kingdom
Bullying is a phenomenon that affects children and adolescents worldwide, and it has major consequences for all participants involved in these situations. In Chile, researchers have validated several instruments used to investigate aggression between peers and school violence, but there is a lack of validation of instruments to investigate bullying. The purpose of this study was to provide evidence of the validity and reliability of the Olweus Bully/Victim Questionnaire—Revised version (OBVQ-R) in the Chilean context. The participants were 2,775 students from schools of low, medium, and high socioeconomic status. OBVQ-R is a self-report questionnaire with 42 items, which has been used in different countries, and has adequate psychometric properties to assess the prevalence of victimization and aggression and various forms of bullying worldwide. Results confirmed the two-factor structure of the OBVQ-R (victimization and perpetration subscales) and good reliability (ω = 0.81 and ω = 0.75, respectively). These dimensions seem to be correlated. Comparison between OBVQ-R with the School Violence between Peers Questionnaire and the Internet Experiences Questionnaire showed some degree of agreement. The Item Response Theory analysis showed that the item about verbal bullying, in both subscales, had the lowest-severity parameters, meaning that these forms of bullying were the most prevalent. The higher-severity parameter in the victimization scale was the cyberbullying item, and the sexual bullying item showed higher severity in the perpetration subscale. The differential item functioning analysis by gender showed a trend in which boys responded with lower-severity parameters than girls. In the victimization scale, the exception was the item about spreading rumors, and in the perpetration subscale, it was the item about racial bullying. We have provided evidence of the validation of OBVQ-R among school-age children and adolescents in Chile. This study is part of a trial registered at ClinicalTrials.gov, number NCT02898324.
Introduction
Bullying is a major educational and public health problem (Menesini and Salmivalli, 2017). Bullying has been defined as intentional aggressive behaviors that repeatedly occur over time and in the context of a power imbalance between the victim/s and the perpetrator/s (Olweus, 1978; Menesini and Salmivalli, 2017). Bullying behavior may take different forms, such as physical (e.g., hitting, kicking, pushing), verbal (e.g., insults and telling mean names), and social or relational aggression (e.g., social exclusion, spreading rumors, or online attacks) (National Academies of Sciences, Engineering, and Medicine, 2016).
Studies show that the prevalence of bullying varies across countries and studies. This may be due to the use of different instruments, and the definitions and operationalization of the bullying concept (Menesini and Salmivalli, 2017). Nonetheless, the prevalence rates are high. For example, in a recent systematic review of studies conducted in Australia, the lifetime prevalence of bullying victimization was 25.1% and perpetration was 11.6%. For cyberbullying, the estimates were less common, 7% for victimization and 3.5% for perpetration (Jadambaa et al., 2019). Another recent meta-analysis of youth between 12 and 18 years old (n = 335,519) showed that 35% of students were involved in traditional bullying and 15% in cyberbullying (Modecki et al., 2014). Very few studies have been carried out in Latin-American countries. For instance, in Brazil, in a study conducted among 60,973 students exploring a 30-day prevalence of bullying, 5.4% reported that they had been continually bullied and 25.4% reported rarely being bullied (Malta et al., 2010). In Argentina, Resett (2016) found the following prevalence: victims 13%, bullies 6%, bully/victims 5%, and non-involved students 73%.
Regarding gender, differences between boys and girls in traditional bullying appear to be consistent. For instance, males seem to be more frequent perpetrators and victims in traditional bullying (Smith et al., 2019). However, there is a considerable variation between countries (Smith et al., 2019). Less consistent results appear in cyberbullying, where some studies report no gender differences (Brown et al., 2014), while others have found a higher proportion of females as victims (Kowalski and Limber, 2007).
There is a less clear association between socioeconomic status (SES) and bullying. In a recent systematic review and meta-analysis including 28 studies, mostly from Europe and North America, victimization and bully-victim status were positively but weakly associated with low SES, while bullying perpetration was the most weakly related (Tippett and Wolke, 2014). Further research exploring this association in middle- and low-income countries is needed.
Bullying has negative consequences in all children and adolescents involved, and some of these effects can last until adulthood (Salmivalli and Peets, 2018). For instance, victims of bullying exhibit more depressive, anxious, and somatic symptoms, lower self-esteem, lower academic performance, and suicidal ideation, among other problems (Skapinakis et al., 2011; Heerde and Hemphill, 2019). On the other hand, bullies have a higher risk for externalizing symptoms such as delinquent behaviors, substance misuse, impulsive behavior, and lower anger regulation compared with non-perpetrator students (Haynie et al., 2001). Children and adolescents who identified themselves as bully victims share the psychological consequences of both groups, and research has shown that they are the most maladjusted group (Haynie et al., 2001; Rivers, 2011). Some studies show that there are also negative consequences for bystanders, such as a higher risk of substance use than students not involved in bullying situations (Polanin et al., 2012; Gaete et al., 2017).
There are some gender differences regarding the consequences of bullying. Consistent results have been found regarding female victims having a higher risk for internalizing symptoms such depression and suicidal ideation (Fredrick and Demaray, 2018; Cao et al., 2020). Similarly, girls report higher negative psychological symptoms and suicidal behavior than boys (Rey et al., 2019). On the other hand, externalizing problems after being bullied are also present, especially among boys (McDougall and Vaillancourt, 2015).
Bullying Assessment
The self-report questionnaire is the most common methodology used for data collection to assess bullying (Ronan et al., 2013; Nelson et al., 2018). This method has several advantages: it takes a relatively short time to administer, is generally easy to answer, is relatively inexpensive (e.g., one evaluator can assess many students), and is efficient (e.g., many students can be evaluated at the same time). Additionally, the same questionnaire can be used by different research teams internationally, therefore allowing cross-country comparisons of prevalence and associated factors (Solberg and Olweus, 2003; Crothers and Levinson, 2004). However, there are also some disadvantages: students may give biased responses to maintain social desirability, especially among perpetrators who can underreport their behavior. It is also challenging to obtain in-depth information about bullying experiences, especially when compared with data gathered by interviews (Crothers and Levinson, 2004). Nonetheless, self-reported questionnaires are still the best option for assessing large populations and evaluating the effectiveness of bullying prevention programs.
Additionally, Evans et al. (2014) reviewed 32 articles about the effectiveness of bullying programs and stressed the importance of using an explicit definition of bullying to help responders to have a clear and shared concept of bullying, distinguishing it from other forms of aggression.
The Olweus Bully/Victim Questionnaire
The Olweus Bully/Victim Questionnaire (OBVQ) is one of the most widely used instruments to measure the prevalence of bullying worldwide (Green et al., 2013; Smith et al., 2016). This questionnaire provides students with a clear definition of bullying that includes the three essential characteristics: (1) intent to cause harm to another person; (2) repetitive conduct; and (3) power imbalance between the victim and the perpetrator (Olweus, 1978; Salmivalli and Peets, 2018). The original version of the OBVQ was developed in 1983 (with 36 items), and in 1996 Dan Olweus put forward the revised questionnaire (OBVQ-R) and increased the number of items to 42 (Kyriakides et al., 2006). Additional questions about different bullying types were included in the revised version, such as sexual bullying and cyberbullying. Additionally, the revised version has a more specific criterion of frequency: the response option “sometimes” in the original version was changed to “2 or 3 times a month” (Solberg and Olweus, 2003).
Several studies have shown evidence of the validity of the OBVQ using different methodological approaches (Solberg and Olweus, 2003; Vessey et al., 2014; Breivik and Olweus, 2015). For instance, Kyriakides et al. (2006) studied the OBVQ-R using Rash modeling in a sample of 335 Greek Cypriot students. The results supported the validity and reliability of the OBVQ-R, showing that there are two main factors (being bullied and bullying others) and that it addresses the typology of indirect, verbal, and physical bullying. Bevans et al. (2013) evaluated the OBVQ victimization scale using Item Response Theory (IRT) in a sample of 17,198 United States students. They found that the questionnaire has a reliable scale (Cronbach’s alpha full scale 0.84) using ten items from the victim dimension. The researchers also concluded that the victimization factor has two subdimensions (direct and indirect types of victimization), and it has a better fit when stratifying by gender. Breivik and Olweus (2015) used IRT modeling and studied the psychometric properties of the OBVQ in a sample of 48,926 students in Norway. They found an optimal scale using eight items (they did not include the item about cyberbullying nor the item about other forms of bullying) in which bullying others corresponds to one factor, and the items that had the highest-severity parameters were taking money from others, spreading false rumors, and threatening others.
In Latin America, the OBVQ-R has been used in a few studies, showing satisfactory psychometric properties. In Argentina, two studies have evaluated the psychometric properties of the OBVQ-R. Resett (2011) administered the OBVQ-R to 84 Argentinean students to assess internal consistency. In the victim subscale, the Cronbach’s alpha for the victimization scale was 0.9, with the cyberbullying item having a relatively low item-total correlation (r = 0.15). The perpetration scale had a Cronbach’s alpha of 0.81, and the lowest item-total correlation was for threatening others (r = 0.16). In another study with 1,222 Argentinean students, a good fit for the two-factor model of the OBVQ-R (being bullied and bullying others) using confirmatory factorial analysis (CFA) was found (Resett et al., 2015). Additionally, the study found differences in the perpetrator subscale between genders, observing that boys identified themselves as harming others by physical aggression, and girls by relational aggression (e.g., lying, spreading rumors). Gonçalves et al. (2016) studied the OBVQ-R in a sample of 713 Brazilian students, from 5th to 9th grade, using IRT modeling. The study showed satisfactory reliability for the victim subscale (Cronbach’s alpha 0.85) and the perpetrator subscale (Cronbach’s alpha 0.87). In this study, the IRT model showed that the direct forms of bullying (e.g., threats, hurtful comments) had a high power to distinguish between victims and bullies. Finally, in another study with 409 Brazilian students, researchers found good internal consistency of the OBVQ (Cronbach’s alpha 0.75) (Zequinão et al., 2016).
No previous study has assessed the validity and reliability of the OBVQ-R in Chile. Having a validated instrument will help to determine the prevalence of bullying, allow cross-country comparisons, and evaluate preventive school-based interventions. We used the Spanish version of the 42-item OBVQ-R.
This study aimed to determine the validity and reliability of the OBVQ-R in a sample of adolescents in Chile. The specific objectives were (1) to study the dimensionality and reliability of the Spanish version of the OBVQ-R in Chilean students; (2) to describe the psychometric features of the questionnaire; (3) to study the concurrent validity of this scale, comparing the OBVQ-R with the School Violence between Peers Questionnaire (MIAP) and Internet Experiences Questionnaire; (4) to study the internal structure of the OBVQ-R using the IRT Rach Model; and (5) to analyze the differential item functioning regarding gender and socioeconomic status.
Materials and Methods
Study Design and Participants
This study was an analytical cross-sectional survey using self-reported information. The participants were students attending 4th to 8th grades, in mixed schools located in two central regions in Chile: Metropolitan and Valparaíso regions. The students were between 9 and 16 years old (mean 11.5, SD = 1.6), and 57.1% were female. See Table 1.
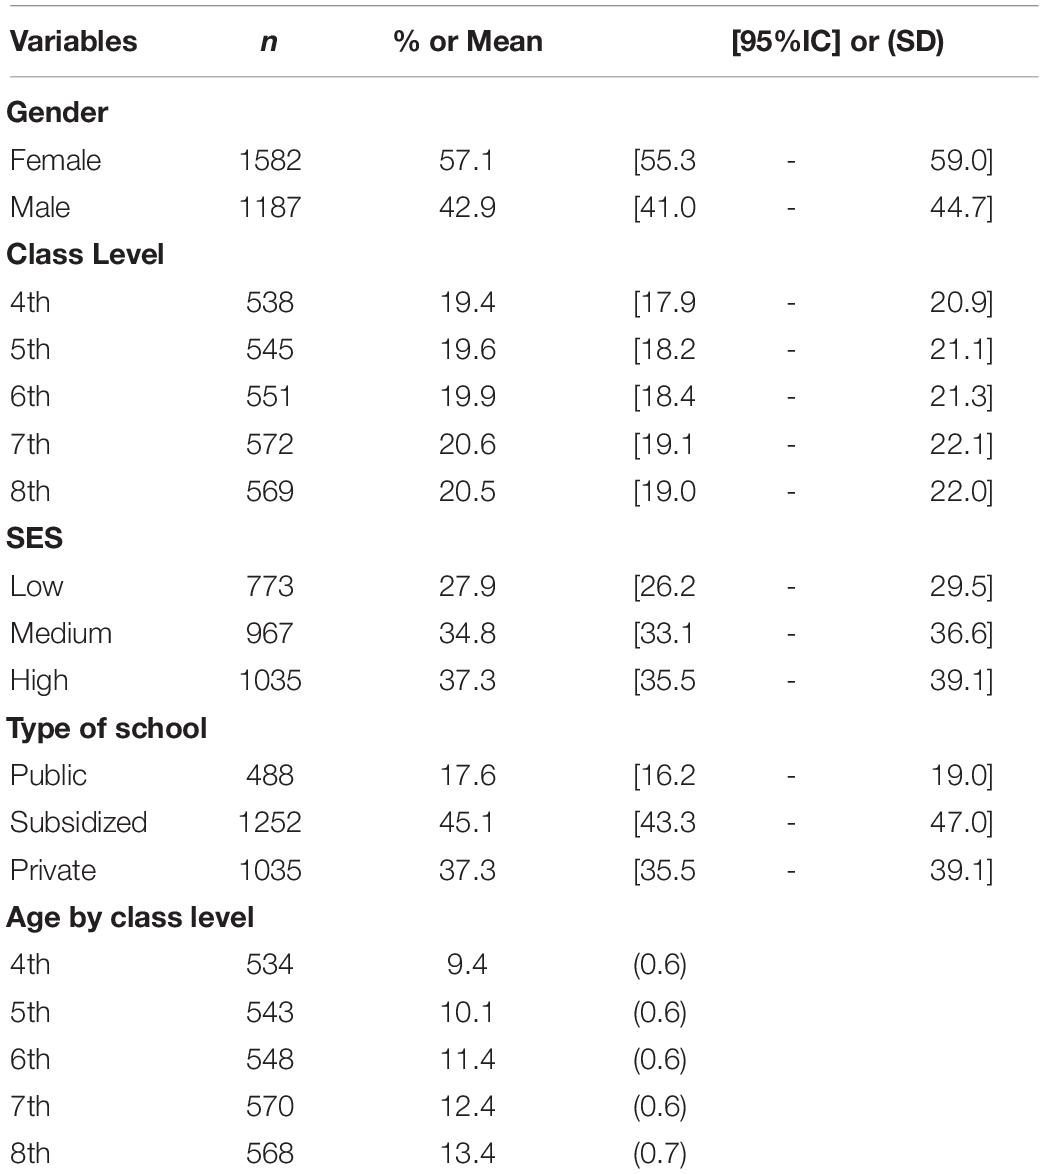
Table 1. Descriptive Variables.
Considering differences according to household incomes (OECD, 2015), 32 schools were invited to participate, representing high, medium, and low SES. The SES was obtained from the Education Quality Measurement System (Sistema de Medición que la Agencia de Calidad de la Educación, SIMCE), a measure used in Chile to evaluate different aspects of the school curricula and sociodemographic information from students and their families. Nine of the schools agreed to participate: three of low SES (representing 37.3% of students), four of Medium SES (34.8% of students), and two of high SES (27.9% of students).
Procedure
The research team obtained authorization from the schools’ authorities. Then, the team asked for informed and written consent from parents/main caregivers. A total of 3,363 parents/main caregivers were contacted, and 99.1% (N = 3060) of them consented to their children’s participation. The Ethical Committee of the University of the Andes of Chile approved the study protocol (January 18th, 2016). The study followed the Helsinki Convention norms.
The study was undertaken between June and August 2016, including the recruitment of schools and the evaluation of the students. The questionnaire was administered to the whole class, in the classroom, or in another suitable place in school. Trained research assistants carried out the administration on two different days, 1 week apart, for each class during the school hours (60 min each): on the first day, the students responded to the OBVQ-R, and 1 week later, they answered the MIAP Questionnaire and the Internet Experiences Questionnaire (IEQ).
Before administering the questionnaire, a research assistant asked the students to sign an informed assent to ensure voluntary participation, and a total of 2,775 students agreed to participate. Then, the assistant asked the students to fill in their sociodemographic information. In all grades, the research assistant read out the definition of bullying. In the 4th and 5th grades, the whole questionnaire was read out by the research assistant, but for 6th to 8th grades, the students answered it independently. The research assistants responded to doubts and questions from students. After the students completed the questionnaire, the research assistant put the returned questionnaires in sealed envelopes to ensure confidentiality. Research assistants entered the data in a predesigned database using computers exclusively dedicated to the research. Once the data were entered, the research field coordinator reviewed and cleaned the data. Finally, all personal information (name, school, class) was codified and encrypted, producing a final database without personal information. Only the principal investigator (JG) had access to the data using a password. This procedure allowed us to guarantee confidentiality and anonymity.
Measures
Sociodemographic Variables
The following sociodemographic variables were included in the analysis: gender, school grade, type of dependence, and SES of the educational establishment.
Administering the Revised Olweus Bully/Victim Questionnaire
The OBVQ-R is a 42-item self-report questionnaire that assesses events related to bullying behaviors between peers at school using a referential period of 2 months. It also includes questions about attitudes toward bullying and school climate (Solberg and Olweus, 2003) (see Supplementary Material).
Before administering the questionnaire, a definition of bullying was read out aloud for students. After general demographic questions (gender, school grade), the questionnaire started with two global questions where students could identify themselves as victims or bullies: “How often have you been bullied at school in the past couple of months?” (victims), and a similar question for harming others (perpetrators). It also asked about nine types of bullying, which included (1) calling mean names or teasing; (2) exclusion; (3) hitting, kicking, and pushing; (4) spreading rumors; (5) taking money or damaging belongings; (6) threatening; (7) making racial comments; (8) making sexual remarks or gestures; and (9) cyberbullying. It also asked if the children or adolescents had suffered any other form of bullying that was not mentioned (Solberg and Olweus, 2003). Another group of nine questions asked about characteristics of the bullying situations (e.g., the bullies’ grade level, number of bullies, the length of time the student has been suffering from bullying, and the location where it took place). The questionnaire also included nine questions about actions that have been taken in school by teachers or parents to stop bullying. Finally, two questions asked about what students think of teachers’ and parents’ opinions about bullying (Solberg and Olweus, 2003; Vessey et al., 2014).
The answers were coded into a five-point scale from 0 to 4 (0 = it hasn’t happened to me in the last two months, 1 = it happened to me only once or twice in the last two months, 2 = it happened to me 2 to 3 times a month, 3 = it happened to me once a week, 4 = it happened to me several times a week) (Solberg and Olweus, 2003). The psychometric properties of the OBVQ-R have been studied elsewhere, as mentioned above, and internal consistencies range from 0.8 to 0.9 (Breivik and Olweus, 2015).
Violence Between Peers
MIAP was used to assess aggressive behaviors among students (Lecannelier et al., 2011). This questionnaire is a self-report instrument containing 13 multiple-choice questions. The questions gather information about aggression and its frequency using a 4-point scale: 1 = never, 2 = sometimes, 3 = often, and 4 = always. This instrument was adapted and validated for the Chilean population by Lecannelier et al. (2011), showing an overall Cronbach’s alpha of 0.89. It distinguishes different roles, such as victim, bully, bully/victim, and bystander. This scale does not assess explicit bullying nor does it use a definition of bullying; however, it does evaluate violence in the schools, identifying several roles. The answers from this questionnaire and the OBVQ-R should be similar to assess the concurrent validity of the OBVQ-R. In our sample, the Cronbach’s alpha was 0.94, and the ω was 0.89 for the victimization factor, and the Cronbach’s alpha was 0.95, and the ω was 0.82 for the perpetration factor.
Cyberbullying
The IEQ is a self-report questionnaire with 28 questions. It evaluates different forms of traditional bullying and cyberbullying happening during the current school year. The questionnaire assesses if the respondent was a victim or a bully, the number of times bullying took place, and if the victim knew who was responsible (Raskauskas and Stoltz, 2007). This instrument was adapted and validated for the Chilean population, showing a Cronbach’s alpha of 0.62 for the full scale (Lecannelier et al., 2010). There were three questions closely related to the cyberbullying item included in the OBVQ-R: Have you been a victim of bullying through text messages (using cellphone or WhatsApp)?; Have you been a victim of bullying through internet (messages posted on a website or blog); and Have you been a victim of bullying through using pictures or videos of you without your permission? Similar questions were constructed for evaluating aggression. All these questions were answered using a 6-point scale: 0 = never, 1 = once or twice a year, 2 = 3–5 times a year, 3 = 6–10 times a year, 4 = 11–15 times a year, and 5 = 16 or more times a year. It was decided to compare the cyberbullying item included in the OBVQ-R with the question in the IEQ instrument for which the same student had the highest score. We assessed the concurrent validity of the OBVQ-R with these questions.
Data Analysis
The descriptive statistics are reported as percentages with 95% confidence intervals (CI 95%) for gender, class level, socioeconomic status, type of school, and age reported as mean (standard deviation) by class level.
Dimensionality and Reliability
A CFA was conducted to study the dimensionality and reliability of the OBVQ-R. We used the weighted least squares (WLS) of the polychoric matrix, which is considered more robust than other methods (Browne, 1984; Muthén, 1984). Polychoric correlations are advised for factor analysis when the distributions of items are ordinals (Flora and Curran, 2004). CFA is part of the measurement model that examines relationships between variables and the observed factors. It was important to determine if the questionnaire had two subscales (victimization and perpetration) and if these subscales were independent of each other (uncorrelated) or were related. Therefore, we assessed the goodness of fit of different models: (1) two independent models of victimization and perpetration subscales (see Figures 1, 2), (2) a model with two factors correlated for victimization and perpetration subscales (see Figure 3), and (3) a model with two factors uncorrelated for victimization and perpetration subscales (see Figure 4). We used multiple goodness-of-fit indices to judge whether the proposed model is consistent with the empirical data, and we used the chi-square test (CHISQ) to compare both models. The following indices were calculated to determine if the adjustment was at least acceptable: (1) Root Mean Square Error of Approximation (RMSEA), (2) Standardized Root Mean Square Residual (SRMR), (3) Normed Fit Index (NFI), (4) Non-normed Fit Index (NNFI), (5) Comparative Fit Index (CFI), (6) Goodness-of-Fit Index (GFI), and (7) Adjusted Goodness-of-Fit Index (AGFI) (Table 2). It was considered a good fit for RMSEA if values were less than or equal to 0.05, and values between 0.05 and 0.08 were considered adequate (Bollen and Long, 1993). SRMR values less than 0.05 indicated a good fit, while values less than 0.10 were interpreted as acceptable (Hu and Bentler, 1995). NFI greater than or equal to 0.95 indicated a good fit, while values higher than 0.90 indicated an acceptable adjustment (Schumacker and Lomax, 2012). NNFI greater than or equal to 0.97 indicated a good fit, and 0.95 was an acceptable fit (Jöreskog and Sörbom, 1993). CFI has the same criteria as NNFI (Bollen, 1990; Hu and Bentler, 1999). GFI of 0.95 indicated a good fit, and values greater than 0.90, an acceptable fit (Schumacker and Lomax, 2012). Finally, AGFI 0.90 was indicative of a good fit, and values greater than 0.85 indicated an acceptable fit.
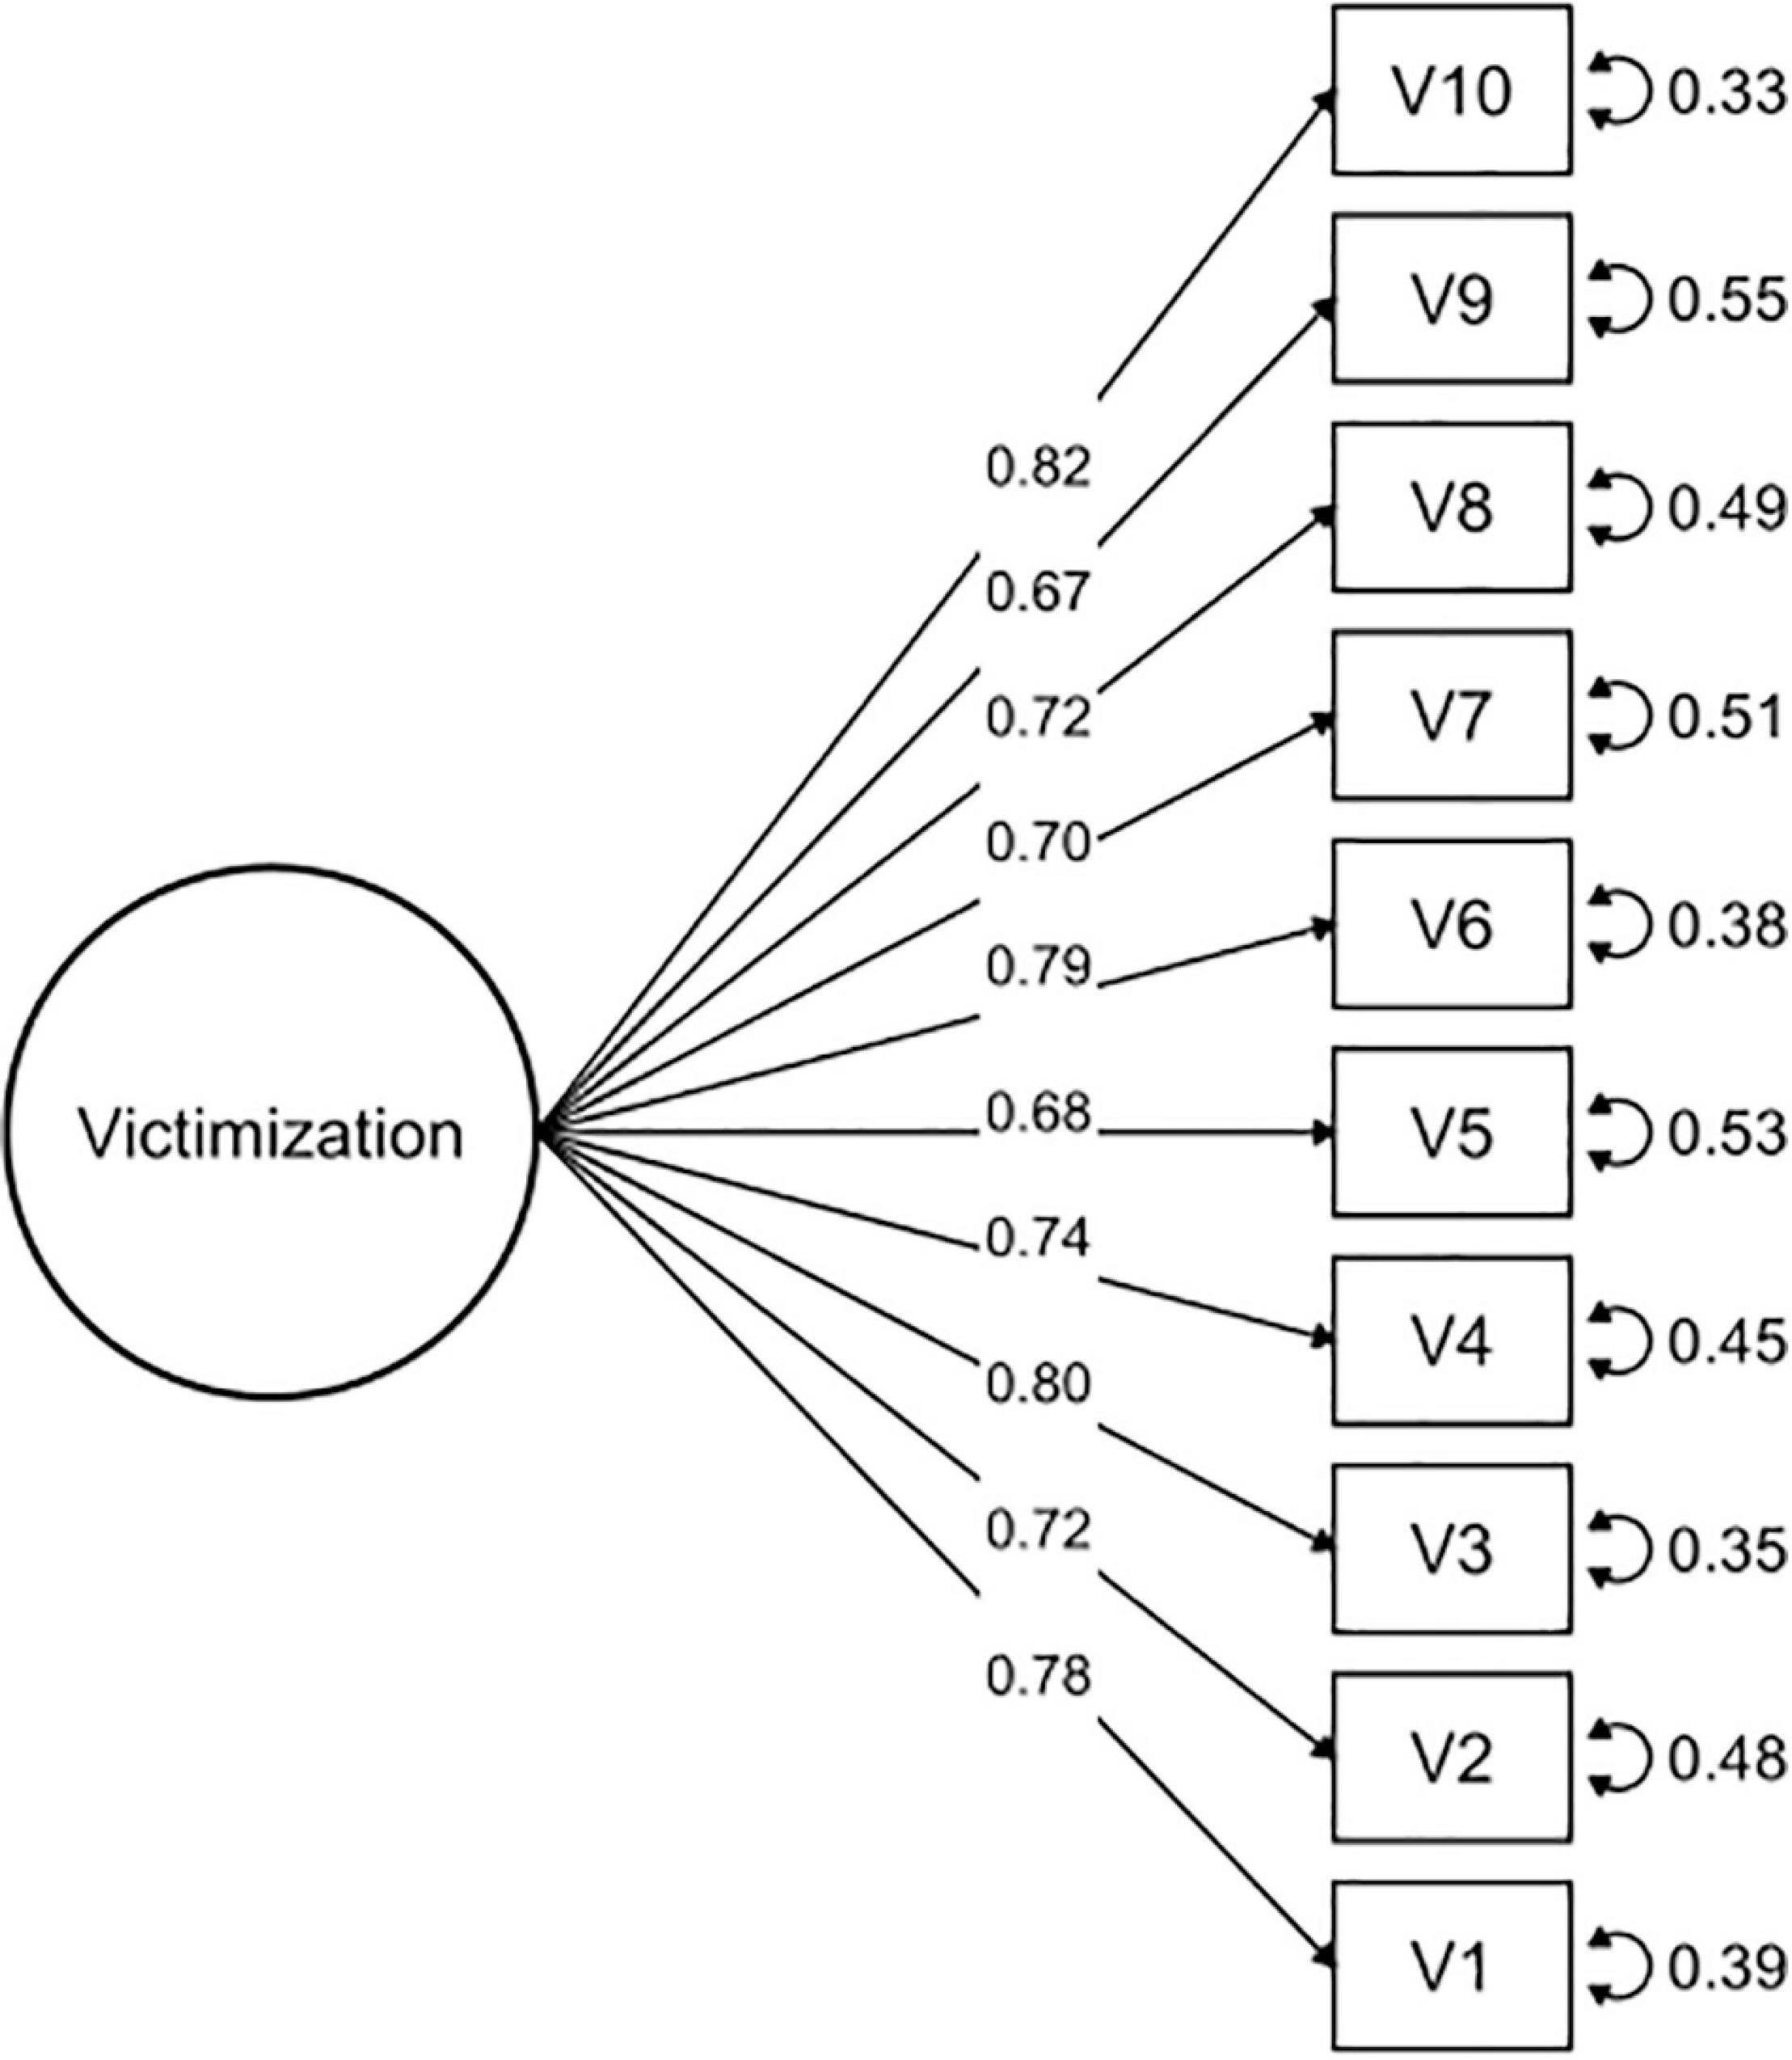
Figure 1. Confirmatory factor analysis of the victimization subscale.

Figure 2. Confirmatory factor analysis of the prepetration subscale.
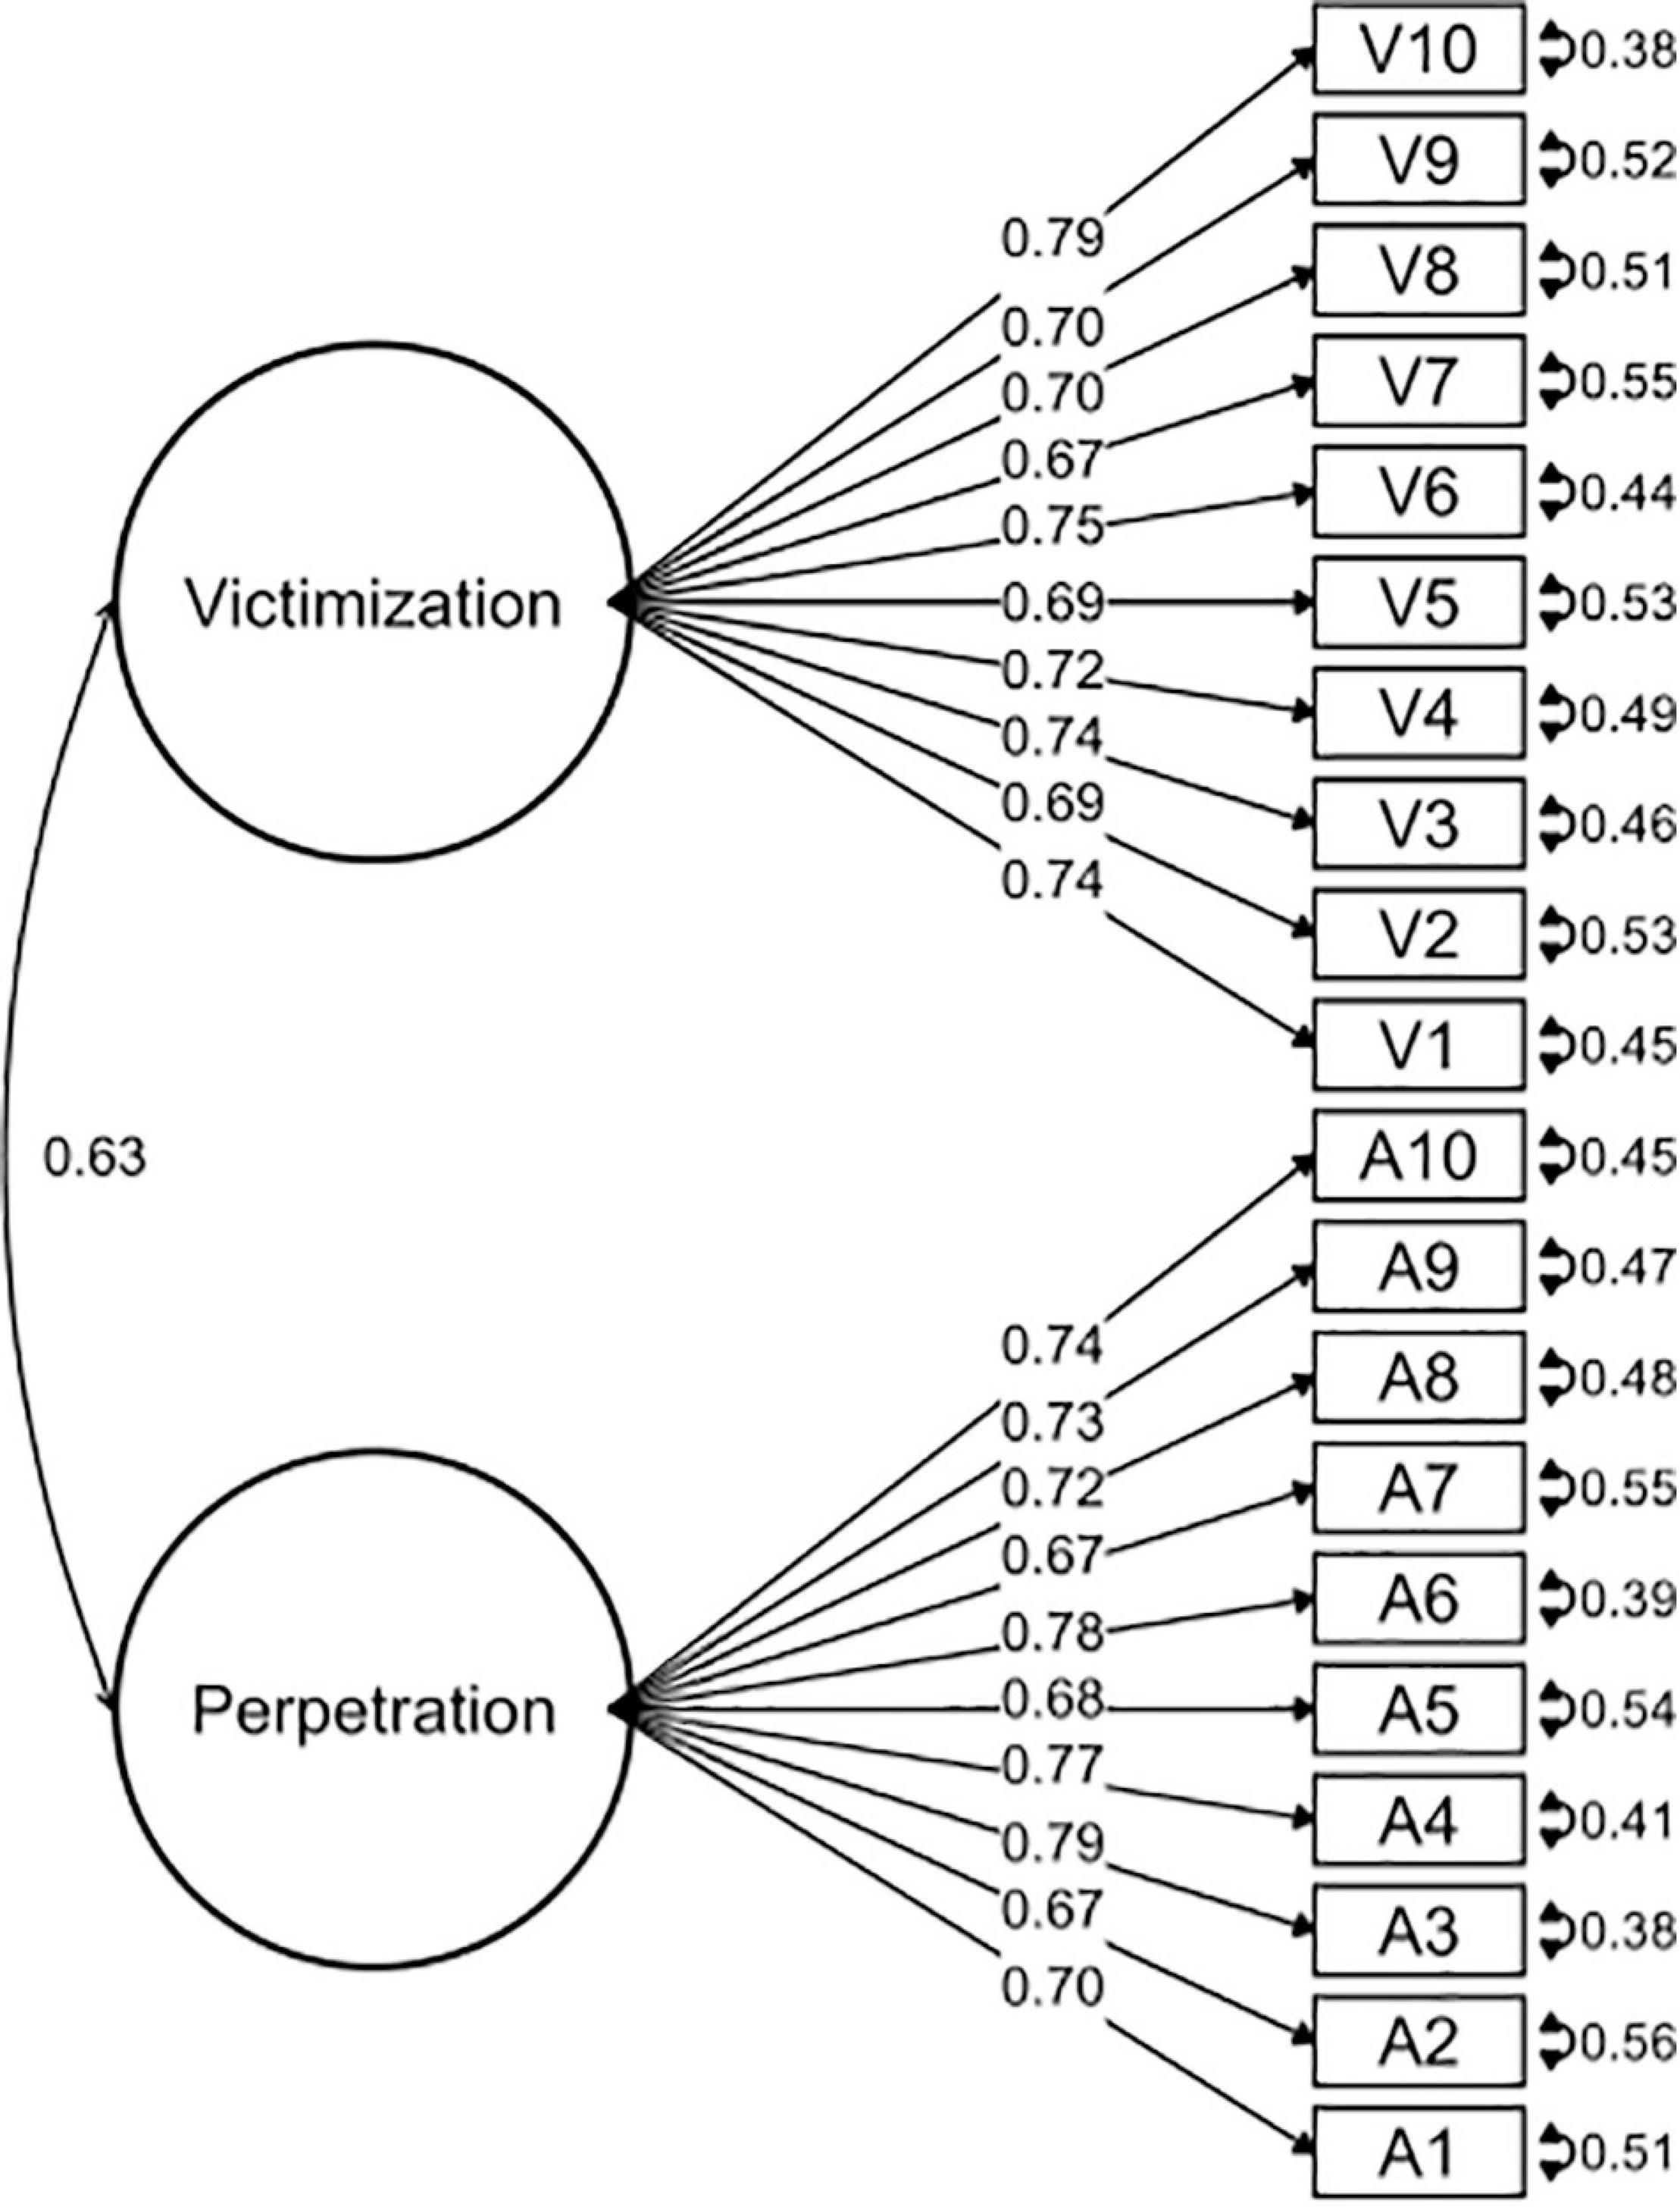
Figure 3. Confirmatory factor analysis of the model with two factors correlated for victimization and perpetration subscales.
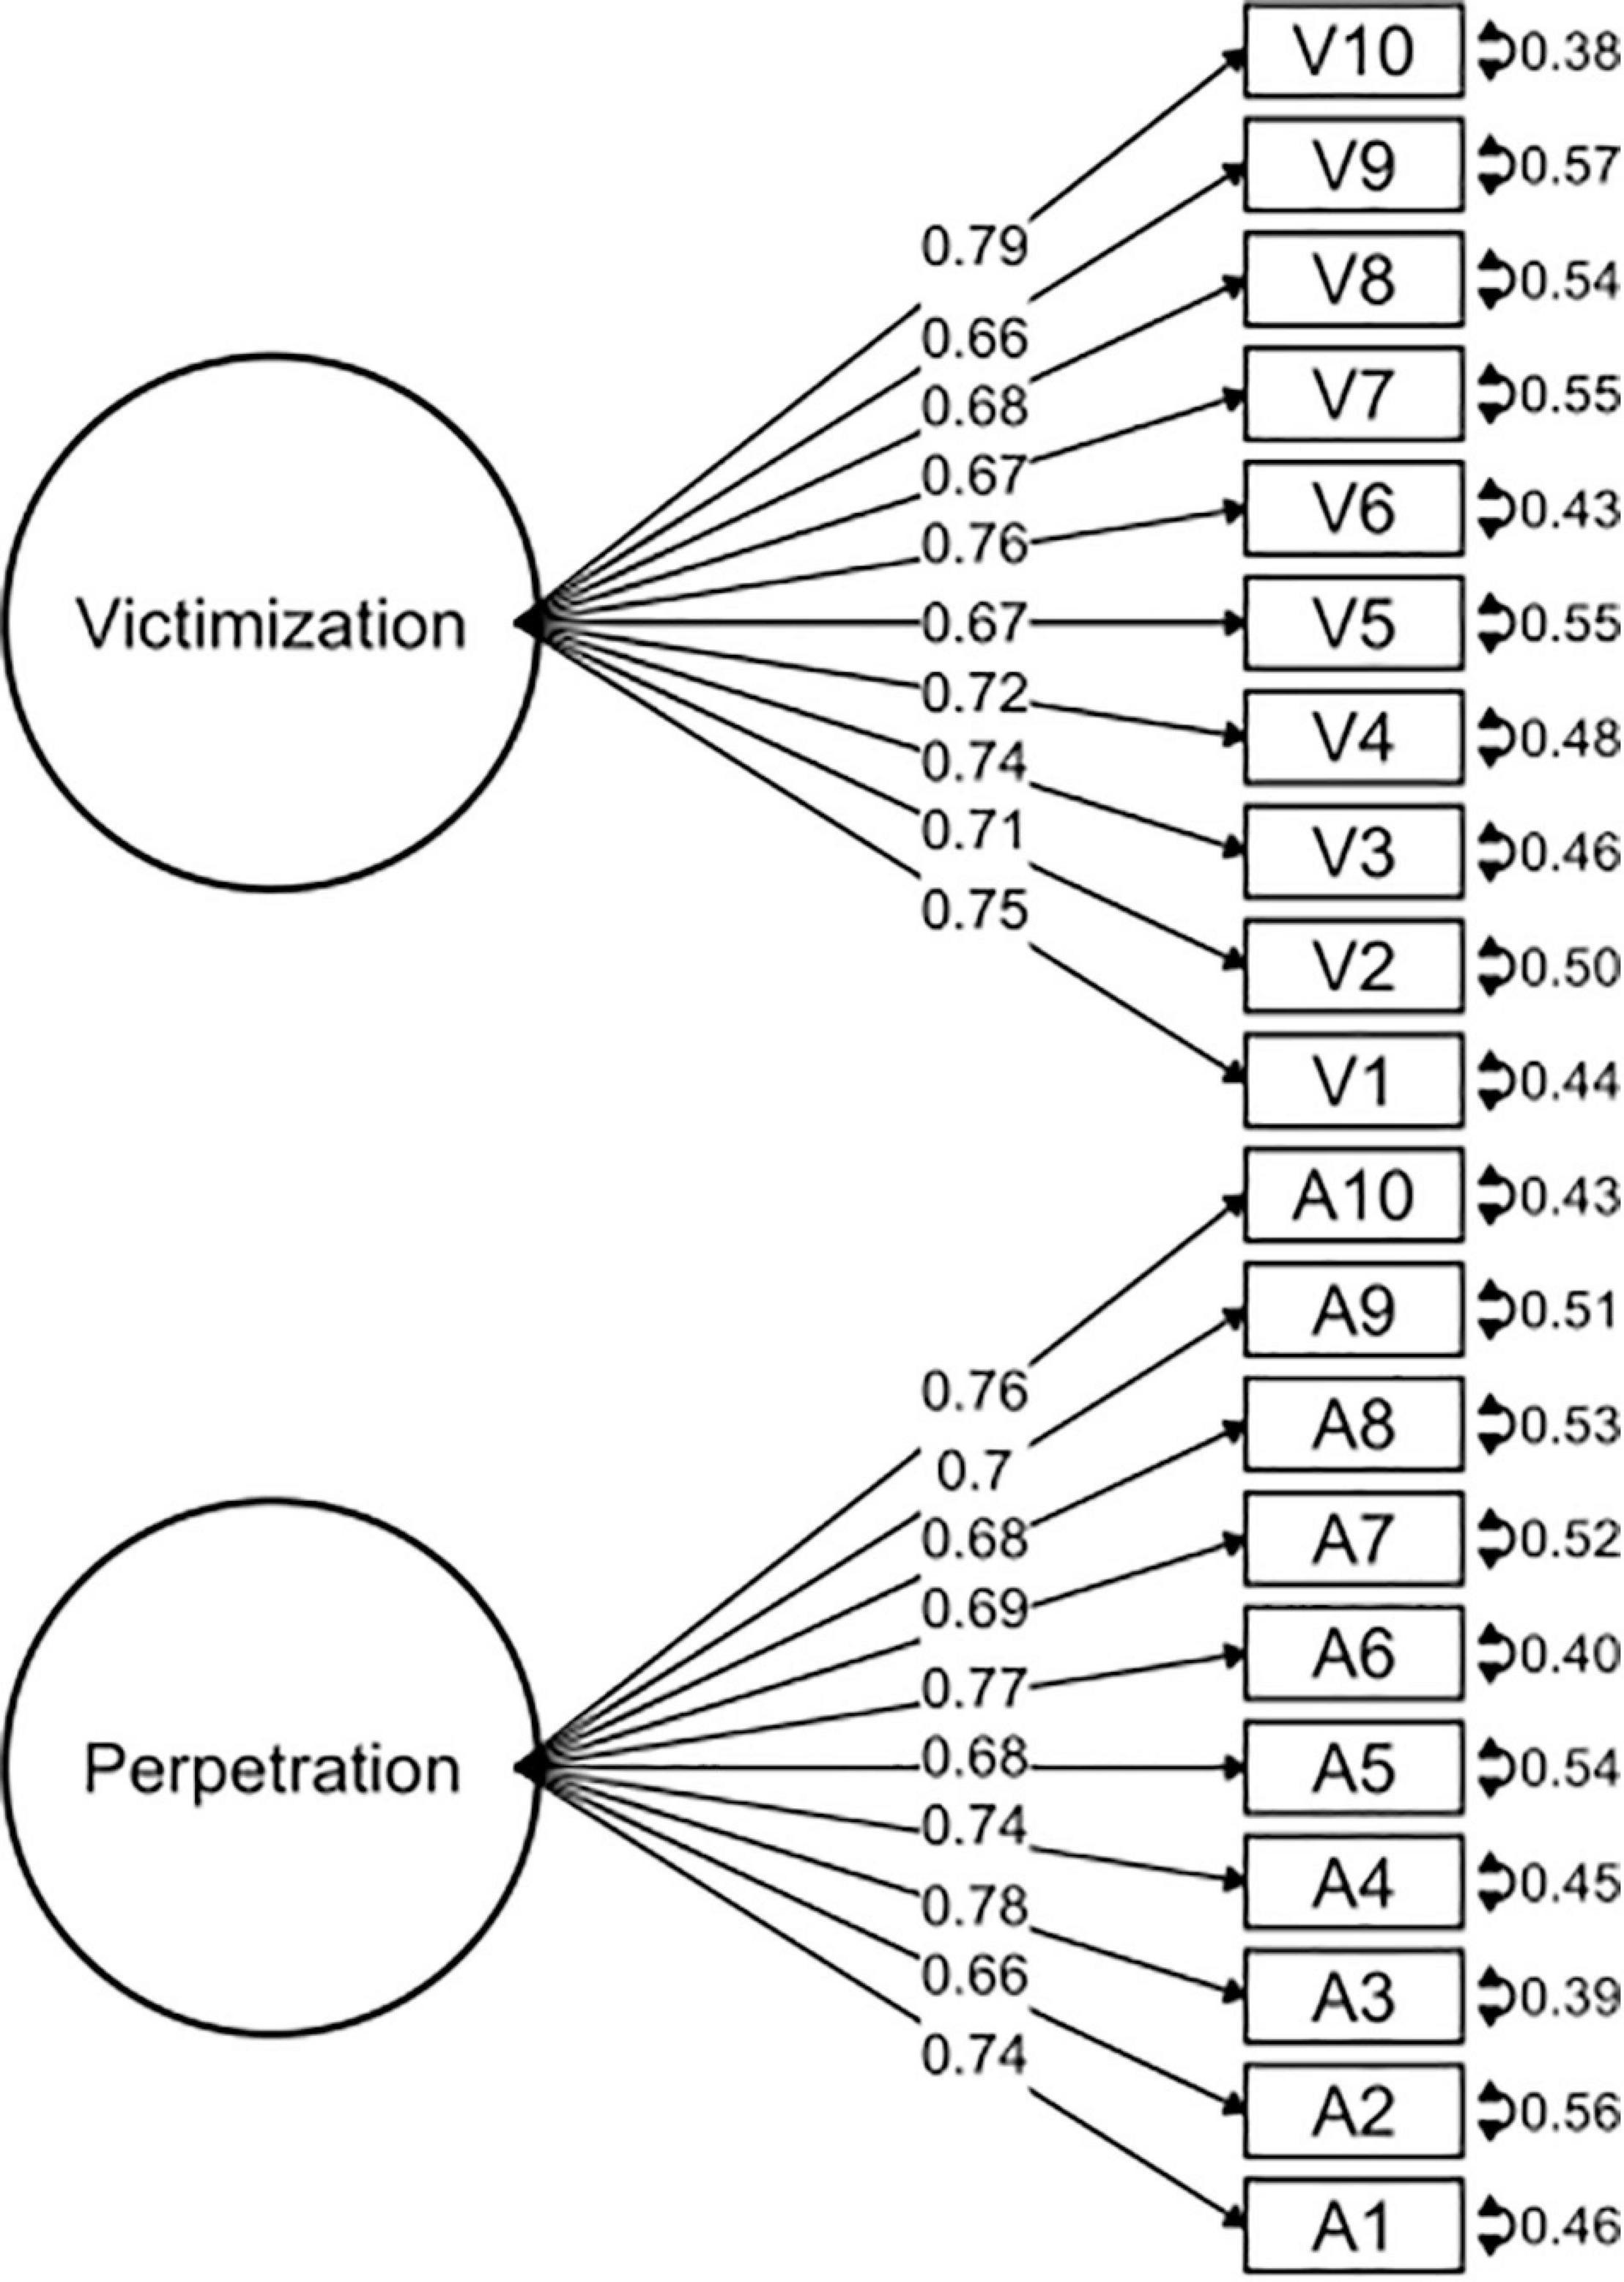
Figure 4. Confirmatory factor analysis of the model with two factors uncorrelated for victimization and perpetration subscales.
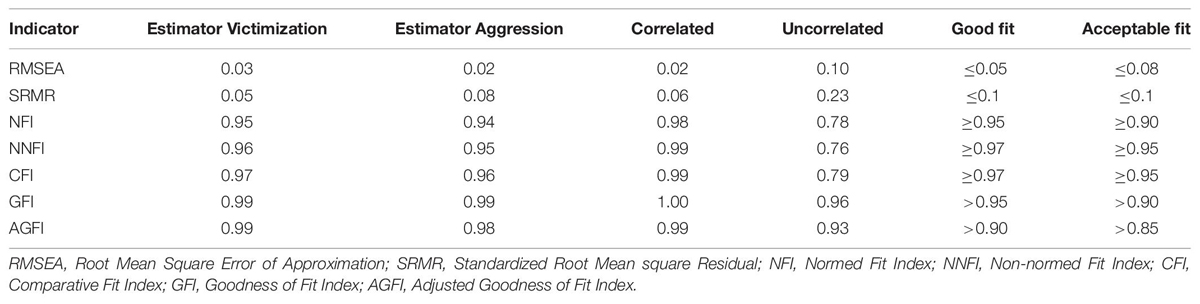
Table 2A. Indicators of adjustment of victimization and aggression subscales.

Table 2B. Comparison between the correlated and uncorrelated models of victimization and aggression subscales.
Additionally, the instrument’s reliability was evaluated through the omega coefficient; an acceptable reliability value is 0.65 or more (McDonald, 2013). Also, the average variance extracted was calculated; it was acceptable at a value of at least 0.5 (Fornell and Larcker, 1981).
Descriptive Features of the Questionnaire
The items were described by mean, standard deviation, median, skewness and kurtosis coefficients, and the quartiles 1 and 3. These last two parameters are presented in intervals [Q1–Q3], as a robust measure of dispersion. The same analyses were conducted when comparing the psychometric properties of subscales of victimization and perpetration between girls and boys and different socioeconomic statuses.
IRT Analysis
The analysis of the psychometric properties of the OBVQ-R was done using IRT for the graded response model (Samejima, 1969) for each of the 10 items included in each subscale. The response alternatives were collapsed into three answer categories: 0 is “never in the last two months at school” (0 = 1), 1 is “it has happened once or twice in the last two months” (1 = 2), and 2 includes the responses “2 or 3 times a month in the last two months,” “about once a week in the last two months” and “several times a week in the last two months” (2 = 3,4,5).
The IRT model estimated three parameters: Alpha, Beta1, and Beta2. Alpha is a discrimination parameter, representing the degree to which the answer categories differentiate between levels of the trait. It remains constant for all the thresholds of the categories of the same item. This discrimination parameter alpha was interpreted according to the following scale: 0 = “no discrimination,” 0.01–0.34 = “very low,” 0.35–0.64 = “low,” 0.65–1.34 = “moderate,” 1.35–1.69 = “high,” and greater than or equal to 1.7 = “very high” (Baker, 2001). On the other hand, Beta1 represents the latent trait needed for the student to pass the threshold from answering 0 (never happened to me in the last two months at school) to 1 (it has happened once or twice in the last two months). In other words, Beta1 refers to the minimum value of the necessary trait to obtain a probability higher than 0.5 in answering option 1. Moreover, Beta2, similar to Beta1, represents the threshold for passing from the answer category of 1 (it has happened once or twice in the last two months) to 2 (it has happened to me 2 or 3 times a month or more in the last two months). With the estimation of these severity parameters, we can order the questions according to their degree of severity; when the threshold is high, the degree of severity will be higher.
Differential Item Functioning (DIF) by Gender and SES
We determined if there were items with differential functioning for subgroups. If so, this implies that respondents from different subgroups with the same latent trait level do not have the same probability of responding positively to an item category (Chalmers, 2012). The items can have a different relationship with the principal construct by subgroups (Reise et al., 2005). We evaluated DIF associated with gender and SES independently.
All data analyses were conducted using R 3.5.0. CFA and IRT were performed using lavaan (Rosseel, 2012) and mirt package (Chalmers, 2012), respectively.
Concurrent Validity
It was evaluated by analyzing the concordance of seven items of the victimization subscale and seven items of perpetration subscale with similar items in the MIAP. The cyberbullying item of the OBVQ-R was compared to the IEQ, since the MIAP does not include cyberbullying items.
To assess the agreement between each instrument’s questions, we used Cohen’s kappa statistic and its confidence intervals, as well as a hypothesis test in which the null hypothesis proposes that the degree of agreement between the items is random (Landis and Koch, 1977). The degree of agreement between the questions will be interpreted in the following way: if kappa is less than 0, there is “no agreement,” if 0–0.2, “slight agreement,” if 0.2–0.4, “fair agreement,” if 0.4–0.6, “moderate agreement,” if 0.6–0.8, “substantial agreement,” and if 0.8–1.0, “almost perfect agreement” (Landis and Koch, 1977).
Results
Dimensionality and Reliability
The OBVQ-R had good parameters of adjustment indicators in both subscales separately (see Table 2A). The unidimensional characteristic of both subscales (victimization and perpetration) was corroborated (see Table 2A). Additionally, the model of the two subscales correlated presented a better fit than the uncorrelated model (see Tables 2A,B, and Figures 1–4).
Finally, the victimization and perpetration subscales have good internal reliability (Cronbach’s alpha = 0.91, ω = 0.81, and Cronbach’s alpha = 0.92, ω = 0.76, respectively), and the average variance extracted was 0.51 and 0.52, respectively.
Descriptive Features of the Questionnaire
Descriptive statistics of all items of victimization and perpetration subscales are shown in Table 3. All items of victimization and perpetration subscales were mostly comprised of items with asymmetric responses and a high degree of kurtosis. Additionally, results from the factorial analysis showed that the item “I was bullied with mean names, comments, or gestures with a sexual meaning” had the lowest load (0.65) in the victimization subscale, while the lowest load in the perpetration subscale was 0.66, for the item “I called another student(s) mean names, made fun of, or teased him/her in a hurtful way.”
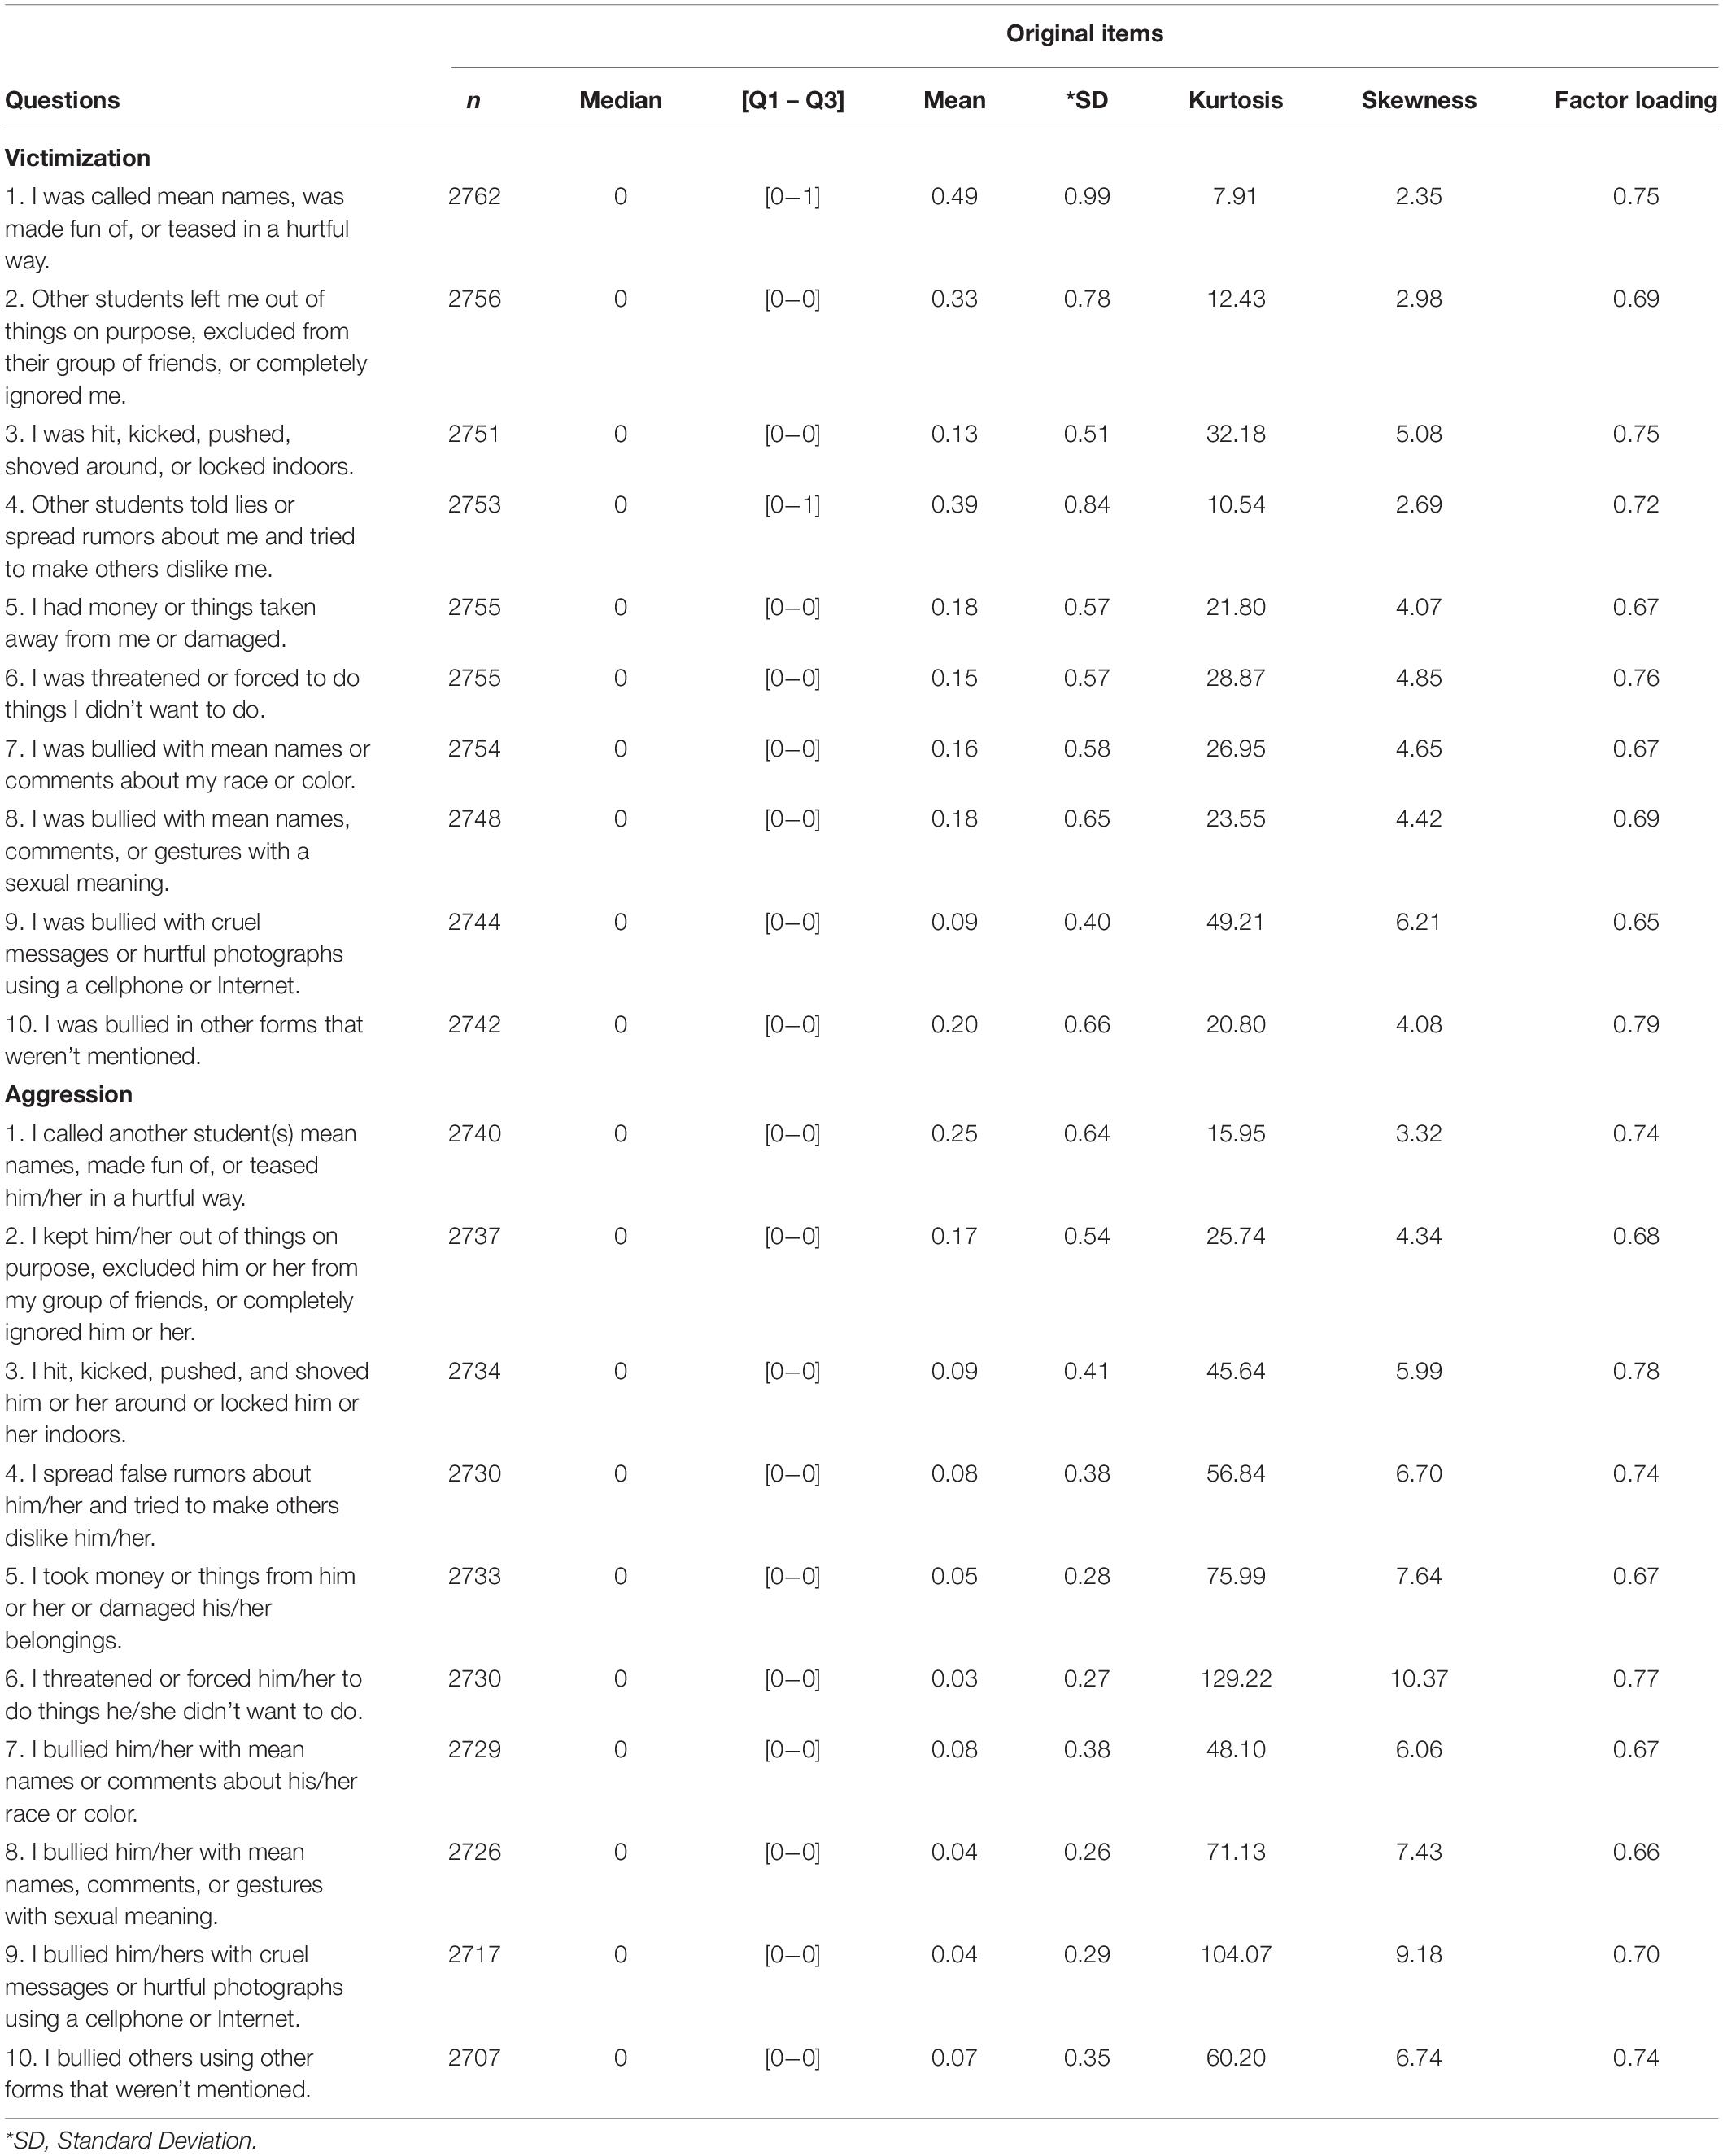
Table 3. Descriptive Statistics and factor loading.
Item Response Theory analysis
Table 4 shows the descriptive statistics (median and interquartile range) for each question from the victimization and perpetration subscales. Additionally, it presents estimated parameters through IRT (Alpha, Beta1, and Beta2).
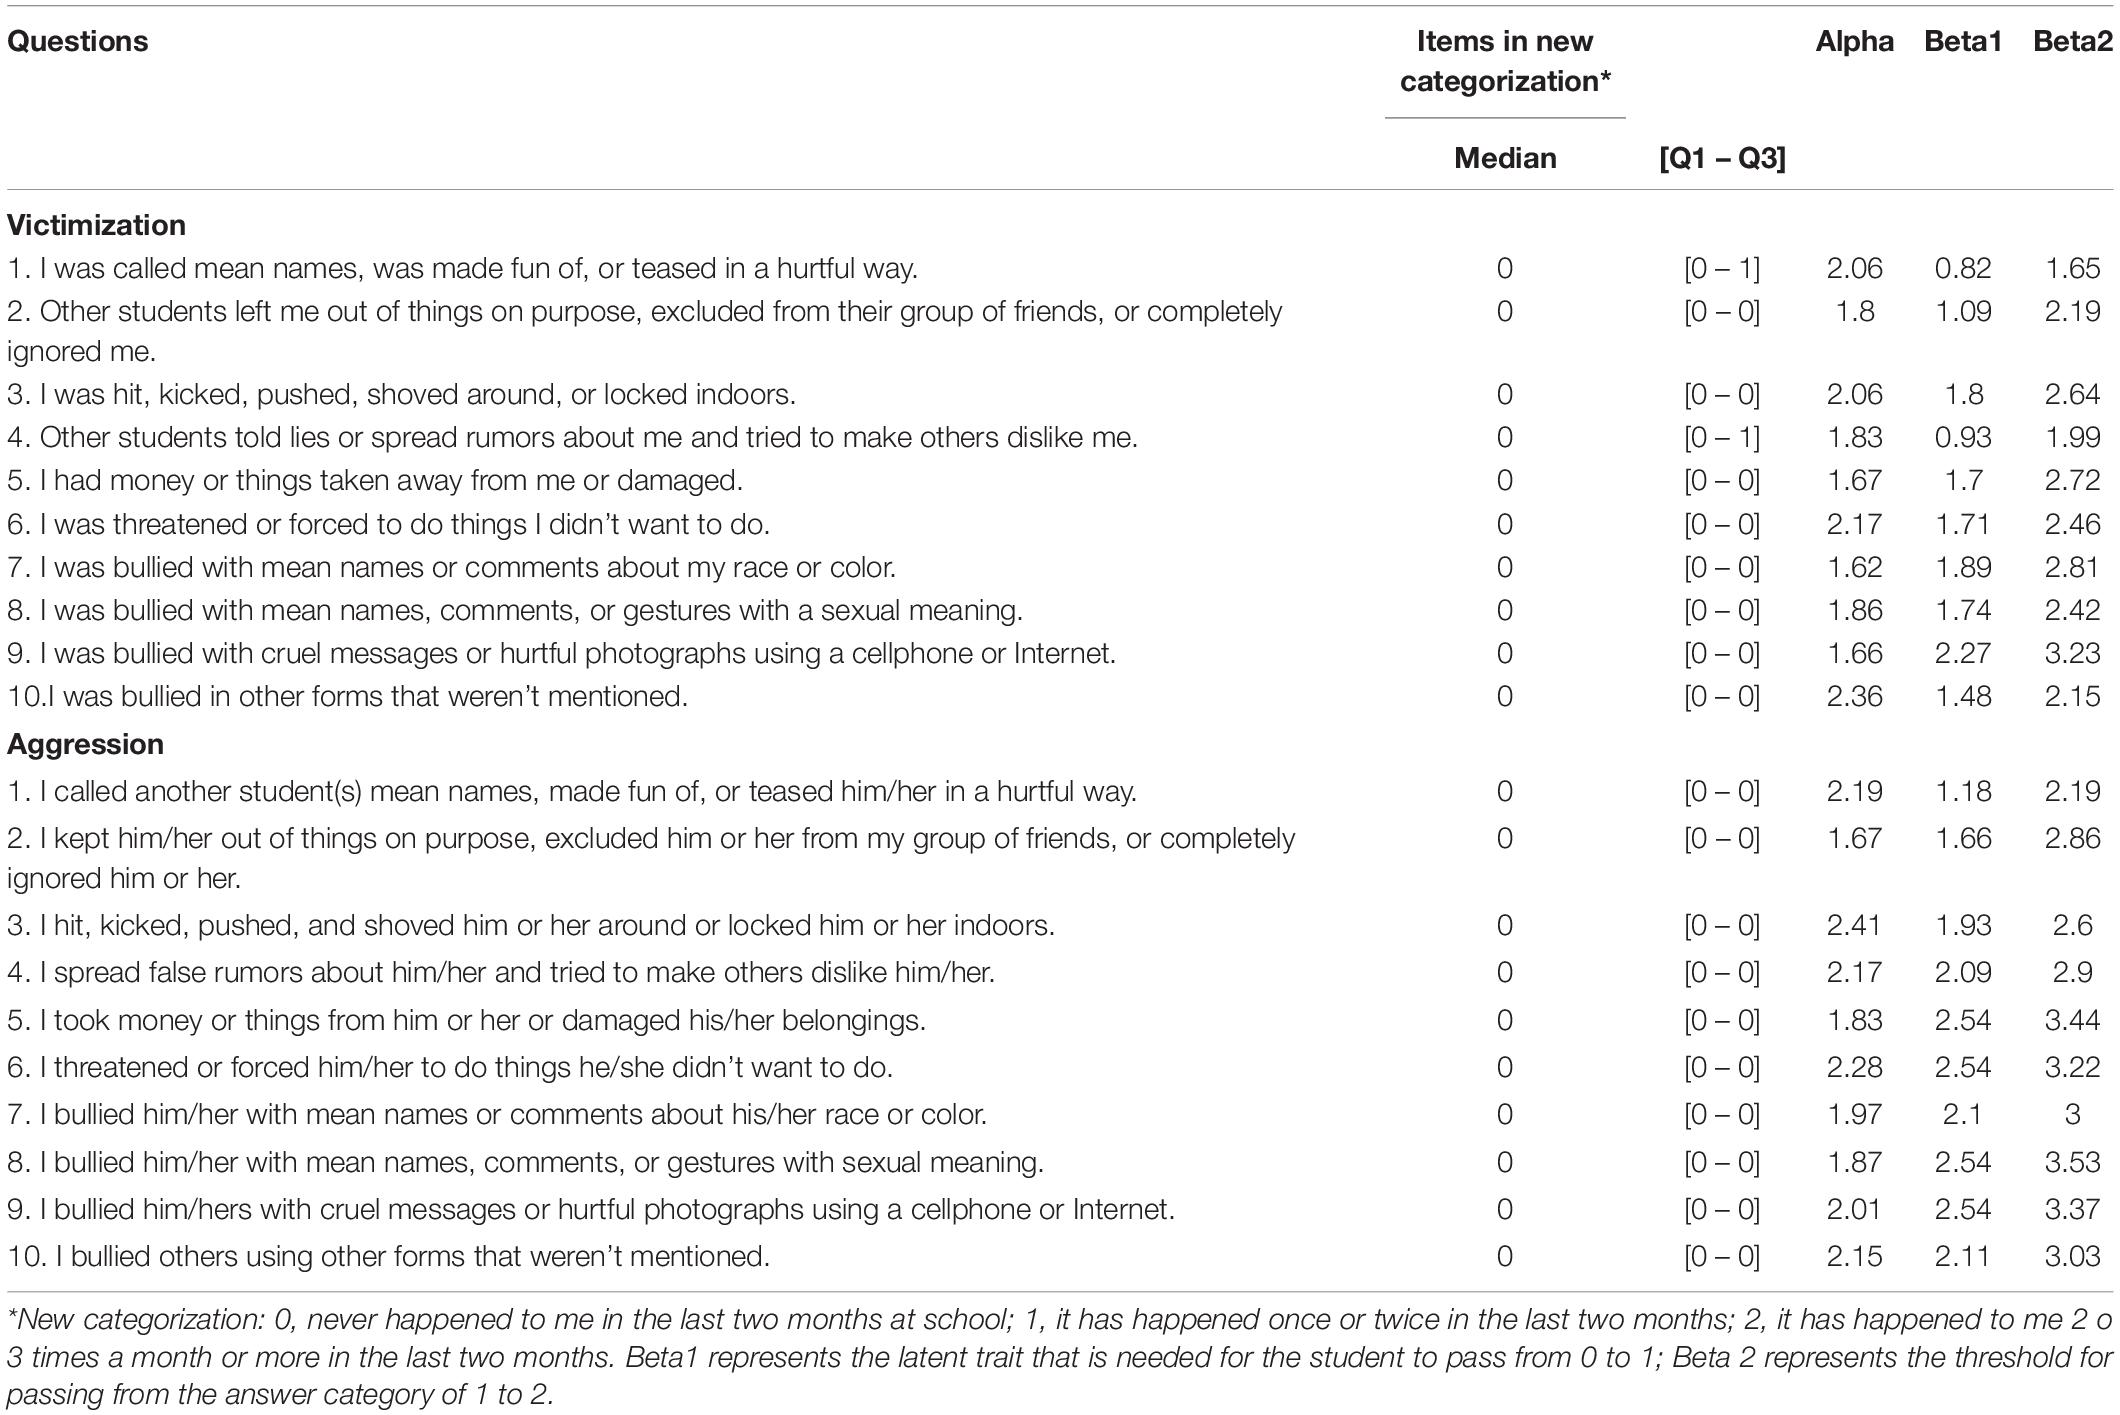
Table 4. Item Response Theory parameter estimates of the OBVQ-R.
The subscale of victimization shows that in eight of the ten items (except items #1 and #4), at least 75% of the students did not suffer bullying at school in the last 2 months. In items #1 and #4, at least 25% of them declared that they were bullied. The 10 items discussed represented the trait of victimization in students. We observed that the discrimination parameters varied between 1.62 (bullying about race and color) and 2.36 (other forms of bullying). Though the 1.62 value was the lowest estimator, it remains high according to Baker’s (2001) classification; therefore, all items in this subscale discriminated the victimization trait very well. In the first (Beta1) and second (Beta 2) thresholds, the item with the lowest latent trait was “#1. I was called mean names, was made fun of, or teased in a hurtful way,” and the item with the highest victimization trait was #9 or cyberbullying.
Every item of the perpetration subscale showed that at least 75% of the students reported not having bullied others at school in the last 2 months. These 10 items had high values or very high values, according to Baker’s (2001) classification, in the trait of perpetration (range between 1.67 and 2.41). Regarding the first threshold (Beta1), the item with the lowest latent trait (1.18) was “#1. I called another student(s) mean names, made fun of, or teased him/her in a hurtful way.” Four items had the highest latent trait (2.54): “#5. I took money or things from him or her or damaged his/her belongings,” “#6. I threatened or forced him/her to do things he/she didn’t want to do,” “#8. I bullied him/her with mean names, comments, or gestures with sexual meaning,” and “#9. I have bullied others with cruel messages or hurtful photographs using a cellphone or Internet.” By analyzing the second threshold (Beta 2), the lowest latent trait (2.19) was “#1. I called another student(s) mean names, made fun of, or teased him/her in a hurtful way,” and “#8. I bullied him/her with mean names, comments, or gestures with sexual meaning” was the highest latent trait (3.53).
Differential Item Functioning by Gender
Descriptive statistics of all items of victimization and perpetration subscales by gender are shown in Table 5. Independently of gender, all items have asymmetric responses and high degree of kurtosis.
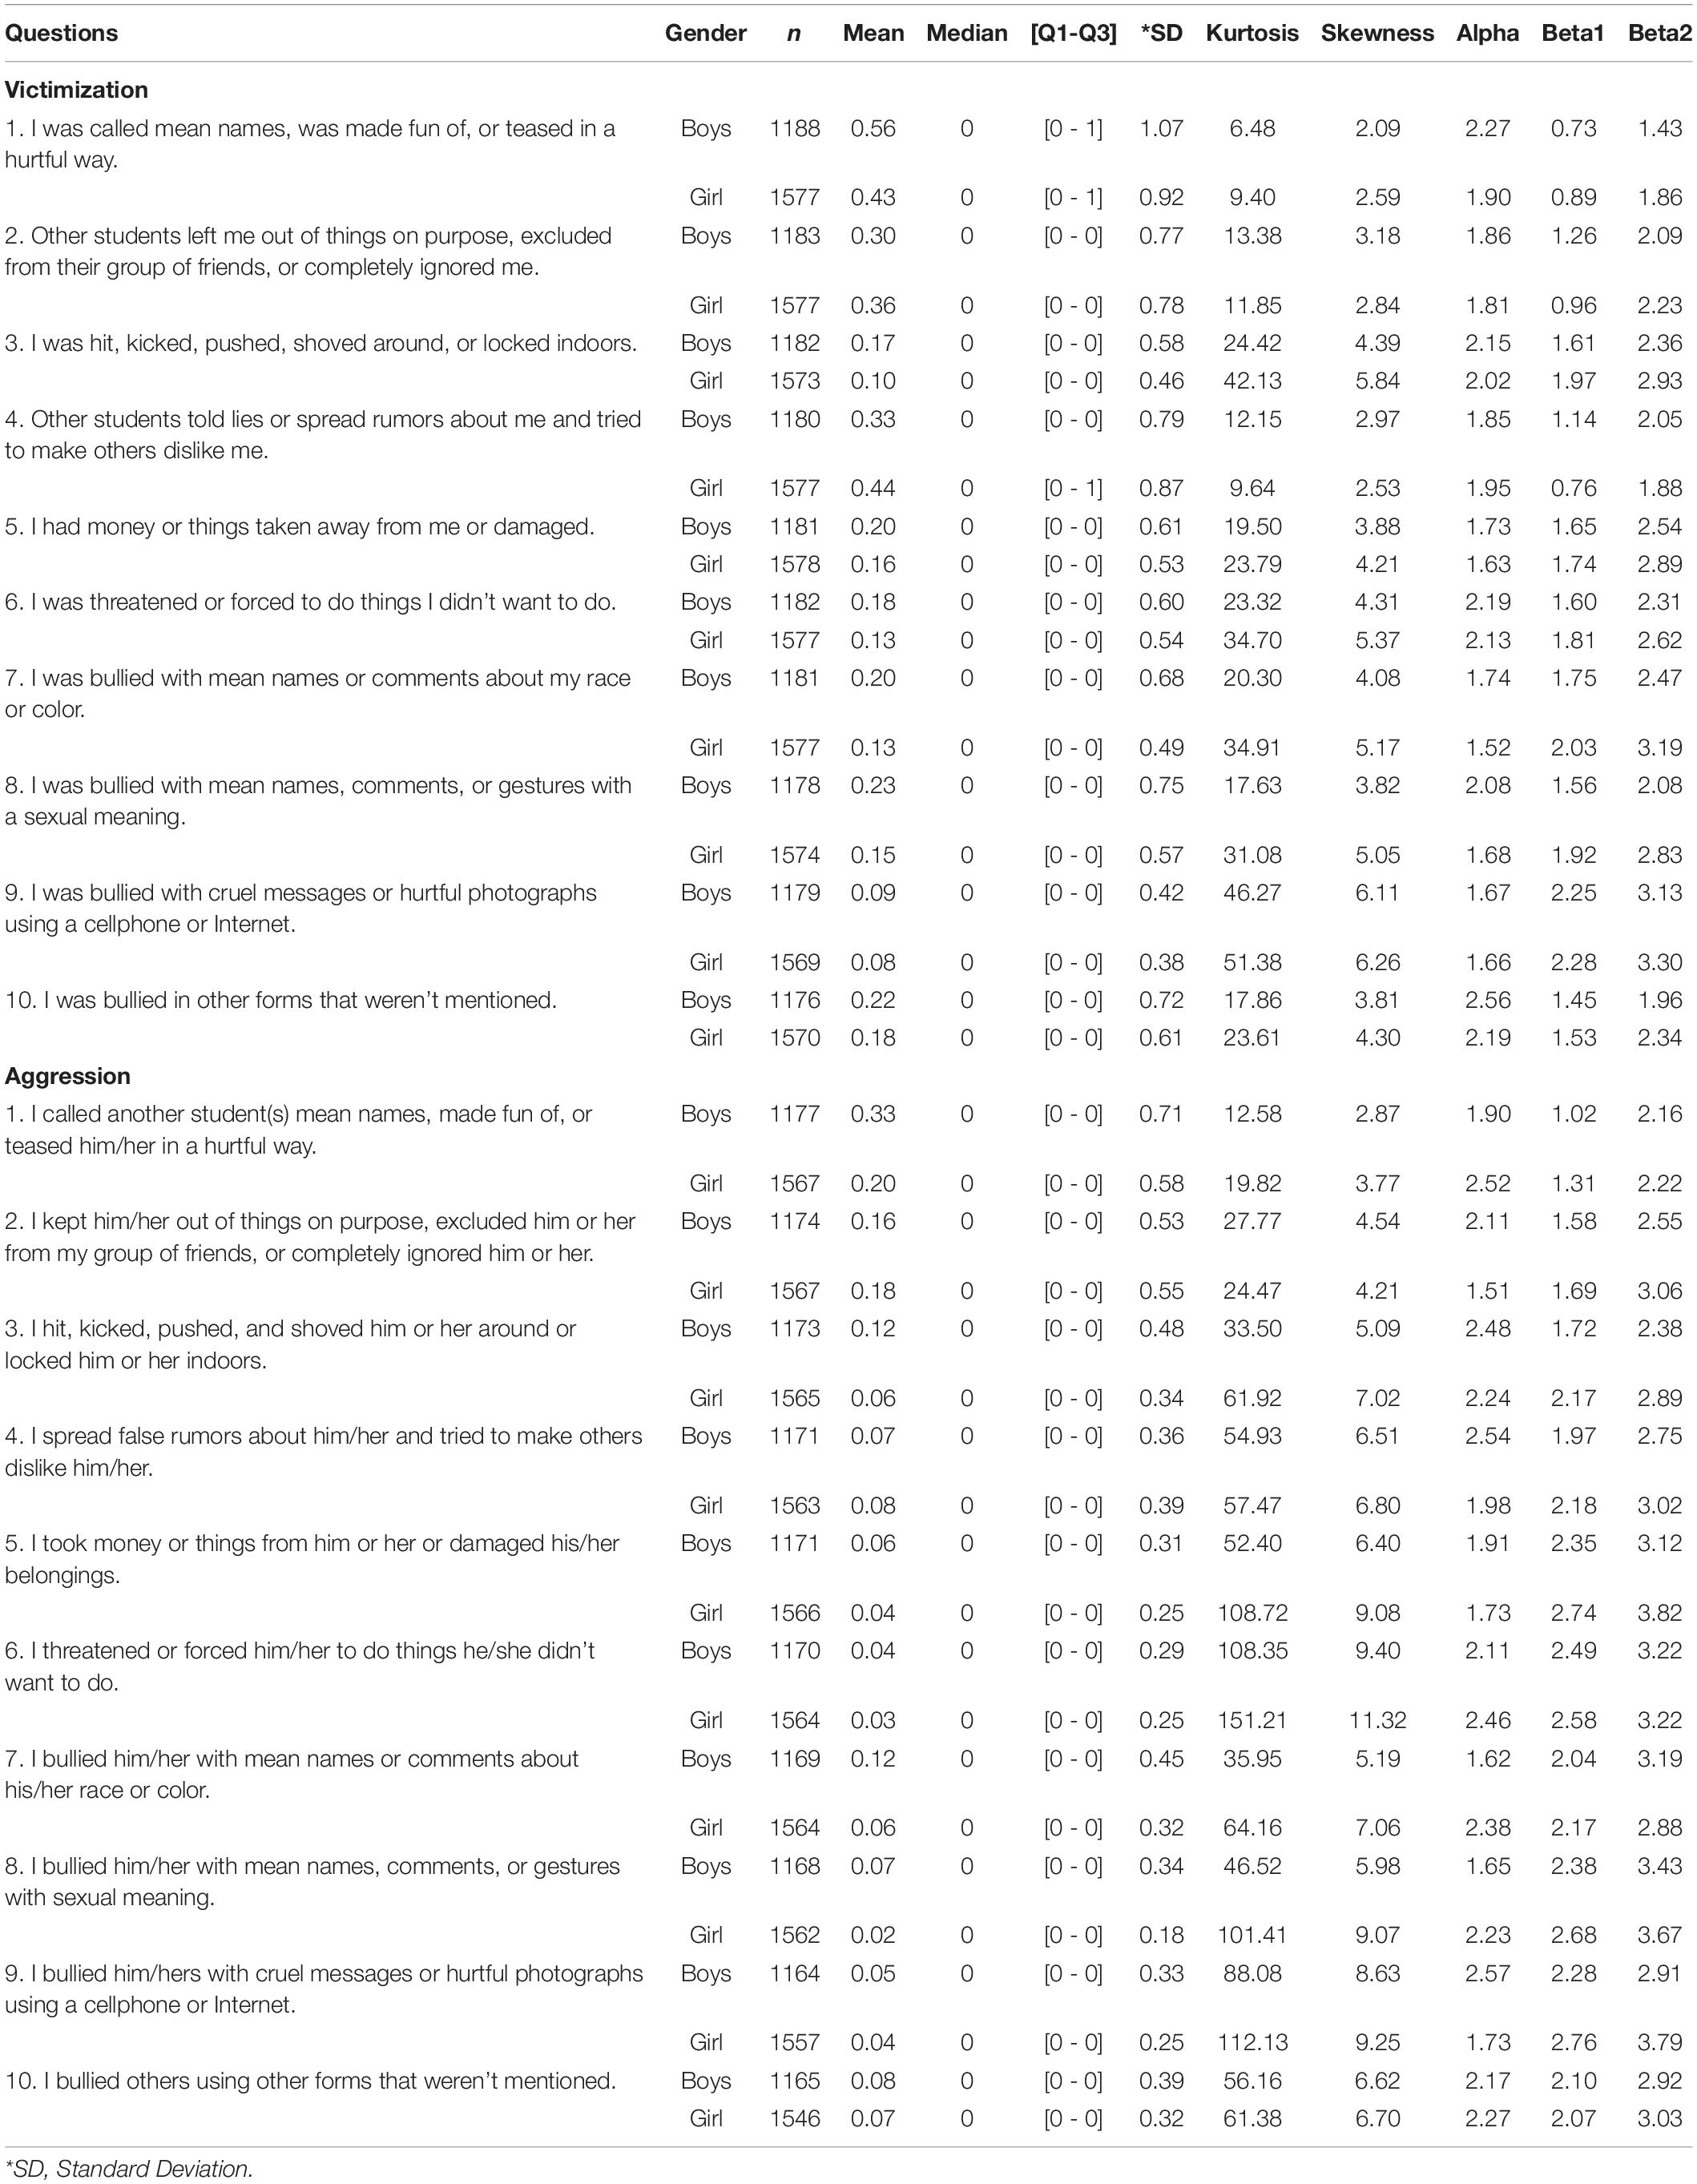
Table 5. Item parameters accounting for differential item functioning by Gender in subscale of victimization and aggression of the OBVQ-R.
The victimization subscale items have a discrimination parameter estimate between 1.52 and 2.19 for girls and between 1.67 and 2.56 for boys. In general, the discrimination parameters of all items (except “#4. Other students told lies or spread rumors about me and tried to make others dislike me”) were higher among boys than girls. We also found that the item “#8. I was bullied with mean names, comments, or gestures with a sexual meaning” had the highest difference between girls and boys, followed by the item “#1. I was called mean names, was made fun of, or teased in a hurtful way.” In general, most items showed that the parameters Beta 1 and Beta 2 were higher in girls than in boys (see Table 6).
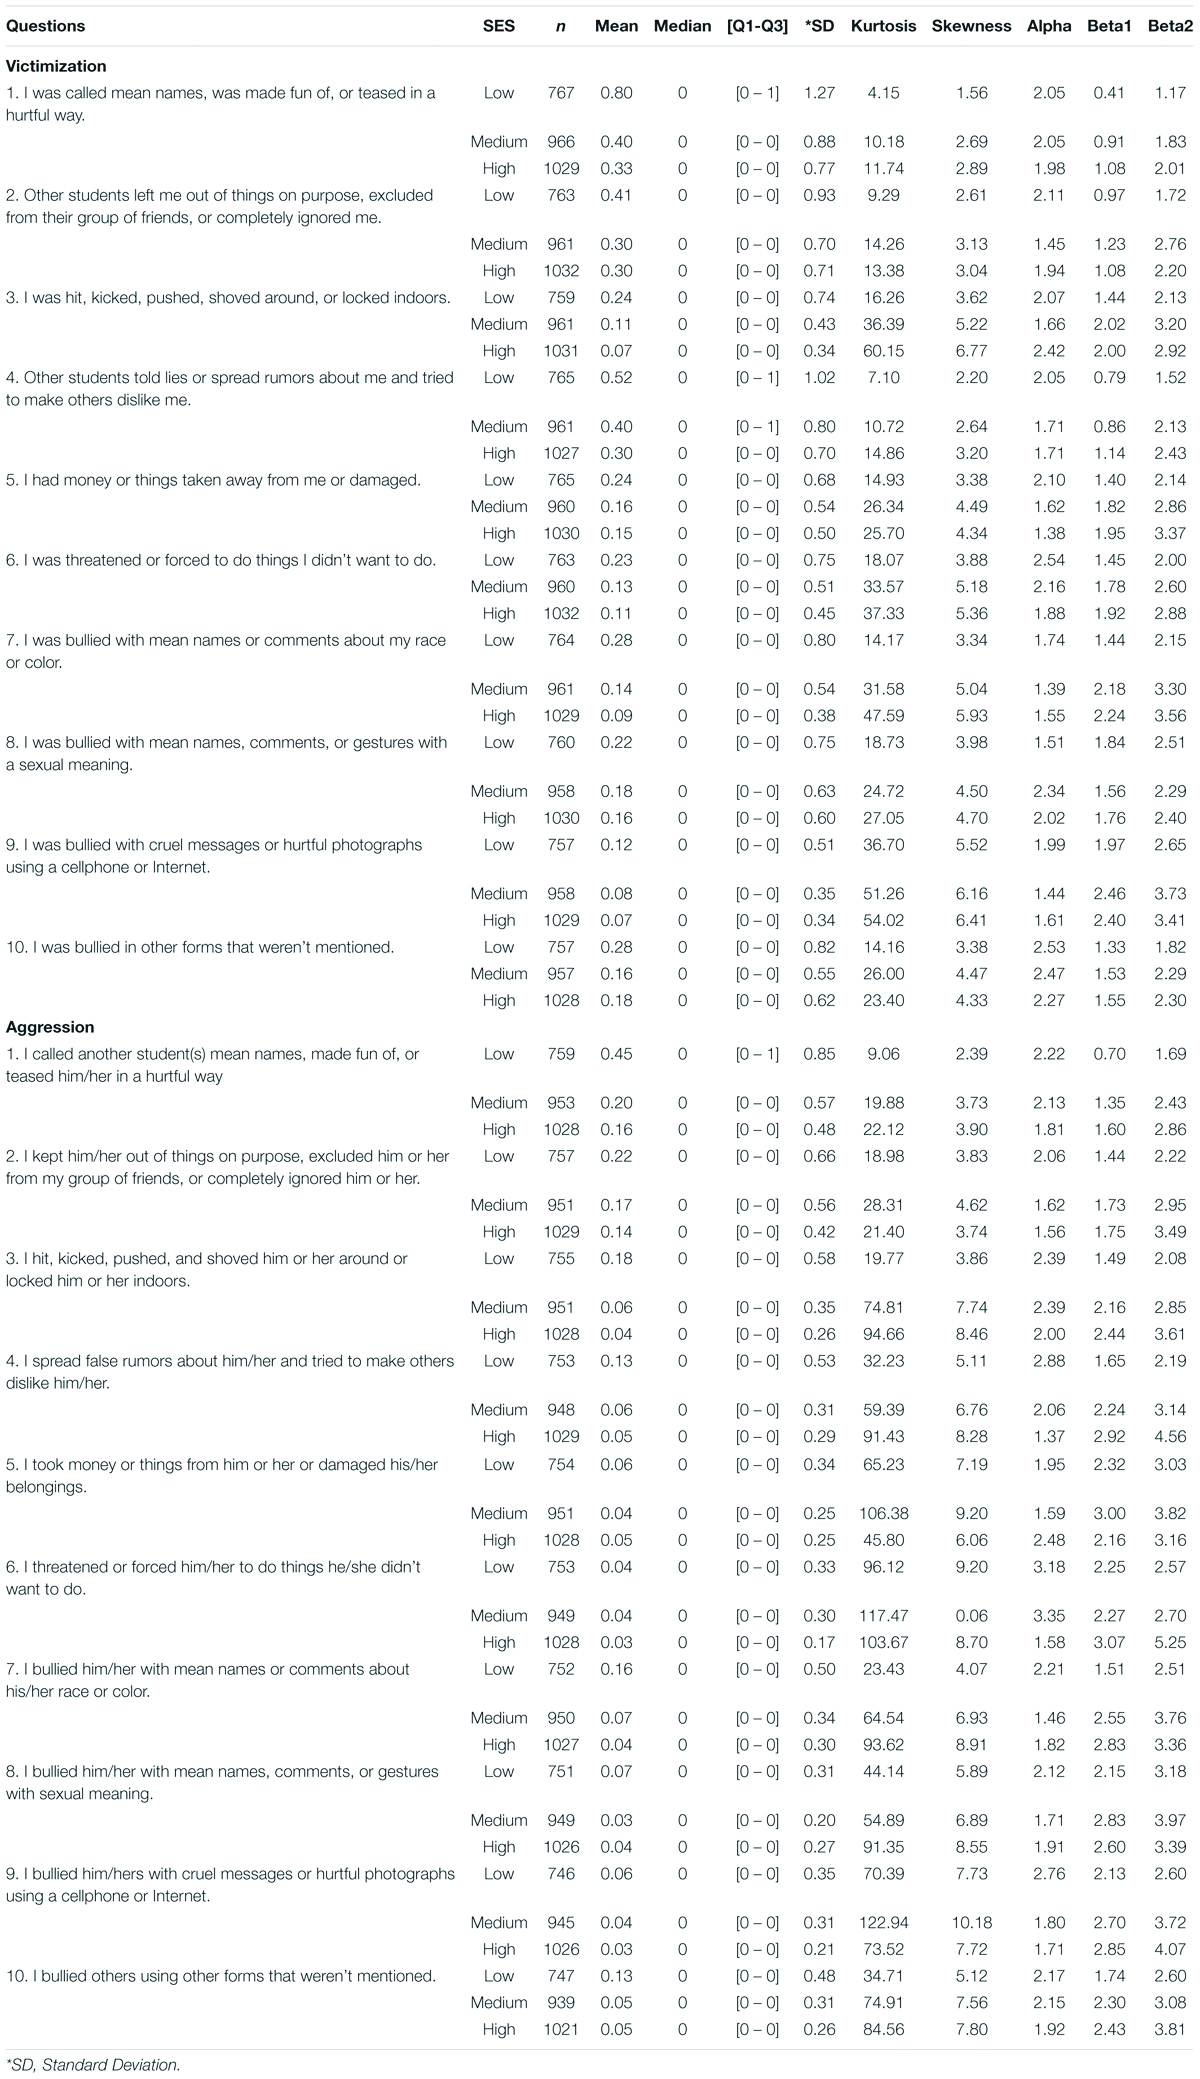
Table 6. Item parameters accounting for differential item functioning by ses in subscale of victimization and aggression of the OBVQ-R.
Regarding the perpetration subscale, we found that the cyberbullying item (#9) had the highest difference between girls (1.73) and boys (2.57), followed by item “#7. I was bullied with mean names or comments about my race or color” (girls, 2.38 and boys, 1.62). Most items showed that the parameters Beta 1 and Beta 2 were higher in girls than in boys (see Table 5).
Differential Item Functioning by SES
Descriptive statistics of all items of the victimization and perpetration subscales by SES are shown in Table 6. All items have asymmetric responses and a high degree of kurtosis, especially among students coming from middle- and high-income schools.
The victimization subscale items had discrimination parameter estimates between 1.55 and 2.54 for students of low-income schools, between 1.39 and 2.53 for students of middle-income schools, and between 1.38 and 2.42 for students of high-income schools. Additionally, most discrimination parameter estimates were higher among students coming from low-income schools, except item “#3. I was hit, kicked, pushed, shoved around, or locked indoors,” which was higher in high-income schools; and item “#8. I was bullied with mean names, comments, or gestures with a sexual meaning,” which was higher in middle-income schools. Most items showed that the parameters Beta 1 and Beta 2 were higher in students coming from middle- or high-income schools than in those students coming from low-income schools (see Table 6), except item “#8. I was bullied with mean names, comments, or gestures with a sexual meaning,” which was higher among students attending low-income schools.
Regarding the perpetration subscale, the items had discrimination parameter estimates between 1.95 and 2.88 for students of low-income schools, between 1.46 and 3.35 for students of middle-income schools, and between 1.37 and 2.48 for students of high-income schools. Most discrimination parameter estimates were higher among students coming from low-income schools, except “#5. I took money or things from him or her or damaged his/her belongings, which was higher in high-income schools” and “#6. I threatened or forced him/her to do things he/she didn’t want to do,” which was higher in middle-income schools. All items showed that the parameters Beta 1 and Beta 2 were higher in students coming from middle- or high-income schools than in those students coming from low-income schools (see Table 6).
Concurrent Evidence of Validation
In the victimization subscale, there was a concordance from 0.14 to 0.36 for similar items; all the concordances are statistically significant (p-values < 0.001). Five out of eight items have a “fair agreement.” On the other hand, four of the eight items analyzed in the perpetration subscale have a “fair agreement” with a range concordance between 0.22 and 0.32 and two items (“I threatened or forced him/her to do things he/she didn’t want to do” and “I bullied him/her with mean names, comments, or gestures with sexual meaning”) had no association between instruments. See Table 7.
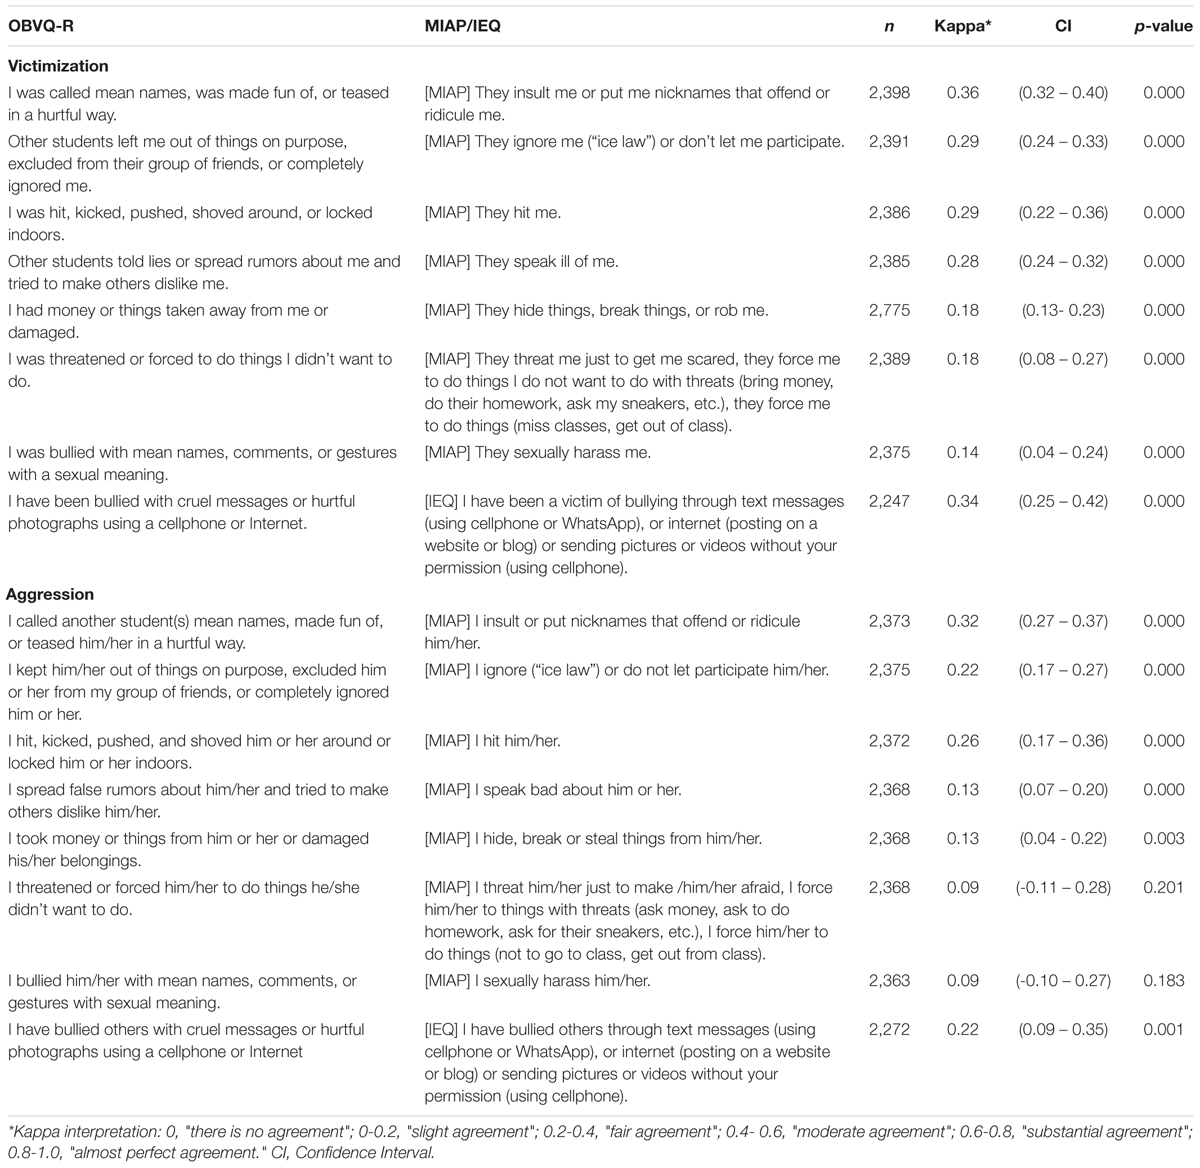
Table 7. Concurrent analysis between OBVQ-R and School Violence between Peers Questionnaire (MIAP)/Internet Experiences Questionnaire (IEQ).
The item about racist bullying was not included in these analyses because the MIAP does not ask about that form of bullying.
Discussion
This is the first study that explores the validity and reliability of the OBVQ-R in Chile. This study confirms the two-factor structure and unidimensionality of the victimization and perpetration subscales (Solberg and Olweus, 2003; Breivik and Olweus, 2015). All items should be considered as key elements of each subscale. Additionally, the model considering both subscales correlated had a better fit than the model exploring both subscales uncorrelated. We also found differences by gender and socioeconomic status of the schools in the expression of the victimization and perpetration traits. The concurrent validation conducted in our study found that the Cohen’s kappa statistic score was in the range of slight or higher agreement between compared instruments. The reliability of the instrument seems good for both subscales.
All items of the questionnaire are important for each subscale, having a high factor loading and high or very high discrimination parameter estimates. In the victimization subscale, the items “I was called mean names,” “I was hit, kicked and pushed,” and “I was threatened or forced to do things” were those with the highest discrimination estimates. It is worth mentioning that the item “other forms of bullying” had the highest alpha score. Some other authors have removed this item from the analyses (Breivik and Olweus, 2015), but our results support the idea of keeping this item as part of the subscale but include additional questions to understand better what students feel about this item. On the other hand, in the perpetration subscale, the item “I was threatened or forced” had the highest alpha score. Several studies have found different discrimination items (Breivik and Olweus, 2015; Resett et al., 2015), highlighting the importance of performing validation studies in different countries to take into account cultural differences. On the other hand, in both subscales, the IRT analysis showed that the item with the lowest-severity parameter was “I was called mean names” and “I called another student(s) mean names,” which may be explained because verbal aggression is one of the most common forms of bullying. In addition, the items with the highest-severity parameters in both subscales were different. In the victimization subscale, the highest-severity parameter was cyberbullying, but in the perpetration subscale it was sexual bullying. The fact that being a victim of cyberbullying was considered a severe form of bullying may explain the findings of other authors about the relationship between cyberbullying and suicidal ideation and attempts (John et al., 2018; Peng et al., 2019). Regarding the perpetration subscale, bullying others with “mean names, comments, or gestures with sexual meaning” can be considered a final step in the aggression possibilities and a more severe behavioral pattern of the perpetrators. These results are similar to those reported by Breivik and Olweus (2015).
We were able to compare different models of the structure of the questionnaire, finding that the best model corresponds to two correlated dimensions of bullying, victimization, and perpetration. This structure has been found in other studies (Kyriakides et al., 2006; Breivik and Olweus, 2015). Additionally, we found that both subscales were correlated, which may be explained because many students who considered themselves as victims were also perpetrators.
We found that boys responded with a lower-severity parameter in almost every item. In the victimization subscale, the exception was the rumors item, in which girls showed a lower-severity parameter than boys. In the perpetration subscale, in the item about threats or being forced to do things, boys and girls had the same-severity parameter, and in the item about racial bullying, girls had a lower-severity parameter than boys. The latter may be explained because boys are more involved in bullying than girls, which is supported by other studies (Zych et al., 2015). About the rumors item, we did not expect to find differences between subscales (in the victimization subscale, girls had lower severity, and in the perpetration subscale, they had higher severity than in boys). Previous literature shows that girls are more involved in relational forms of bullying, either as victims or bullies (Wang et al., 2009). An explanation of this may be that female students in Chile are less likely to recognize themselves as spreading rumors about others because they considered these actions culturally unacceptable, similar to what happens with physical bullying among girls. However, they did recognize being the target of rumors.
We found differences in the expression of bullying by SES. Generally, different forms of victimization and perpetration were more common among students coming from low-income schools. Students from low-income families may have been exposed to a higher proportion of family conflicts than students from families with more economic resources. For instance, there is evidence that children and adolescents of low SES families had a higher chance of being exposed to domestic violence (Cunradi et al., 2002) and harsher punishment (Straus and Stewart, 1999), which may shape how they interact with others in their school context. Moreover, students from high-income families may have a better development of problem-solving skills and prosocial norms and values (Galobardes et al., 2006a,b). It is important to have local information, because other countries do not have the SES differences in the bullying experience that we found in Chile, and this instrument would allow us to conduct future comparisons (Tippett and Wolke, 2014).
In terms of the concurrent analysis of the OBVQ-R with the MIAP and the IEQ, we found differences between both subscales. The concordance between the items of the three instruments for the victimization subscale ranged from “slight agreement” to “fair agreement” but was significant in all cases. We could say that students who were perceived as victims of bullying were also perceived as victims of school violence in general; however, it seems that both concepts are not quite the same for them considering the small degree of agreement. These results highlight the idea that school violence and bullying are perceived as two different concepts by adolescents. In the perpetration subscale, the concordance between the items of three instruments was between 0.09 and 0.32. Only in two items, there was no correlation (#6. I threatened or forced him/her to do things he/she didn’t want to do, and #8. I bullied him/her with mean names, comments, or gestures with sexual meaning”). Regarding these last two items, the formulation of the sentences was slightly different between the OBVQ-R and the MIAP. For instance, when it comes to threats, in the MIAP, both items refer to actions one can do to force another person to do things, including a range of examples. The OBVQ-R takes a more general approach, without specifying the action or the consequence of the behavior. For the items about sexual bullying, the MIAP asks for “sexual harassment,” unlike the OBVQ-R, which asks for “being bullied with names, comments or gestures with sexual meaning.” Other authors also take the view that the definition of sexual harassment is broad and it includes a range of behaviors (McMaster et al., 2002; Chiodo et al., 2009). These researchers also postulate that sexual harassment may include in the same definition severe (e.g., sexual assault) and less severe behaviors (e.g., sexual jokes or comments) (McMaster et al., 2002). In another study, Shute et al. (2008) asked adolescents about sexual harassment and victimization and found that physical sexual harassment was not as frequent as verbal sexual harassment. According to these studies, sexual harassment is a concept that may include many and varied behaviors; therefore, in our study, students may have considered a more general definition of sexual harassment (in the MIAP), taking together severe and less severe actions, while in the OBVQ-R, students may have answered it according to a more specific and narrower concept.
We can mention several limitations of this study. First, we used retrospective, self-reported measures in an adolescent population, which may introduce reporting bias (Pokorski et al., 1994) and social desirability bias (Brittingham et al., 1998), especially for the aggressive behaviors. However, the biases mentioned above do not threaten the validity of self-reported measurements among students (Brener et al., 2003). Additionally, when administering the OBVQ-R scale, research assistants did not report any complaints about the comprehension of items. Second, this study followed a cross-sectional design, which does not allow inferences about the long-term effects of these behaviors. Third, a 28% (9/32) of the invited schools agreed to participate. This may have introduced a selection bias in the results. However, we managed to include schools from different socioeconomic backgrounds and with similar participation proportion in the total sample of students, reducing the risk of bias. Fourth, the MIAP and IEQ questionnaires, used to compare the information gathered with the OBVQ-R, were the only available instruments with results published in scientific journals in Chile. Even though we recognize that the psychometric properties and features of these instruments were not ideal, we considered it important to make available to the audience and potential users the comparison between the instruments to provide as much information as possible to make informed decisions in the future when selecting a questionnaire to evaluate bullying experiences. Fifth, even though the sample size was large and aimed to represent the adolescent population in Chile, there could be regional differences in bullying among adolescents living in the North and South regions in Chile. Finally, it is important to mention that there is one item that requires further exploration for future research: #10, exploring “other” forms of bullying. Students did not have any problem answering this item; however, it is difficult to know, as it is stated in the questionnaire, what the other forms of bullying the students are referring to. Therefore, we suggest continuing using this item but including a new question where students can write the other forms of bullying they are referring to, to understand this item better.
Conclusion
The OBVQ-R appears to have a good item structure, validity, and reliability when assessing bullying among adolescent students in Chile. We have provided evidence that this is a two-factor structure questionnaire, and the victimization and perpetration subscales gather information about several forms of bullying. This instrument may be useful for studying the prevalence of bullying and assessing the effectiveness of anti-bullying programs.
Data Availability Statement
The raw data supporting the conclusions of this article will be made available by the authors, without undue reservation.
Ethics Statement
The studies involving human participants were reviewed and approved by The Ethical Committee of the University de los Andes, Chile. Written informed consent to participate in this study was provided by the participants’ legal guardian/next of kin.
Author Contributions
JG, CS, CR-B, and RA conceived and designed the study and supervised data collection. JG, MG, and DV analyzed and interpreted the data and produced the draft of the manuscript. RA supervised all steps in the study. All authors provided a critical revision of the manuscript.
Funding
This study was developed under the project “Evaluation of the effectiveness of the KiVa antibullying program in Chile, with and without the digital component” (AKA-EDU/15), funded by CONICYT and the Academy of Finland. The writing of this paper was partially financed by ANID – Millennium Science Initiative Program – NCS17_035.
Conflict of Interest
The authors declare that the research was conducted in the absence of any commercial or financial relationships that could be construed as a potential conflict of interest.
Acknowledgments
We thank all the students who participated in this study, their families, and the research team that helped with the investigation.
Supplementary Material
The Supplementary Material for this article can be found online at: https://www.frontiersin.org/articles/10.3389/fpsyg.2021.578661/full#supplementary-material
References
Baker, F. B. (2001). The Basics of Item Response Theory, 2nd Edn. College Park, MD: ERIC Clearinghouse on Assessment and Evaluation. Available online at: http://echo.edres.org:8080/irt/baker/
Bevans, K. B., Bradshaw, C. P., and Waasdorp, T. E. (2013). Gender bias in the measurement of peer victimization: an application of item response theory. Aggress. Behav. 39, 370–380. doi: 10.1002/ab.21486
Bollen, K. A. (1990). Overall fit in covariance structure models: two types of sample size effects. Psychol. Bull. 107, 256–259. doi: 10.1037/0033-2909.107.2.256
Bollen, K. A., and Long, J. S. (1993). Testing Structural Equation Models. Thousand Oaks, CA: SAGE Publications.
Breivik, K., and Olweus, D. (2015). An item response theory analysis of the Olweus Bullying scale. Aggress. Behav. 41, 1–13. doi: 10.1002/ab.21571
Brener, N. D., Billy, J. O., and Grady, W. R. (2003). Assessment of factors affecting the validity of self-reported health-risk behavior among adolescents: evidence from the scientific literature. J. Adolesc. Health 33, 436–457.
Brittingham, A., Tourangeau, R., and Kay, W. (1998). Reports of smoking in a national survey: data from screening and detailed interviews, and from self- and interviewer-administered questions. Ann. Epidemiol. 8, 393–401.
Brown, C. F., Demaray, M. K., and Secord, S. M. (2014). Cyber victimization in middle school and relations to social emotional outcomes. Comp. Hum. Behav. 35, 12–21. doi: 10.1016/j.chb.2014.02.014
Browne, M. W. (1984). Asymptotically distribution-free methods for the analysis of covariance structures. Br. J. Math. Stat. Psychol. 37, 62–83. doi: 10.1111/j.2044-8317.1984.tb00789.x
Cao, Q., Xu, X., Xiang, H., Yang, Y., Peng, P., and Xu, S. (2020). Bullying victimization and suicidal ideation among Chinese left-behind children: mediating effect of loneliness and moderating effect of gender. Child. Youth Serv. Rev. 111:104848. doi: 10.1016/j.childyouth.2020.104848
Chalmers, R. P. (2012). mirt: a multidimensional item response theory package for the R environment. J. Stat. Softw. 48:29. doi: 10.18637/jss.v048.i06
Chiodo, D., Wolfe, D. A., Crooks, C., Hughes, R., and Jaffe, P. (2009). Impact of sexual harassment victimization by peers on subsequent adolescent victimization and adjustment: a longitudinal study. J. Adolesc. Health 45, 246–252. doi: 10.1016/j.jadohealth.2009.01.006
Crothers, L. M., and Levinson, E. M. (2004). Assessment of bullying: a review of methods and instruments. J. Counsel. Dev. 82, 496–503. doi: 10.1002/j.1556-6678.2004.tb00338.x
Cunradi, C. B., Caetano, R., and Schafer, J. (2002). Socioeconomic predictors of intimate partner violence among white, black, and hispanic couples in the United States. J. Fam. Viol. 17, 377–389. doi: 10.1023/A:1020374617328
Evans, C. B. R., Fraser, M. W., and Cotter, K. L. (2014). The effectiveness of school-based bullying prevention programs: a systematic review. Aggres. Viol. Behav. 19, 532–544. doi: 10.1016/j.avb.2014.07.004
Flora, D. B., and Curran, P. J. (2004). An empirical evaluation of alternative methods of estimation for confirmatory factor analysis with ordinal data. Psychol. Methods 9, 466–491. doi: 10.1037/1082-989X.9.4.466
Fornell, C., and Larcker, D. F. (1981). Evaluating structural equation models with unobservable variables and measurement error. J. Market. Res. 18, 39–50. doi: 10.2307/3151312
Fredrick, S. S., and Demaray, M. K. (2018). Peer victimization and suicidal ideation: the role of gender and depression in a school-based sample. J. Schl. Psychol. 67, 1–15. doi: 10.1016/j.jsp.2018.02.001
Gaete, J., Tornero, B., Valenzuela, D., Rojas-Barahona, C. A., Salmivalli, C., Valenzuela, E., et al. (2017). Substance use among adolescents involved in bullying: a cross-sectional multilevel study. Front. Psychol. 8:1056. doi: 10.3389/fpsyg.2017.01056
Galobardes, B., Shaw, M., Lawlor, D. A., Lynch, J. W., and Davey Smith, G. (2006a). Indicators of socioeconomic position (part 1). J. Epidemiol. Commun. Health 60, 7–12. doi: 10.1136/jech.2004.023531
Galobardes, B., Shaw, M., Lawlor, D. A., Lynch, J. W., and Davey Smith, G. (2006b). Indicators of socioeconomic position (part 2). J. Epidemiol. Commun. Health 60, 95–101. doi: 10.1136/jech.2004.028092
Gonçalves, F. G., Heldt, E., Peixoto, B. N., Rodrigues, G. A., Filipetto, M., and Guimarães, L. S. P. (2016). Construct validity and reliability of Olweus Bully/Victim Questionnaire – Brazilian version. Psicol. Reflexão Crít. 29:27. doi: 10.1186/s41155-016-0019-7
Green, J. G., Felix, E. D., Sharkey, J. D., Furlong, M. J., and Kras, J. E. (2013). Identifying bully victims: definitional versus behavioral approaches. Psychol. Assess. 25, 651–657. doi: 10.1037/a0031248
Haynie, D. L., Nansel, T., Eitel, P., Crump, A. D., Saylor, K., Yu, K., et al. (2001). Bullies, victims, and bully/victims::distinct groups of at-risk youth. J. Early Adoles. 21, 29–49. doi: 10.1177/0272431601021001002
Heerde, J. A., and Hemphill, S. A. (2019). Are bullying perpetration and victimization associated with adolescent deliberate self-harm? A meta-analysis. Arch. Suicide Res. 23, 353–381. doi: 10.1080/13811118.2018.1472690
Hu, L. T., and Bentler, P. M. (1995). “Evaluating model fit,” in Structural Equation Modeling: Concepts, Issues, and Applications, ed. R. H. Hoyle, (Thousand Oaks, CA: Sage Publications, Inc), 76–99.
Hu, L. T., and Bentler, P. M. (1999). Cutoff criteria for fit indexes in covariance structure analysis: conventional criteria versus new alternatives. Struct. Equ. Model. Multidiscipl. J. 6, 1–55. doi: 10.1080/10705519909540118
Jadambaa, A., Thomas, H. J., Scott, J. G., Graves, N., Brain, D., and Pacella, R. (2019). Prevalence of traditional bullying and cyberbullying among children and adolescents in Australia: a systematic review and meta-analysis. Aust. N. Z. J. Psychiatry 53, 878–888. doi: 10.1177/0004867419846393
John, A., Glendenning, A. C., Marchant, A., Montgomery, P., Stewart, A., Wood, S., et al. (2018). Self-Harm, suicidal behaviours, and cyberbullying in children and young people: systematic review. J. Med. Internet Res. 20:e129. doi: 10.2196/jmir.9044
Jöreskog, K. G., and Sörbom, D. (1993). LISREL 8: Structural Equation Modeling with the SIMPLIS Command Language. Lincolnwood, IL: Scientific Software International.
Kowalski, R. M., and Limber, S. P. (2007). Electronic bullying among middle school students. J. Adoles. Health 41(Suppl. 6), S22–S30. doi: 10.1016/j.jadohealth.2007.08.017
Kyriakides, L., Kaloyirou, C., and Lindsay, G. (2006). An analysis of the revised olweus bully/victim questionnaire using the rasch measurement model. Br. J. Educ. Psychol. 76(Pt 4), 781–801. doi: 10.1348/000709905x53499
Landis, J. R., and Koch, G. G. (1977). An application of hierarchical kappa-type statistics in the assessment of majority agreement among multiple observers. Biometrics 33, 363–374. doi: 10.2307/2529786
Lecannelier, F., Varela, J., Astudillo, J., Rodríguez, J., and Orellana, P. (2010). “Adaptación y validación del instrumento “internet experiences questionnaire” a escolares que cursan 7’ año básico a 4’ medio, de la ciudad de Santiago de Chile, en el año 2008. En: Paz Ciudadana Ed,” Paper presented at the Sexto Congreso Nacional de Investigación Sobre Violencia y Delincuencia, Santiago.
Lecannelier, F., Varela, J., Rodríguez, J., Hoffmann, M., Flores, F., and Ascanio, L. (2011). Validación del Cuestionario de Maltrato entre Iguales por Abuso de Poder (MIAP) para escolares. Rev. Méd. Chile 139, 474–479.
Malta, D. C., Silva, M. A. I., Mello, F. C. M. D., Monteiro, R. A., Sardinha, L. M. V., Crespo, C., et al. (2010). Bullying nas escolas brasileiras: resultados da Pesquisa Nacional de Saúde do Escolar (PeNSE), 2009. Ciência Saúde Coletiva 15, 3065–3076.
McDougall, P., and Vaillancourt, T. (2015). Long-term adult outcomes of peer victimization in childhood and adolescence: pathways to adjustment and maladjustment. Am. Psychol. 70, 300–310. doi: 10.1037/a0039174
McMaster, L. E., Connolly, J., Pepler, D., and Craig, W. M. (2002). Peer to peer sexual harassment in early adolescence: a developmental perspective. Dev. Psychopathol. 14, 91–105. doi: 10.1017/s0954579402001050
Menesini, E., and Salmivalli, C. (2017). Bullying in schools: the state of knowledge and effective interventions. Psychol. Health Med. 22(Suppl. 1), 240–253. doi: 10.1080/13548506.2017.1279740
Modecki, K. L., Minchin, J., Harbaugh, A. G., Guerra, N. G., and Runions, K. C. (2014). Bullying prevalence across contexts: a meta-analysis measuring cyber and traditional bullying. J. Adolesc. Health 55, 602–611. doi: 10.1016/j.jadohealth.2014.06.007
Muthén, B. (1984). A general structural equation model with dichotomous, ordered categorical, and continuous latent variable indicators. Psychometrika 49, 115–132. doi: 10.1007/BF02294210
National Academies of Sciences, Engineering, and Medicine. (2016). Preventing Bullying Through Science, Policy, and Practice. Washington, DC: The National Academies Press. doi: 10.17226/23482.
Nelson, H. J., Burns, S. K., Kendall, G. E., and Schonert-Reichl, K. A. (2018). The factors that influence and protect against power imbalance in covert bullying among preadolescent children at school: a thematic analysis. J. Schl. Nurs. 34, 281–291. doi: 10.1177/1059840517748417
Olweus, D. (1978). Aggression in the Schools: Bullies and Whipping Boys. Washington, DC: Hemisphere Publishing Corporation.
Peng, Z., Klomek, A. B., Li, L., Su, X., Sillanmäki, L., Chudal, R., et al. (2019). Associations between Chinese adolescents subjected to traditional and cyber bullying and suicidal ideation, self-harm and suicide attempts. BMC Psychiatry 19:324. doi: 10.1186/s12888-019-2319-9
Pokorski, T. L., Chen, W. W., and Bertholf, R. L. (1994). Use of urine cotinine to validate smoking self-reports in U.S. Navy recruits. Addict. Behav. 19, 451–454.
Polanin, J. R., Espelage, D. L., and Pigott, T. D. (2012). A meta-analysis of school-based bullying prevention programs’ effects on bystander intervention behavior. Schl. Psychol. Rev. 41, 47–65. doi: 10.1080/02796015.2012.12087375
Raskauskas, J., and Stoltz, A. D. (2007). Involvement in traditional and electronic bullying among adolescents. Dev. Psychol. 43, 564–575. doi: 10.1037/0012-1649.43.3.564
Reise, S. P., Ainsworth, A. T., and Haviland, M. G. (2005). Item response theory: fundamentals, applications, and promise in psychological research. Curr. Direct. Psychol. Sci. 14, 95–101. doi: 10.1111/j.0963-7214.2005.00342.x
Resett, S. (2011). Aplicación del cuestionario de agresores/víctimas de Olweus a una muestra de adolescentes argentinos. Revista de Psicología de la Universidad Católica Argentina 13, 27–44.
Resett, S. (2016). Una caracterización del acoso escolar en la adolescencia: quiénes, cómo y dónde se agrede. Perspect. Psicol. 13, 11–20.
Resett, S., Costa, D., Murata, C., and Falcone, N. (2015). Equivalencia factorial del Cuestionario de Agresores/Victimas de Olweus según género. Interdisciplinaria 32, 169–181.
Rey, L., Quintana-Orts, C., Mérida-López, S., and Extremera, N. (2019). Being bullied at school: gratitude as potential protective factor for suicide risk in adolescents. Front. Psychol. 10:662. doi: 10.3389/fpsyg.2019.00662
Rivers, I. (2011). Morbidity among bystanders of bullying behavior at school: concepts, concerns, and clinical/research issues. Int. J. Adolesc. Med. Health 24, 11–16. doi: 10.1515/ijamh.2012.003
Ronan, G. F., Dreer, L., Maurelli, K., Ronan, D., and Gerhart, J. (2013). Practitioner’s Guide to Empirically Supported Measures of Anger, Aggression, and Violence. Berlin: Springer International Publishing.
Rosseel, Y. (2012). lavaan: an R package for structural equation modeling. J. Stat. Softw. 48:36. doi: 10.18637/jss.v048.i02
Salmivalli, C., and Peets, K. (2018). “Bullies, victims, bully-victim relationships in middle childhood and adolescence,” in Handbook of Peer Interactions, Relationships, and Groups, eds W. M. Bukowski, B. Laursen, and K. H. Rubin, (New York, NY: Guilford Press).
Samejima, F. (1969). Estimation of latent ability using a response pattern of graded scores. Psychometrika 34, 1–97. doi: 10.1007/BF03372160
Schumacker, R. E., and Lomax, R. G. (2012). A Beginner’s Guide to Structural Equation Modeling, 3rd Edn. Milton Park: Taylor & Francis.
Shute, R., Owens, L., and Slee, P. (2008). Everyday victimization of adolescent girls by boys: sexual harassment, bullying or aggression? Sex Roles 58, 477–489. doi: 10.1007/s11199-007-9363-5
Skapinakis, P., Bellos, S., Gkatsa, T., Magklara, K., Lewis, G., Araya, R., et al. (2011). The association between bullying and early stages of suicidal ideation in late adolescents in Greece. BMC Psychiatry 11:22. doi: 10.1186/1471-244X-11-22
Smith, P. K., Kwak, K., and Toda, Y. (2016). School Bullying in Different Cultures. Cambridge: Cambridge University Press.
Smith, P. K., López-Castro, L., Robinson, S., and Görzig, A. (2019). Consistency of gender differences in bullying in cross-cultural surveys. Aggres. Viol. Behav. 45, 33–40. doi: 10.1016/j.avb.2018.04.006
Solberg, M. E., and Olweus, D. (2003). Prevalence estimation of school bullying with the Olweus Bully/Victim Questionnaire. Aggres. Behav. 29, 239–268. doi: 10.1002/ab.10047
Straus, M. A., and Stewart, J. H. (1999). Corporal punishment by american parents: national data on prevalence, chronicity, severity, and duration, in relation to child and family characteristics. Clin. Child Fam. Psychol. Rev. 2, 55–70. doi: 10.1023/A:1021891529770
Tippett, N., and Wolke, D. (2014). Socioeconomic status and bullying: a meta-analysis. Am. J. Publ. Health 104, e48–e59. doi: 10.2105/AJPH.2014.301960
Vessey, J., Strout, T. D., DiFazio, R. L., and Walker, A. (2014). Measuring the youth bullying experience: a systematic review of the psychometric properties of available instruments. J. Schl. Health 84, 819–843. doi: 10.1111/josh.12210
Wang, J., Iannotti, R. J., and Nansel, T. R. (2009). School bullying among adolescents in the United States: physical, verbal, relational, and cyber. J. Adolesc. Health 45, 368–375. doi: 10.1016/j.jadohealth.2009.03.021
Zequinão, M. A., Medeiros, P. D., Pereira, B., and Cardoso, F. L. (2016). Association between spectator and other roles in school bullying. J. Hum. Growth Dev. 26, 352–359.
Keywords: validity, reliability, bullying, OBVQ-R, questionnaire, children, adolescents, Chile
Citation: Gaete J, Valenzuela D, Godoy MI, Rojas-Barahona CA, Salmivalli C and Araya R (2021) Validation of the Revised Olweus Bully/Victim Questionnaire (OBVQ-R) Among Adolescents in Chile. Front. Psychol. 12:578661. doi: 10.3389/fpsyg.2021.578661
Received: 30 June 2020; Accepted: 10 March 2021;
Published: 12 April 2021.
Edited by:
Meryem Yilmaz Soylu, University of Nebraska-Lincoln, United StatesReviewed by:
Beatriz Pereira, University of Minho, PortugalFelipe Almeida Picon, Federal University of Rio Grande do Sul, Brazil
Copyright © 2021 Gaete, Valenzuela, Godoy, Rojas-Barahona, Salmivalli and Araya. This is an open-access article distributed under the terms of the Creative Commons Attribution License (CC BY). The use, distribution or reproduction in other forums is permitted, provided the original author(s) and the copyright owner(s) are credited and that the original publication in this journal is cited, in accordance with accepted academic practice. No use, distribution or reproduction is permitted which does not comply with these terms.
*Correspondence: Jorge Gaete, jgaete@uandes.cl