 Kaicheng Liao1
 Geng Peng
- 1School of Economics and Management, Tongji University, Shanghai, China
- 2School of Finance, Xinjiang University of Finance and Economics, Urumqi, China
- 3Business School, Jiangsu University of Technology, Changzhou, China
- 4School of Economics and Management, Xi’an University of Technology, Xi’an, China
Till now, comprehensive and quantitatively meaningful analyses of stock market participation outcomes of retail investors have been limited by data sources in developing countries. This article devised a special questionnaire related to stock investment to measure the financial literacy (FL) and stock investment return (SIR) for the subjects with stockownership in China and to theoretically and empirically study the effects of objective FL, self-assessed FL, and their composite FL on SIR. The results of the comparative analysis showed that self-assessed FL has a greater effect on SIR than objective FL, and the effect is mediated by risk preference. In addition, we found that competent and overconfident respondents have higher SIR, while under confident respondents cannot gain from the stock market. We also found that risk preference has a positive mediating effect in the relationship between competence and overconfidence and SIR, and a negative mediating effect in the relationship between under confidence and SIR. We thus concluded that confident investors can gain more stockholding returns via taking more risks regardless of the level of their actual financial knowledge. Our findings would be a meaningful complement to the studies of stock market participation.
Introduction
There has been less research on the topic of the relationship between financial literacy (FL) and stock market participation (Van Rooij et al., 2011; Xia et al., 2014; Balloch et al., 2015; Allgood and Walstad, 2016; Zhang et al., 2021; etc.). As a classical literature about FL and stock market participation, Van Rooij et al. (2011) proved that in a Dutch household survey, those who have low FL are less likely to invest in stocks. Some studies focused on the impact of the extensions of FL on stock market participation. For example, the overconfidence of FL is positively correlated with stock market participation (Xia et al., 2014), and both the actual FL and the perceived FL appear to influence the stock market participation behavior and that the perceived FL may be as important as the actual FL (Allgood and Walstad, 2016). The general theme of these studies that appears to emerge is that FL is tightly related to stock market participation behaviors.
Furthermore, some scholars paid attention to the relationship between FL and the diversification of the portfolio. These studies found that the diversification loss of highly educated investors is actually higher than that of others (Calvet et al., 2007), and investors who claim to understand investment products can construct more efficient portfolios (Graham et al., 2009). As for whether the investors with high FL have enhanced their welfare from the stock market, the findings of von Gaudecker (2015) study indicated that households in Dutch that score high FL or rely on professionals or private contacts for advice can achieve more reasonable investment outcomes. Also, Clark et al. (2017) proved that the most financially knowledgeable investors in the United States hold 18% points more stock than their least knowledgeable counterparts and can anticipate earning 8 basis points per month more in excess returns. These studies developed countries and their stock markets. To date, only Zhang et al. (2021) studied the impact of FL on the outcomes of household stock market participation in China, which is represented by the risks of stock assets, not the realized return of stock market participation. Therefore, this article fills the void by looking into the impact of FL on stock investment return (SIR) in developing countries and paying attention to the role of risk preference in the relationship between FL and SIR. Additionally, so far no literature has discussed the relationship between the extensions of FL1 and SIR from the perspective of comparative analysis.
We believed that the view that individuals can benefit from the stock market should not be taken for granted, and it is important to analyze how FL is translated into stock investment outcomes. Our findings can add to the literature on the study of the relationship between FL and stock market participation behaviors. In this article, the effects of FL on SIR are theoretically analyzed according to the portfolio theory (Markowitz, 1952) and the bounded rationality theory (Simon, 1947). The results of the theoretical analysis indicate that the expected return of the portfolio is determined by FL and risk preference. Especially, objective and subjective FL can affect the expected return of the portfolio by changing the risk-taking behavior. Additionally, although many studies have proved that FL has an important impact on investment behaviors and outcomes, so far no literature has focused on the FL concerned stock investment knowledge and its extensions to comparatively discuss the relationship between FL and SIR. Considering that stockholdings have the highest proportion in the allocation of financial assets for China, we developed some items of financial knowledge related to the Chinese stock market to measure FL, which allowed us to study the different impacts of some intensions of FL on SIR. Adding this information to existing studies can substantially enhance the research on stock investment decisions. Finally, we tried to provide a new explanation toward the so-called stock-holding puzzle, i.e., the fact that many households do not hold stocks (Haliassos and Bertaut, 1995; Campbell, 2006). Therefore, our findings would be a meaningful complement to the existing literature.
A Theoretical Analysis About the Effects of Financial Literacy on Stock Investment Return
We believed that FL and risk preference are the two sources of SIR. As we know, managing a portfolio requires specific FL, in terms of basic financial knowledge and advanced investment knowledge needed to choose stocks with high quality. Low FL is likely to be associated with an inefficient portfolio, which should mean low realized investment return. In Figure 1, MA represents an efficient portfolio frontier2 (Markowitz, 1952), on which each point means a portfolio with a maximized return under the condition of a certain risk. But the bounded rationality theory (Simon, 1947) holds that the decision-maker pursues limited rationality, not pursues rationality to the greatest extent. The reason is that people’s cognitive ability is limited, and thus, the decision-maker can neither grasp all the information nor recognize all the knowledge and laws related to decision-making. Nevertheless, it is still reasonable to assume that the higher the level of FL, the more rational the investor’s behavior will be, and the portfolio will be more efficient. As shown in Figure 1, the portfolio frontier of an investor with FL1 (MA) is more efficient than that of an investor with FL2 (NB) because of FL1 > FL2. Compared with the portfolio on NB, those on MA are more diversified, just as proved by Calvet et al. (2007) and Graham et al. (2009). Given that the risk appetites of two investors are the same (σ0), the investor with a relatively high FL can obtain a higher expected return, i.e., μ0 > μ1. This conclusion is consistent with the evidence provided by von Gaudecker (2015). Additionally, risk preference is another important source of SIR. In Figure 1, an investor with greater risk preference (σ0) should choose a portfolio with more risk than an investor with the same FL (FL2)3 but with smaller risk preference (σ1). Although the portfolio is not efficient on the portfolio frontier NB, i.e., the unsystematic risks of the portfolio chosen by them are not fully diversified, the expected return μ1 might be bigger than μ2. Therefore, investors can acquire a possibly high realized SIR by taking more risks.
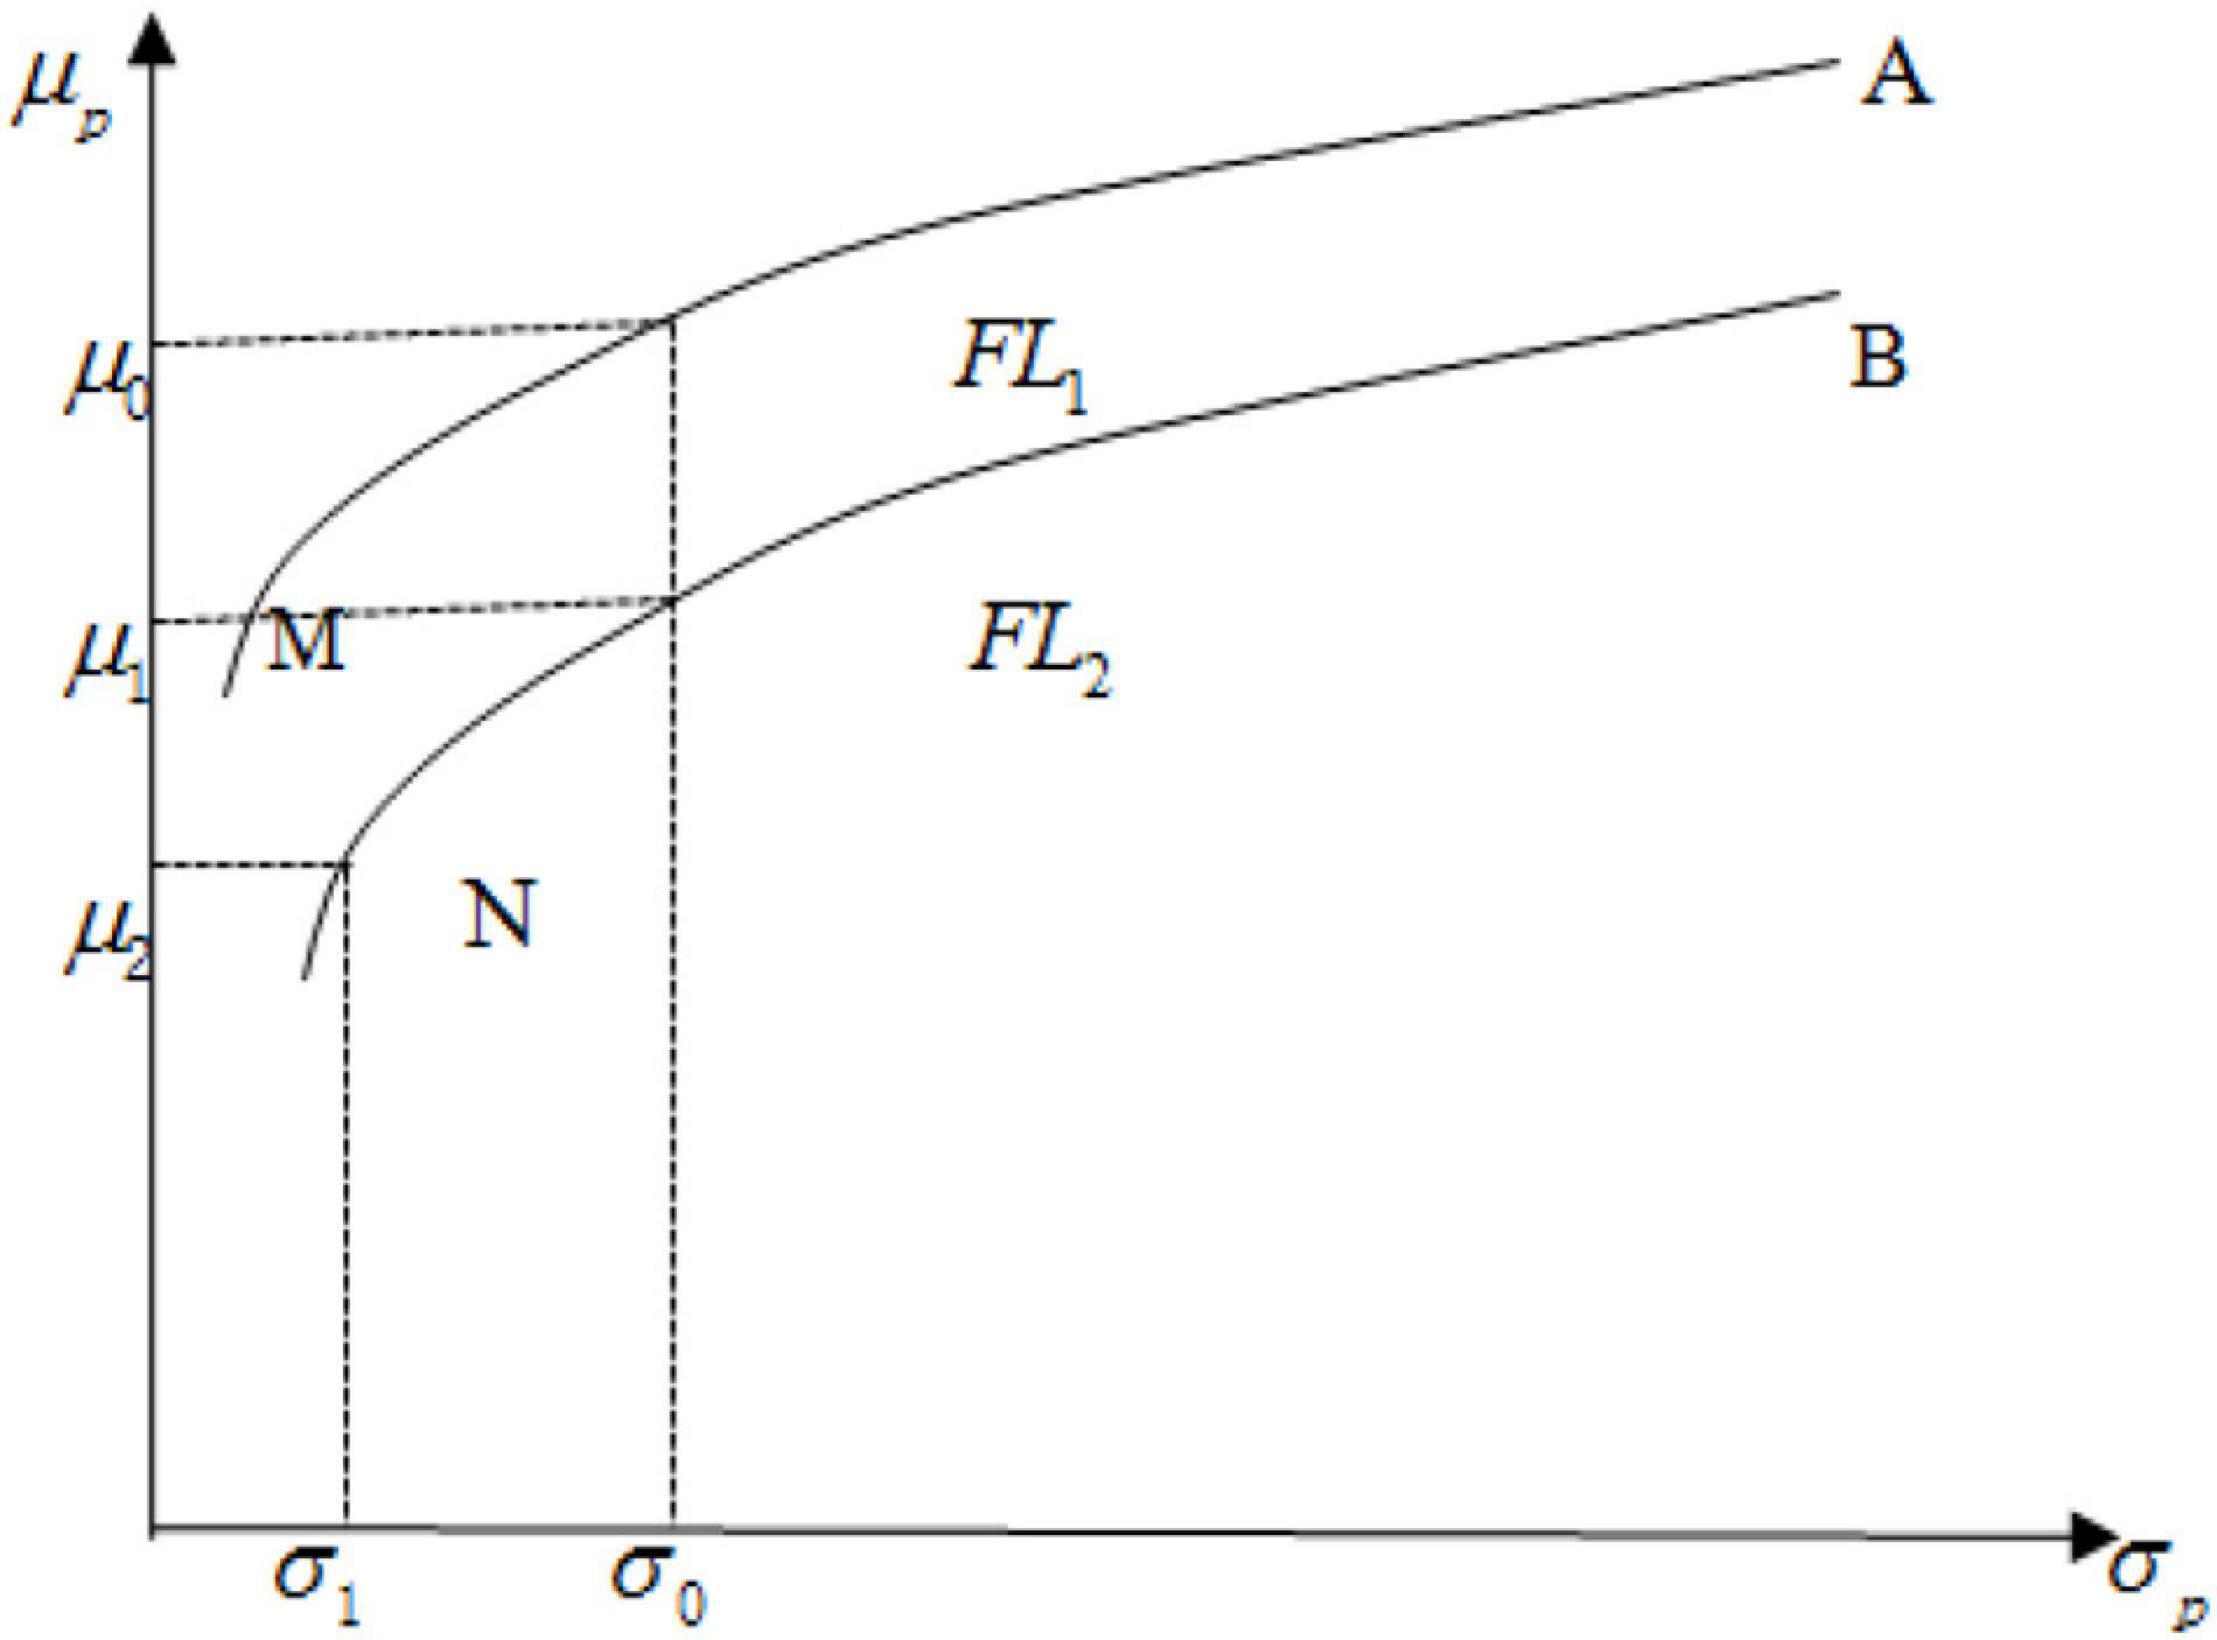
Figure 1. The determinants of portfolio return.
We believed that FL is a more important source of SIR than risk preference because it can affect the benefit of the portfolio by changing the risk-taking behavior. First of all, evidence from many empirical studies shows that risk aversion and objective FL have an inverse relation. Some experimental studies indicate that greater objective FL is associated with more patient and less risk-averse behavior (Benjamin et al., 2013; Taylor, 2016). Survey evidence also proves that FL has a positive relation with risk preference (Peng et al., 2020). Higher objective FL would then be associated with aggressive risk-taking behavior (i.e., choosing portfolios with high risk), which should make SIR higher likely. Moreover, self-assessed FL (i.e., subjective or perceived FL) might also be very useful for explaining the SIR. As we know, self-assessment of FL can be used to measure confidence. This confidence in investment knowledge is not granted to lead to poor financial decisions. Instead, Hung et al. (2009) proved that confidence in financial knowledge may improve financial decisions or outcomes because financial confidence may be needed to take an action. Similarly, individuals with high confidence level might believe that they are capable of controlling more risks, which should also induce risk-taking behaviors. Therefore, objective or self-assessed FL, which may play a more important role in stock investment, is a worthy question to be discussed.
Second, the connection of FL and stockholding return may be from the potential relation between overconfidence and risk preference. Overconfidence is usually associated with poor cognitive skills (Barber and Odean, 2001). Allgood and Walstad (2016) argued that a person with high perceived FL and low objective FL may be thought of as overconfident. Some studies on stock investment behavior and overconfidence found that overconfident individuals believe that they have better abilities to forecast future stock prices and control risks, which lead them to take riskier stock positions (Odean, 1998; Barber and Odean, 2001; Xia et al., 2014). Additionally, overconfident investors also underestimate the risk of stocks (Christelis et al., 2010), which makes them take more risks in the stock investment than under confident investors. Therefore, overconfidence may play a most important role in stock investment, and investors with overconfidence might therefore get higher realized investment return in the stock market by taking more risks.
Since objective and self-assessed FL might have different effects on the expected return of the portfolio, it is important to analyze comparatively their impact on the realized return in the stock market. In this article, we improved substantially upon the measurement of FL by considering more refined indices of FL and stock investment sophistication to analyze the impact of FL on stock investment incomes. In addition, to better understand the sources of SIR, we implemented an investigation that can provide information to assess the direction of causality between FL, its composite indices and SIR, and the mediating effect of risk preference.
Data and Method
Data
In this article, we included the investors in the Chinese stock market as the respondents in the survey to acquire the research data. According to the 2019 Chinese National Survey of Investors in Stock Market, there are almost 160 million investors in the stock market as of December 31, 2019, in which the proportion of individuals investing in stock directly is up to 99.76%. Thus, individuals have to assume more responsibility for their own financial wellbeing, and policymaker should attach more importance to the investor’s stockholding welfare in China. At present, there is also no public data source in China that can provide administrative data on stock portfolio information of households, similar to those used by Calvet et al. (2007), von Gaudecker (2015), and Clark et al. (2017). To rectify this lack of data, we devised a questionnaire to investigate the individual investors in the Chinese stock market. Especially, we focused on the level of investment knowledge related to stockholding to measure FL, which is more likely to affect SIR. To study the impact of FL including objective FL, subjective FL, and composite FL on stockholding return, we asked respondents with stockownership some questions about the level of objective and self-assessed financial knowledge, stockholding return, and socioeconomic characteristics. Given that risk-taking has an important association with portfolio return (Calvet et al., 2007; von Gaudecker, 2015), in this survey we also need to acquire risk attitude data to analyze the role of risk preference on the relationship between FL and stockholding return.
The questionnaire devised by us covered information about the demographic and economic characteristics of respondents and focused on FL related to stock investment, risk preference, and SIR data. The survey was divided into three stages, including pre-survey stage (from November 2019 to December 2019), field survey stage (from March 2020 to June 2020), and Internet survey stage (from March 2021 to May 2021). In the pre-survey stage, we inquired 30 experts in financial field and revised the questionnaire according to their suggestions. Then, a site investigation was made to obtain the comprehension bias and time required in the process of answering the questionnaire. In the field survey stage, feedback information of 320 respondents was used to improve the wording of each question of the questionnaire. Especially, we acquired the minimum time required to answer all the questions (10 min), which was regarded as a criterion for excluding the invalid questionnaires from the Internet survey sample. To avoid the possible impact of the COVID pandemic on the self-assessed FL and risk perception of investors, we chose a period with almost no COVID case for the third survey. The data collected with Internet surveys suffered less from reporting biases than those collected via telephonic interviews (Chang and Krosnick, 2009). Therefore, in the third stage, we conducted an online survey of 15,000 Chinese adults (500 per province, not including Tibet, Macau, Hong Kong, and Taiwan) who have investments in the stock market. The recruitment and random selection of participants were done by a security company cooperating with us, and then, the participants were interviewed via the Internet. All of the participants had Internet to invest stocks, and thus, the Internet connection rate of the participants was not considered. The regional distribution and random selection of the sample controlled the selection bias and provided it with a good representative of the population of those who actually participated in the Chinese stock market; 15,000 questionnaires were collected, and the questionnaire was judged as an invalid one if the time for answering all the questions was less than 10 min. Finally, a total of 13,911 out of 15,000 questionnaires served as a valid sample, implying a response rate of 92.74%.
The Measurement of Financial Literacy
We developed 15 items for the measurement of objective FL by introducing and improving some questions from De Nederlandsche Bank’s Household Survey (DHS), National Financial Capability Study (NFCS), and China Household Finance Survey (CHFS). Specifically, we devised some items related to stock investment to measure whether individuals possess the necessary skills to perform well in the process of stock investment. Additionally, some questions about basic financial knowledge in DHS, NFCS, or CHFS were improved according to the Chinese context (Supplementary Appendix A1, correct answers are provided in bold, the subject of the question is provided in the front of each item, and the sources are provided in the parentheses). For example, the interest rate question was divided into three questions in our survey, including the interest rate in China (Devised by us), simple and compound interest rate calculation (Improved according to the Chinese context and similar questions in DHS, NFCS, and CHFS). In the survey, respondents chose one of the two options: (1) they do not know the answer or (2) refuse to answer. This helped respondents not choose at random. In line with previous research (Peng et al., 2018), a “1” represents a correct response and a “0” represents an incorrect response; for a “don’t know” or a “refuse to answer” response, an objective FL score was chosen and its range was [0, 15]. Responses to these questions are reported in Table 14. The respondents are stock investors in our sample, which implies that they are familiar with investment knowledge about the stock market. Therefore, it is not surprising to find that most of them (93.07%) got an objective FL score above or equal to median value 8.
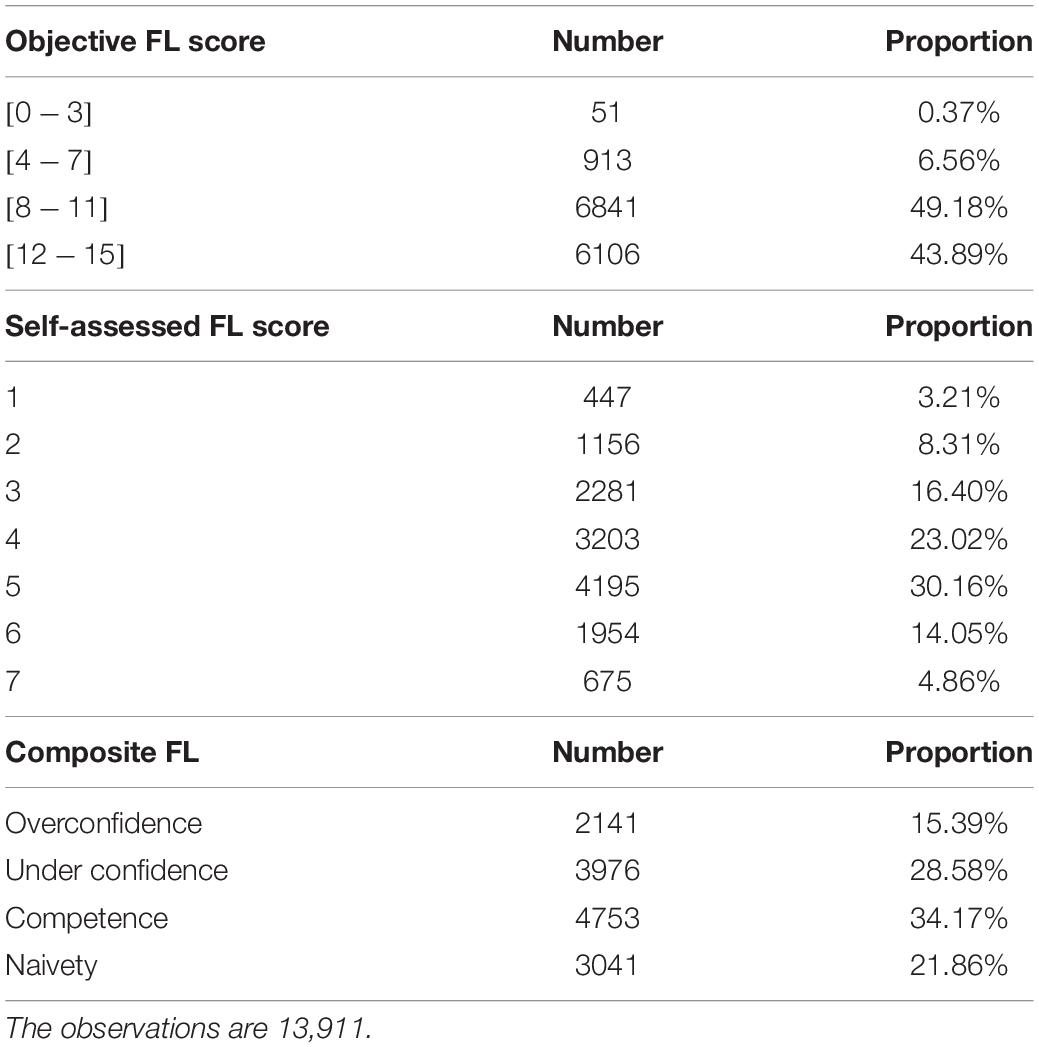
Table 1. The summary of the response of objective, self-assessed, and composite FL.
Additionally, we focused on self-assessed FL other than objective FL, which allowed us to discern whether the ability or the confidence has a greater effect on SIR. According to the survey of NFCS, respondents in our survey were asked to assess their own financial knowledge level on a 7-point Likert item scale, whereby a “1” reflects the lowest level and a “7” reflects the highest level (Supplementary Appendix A2). It is worth mentioning that the question is located at the beginning of the FL module, before any of the questions included in the objective FL indices are asked. Thus, respondents have to assess their own knowledge before they answer the objective FL questions, which can avoid the possible impact of the objective FL questions replies on their confidence. Responses to the self-assessed FL question are reported in Table 1. The pattern of answers is much different from the objective FL. For example, only 72.09% of respondents assessed their own FL above or equal to median value 4, which is far lower than the proportion (93.07%) of the respondents with above or equal median value of objective FL. This finding indicates that many investors are not confident with their investment ability regardless of the actual level of financial knowledge.
To better understand the interaction effect between objective FL and self-assessed FL on SIR, we constructed a composite FL. Similar to the previous studies (Allgood and Walstad, 2013), the split of the sample into “Objec-high” and “Objec-low” groups was done using the mean of the objective FL to determine the sorting (Objec-high > mean and Objec-low ≤ mean). The split of the sample into “Subjec-high” and “Subjec-low” groups was based on the self-assessed FL mean (Subjec-high > mean and Subjec-low ≤ mean). Similar to Porto and Xiao (2016) study, we sorted the sample into four groups of composite FL: Objec-high and Subjec-high (defined as competence), Objec-low and Subjec-low (defined as naivety), Objec-high and Subjec-low (defined as under confidence), and Objec-low and Subjec-high (defined as overconfidence). As shown in Table 1, only 34.17% of respondents are competent in FL, and about 22% of respondents have a relatively low level of objective and self-assessed investment knowledge. Most importantly, almost 29% of respondents are under confident, which means that they might not get ideal returns in the process of stock investment.
The Measure of Stock Investment Return
Most surveys, including DHS and NFCS, only use a yes-no test question to measure the willingness of the stock market participation of respondents. For the purpose of this research, we used a multiple-choice test question for the measurement of the realized outcome of stock market participation of the previous year, similar to CHFS 2017 (Supplementary Appendix B1). To ensure that the self-assessed outcome of realized gain/loss provided by the respondents can qualify as a precise outcome of stock investment, we asked the respondents to check the real return of the security account last year when they are investigated. Therefore, the measure of SIR of this survey is reliable to get an idea of investment ability. In addition, the greatest advantage of the SIR data allows the detailed measures to be related to the covariates the literature deems most important in the determinants of the willingness to participate in the stock market. As shown in Table 2, only 41.17% of respondents gained from the stock market, while almost 59% of respondents didn’t accumulate wealth through stockholding.
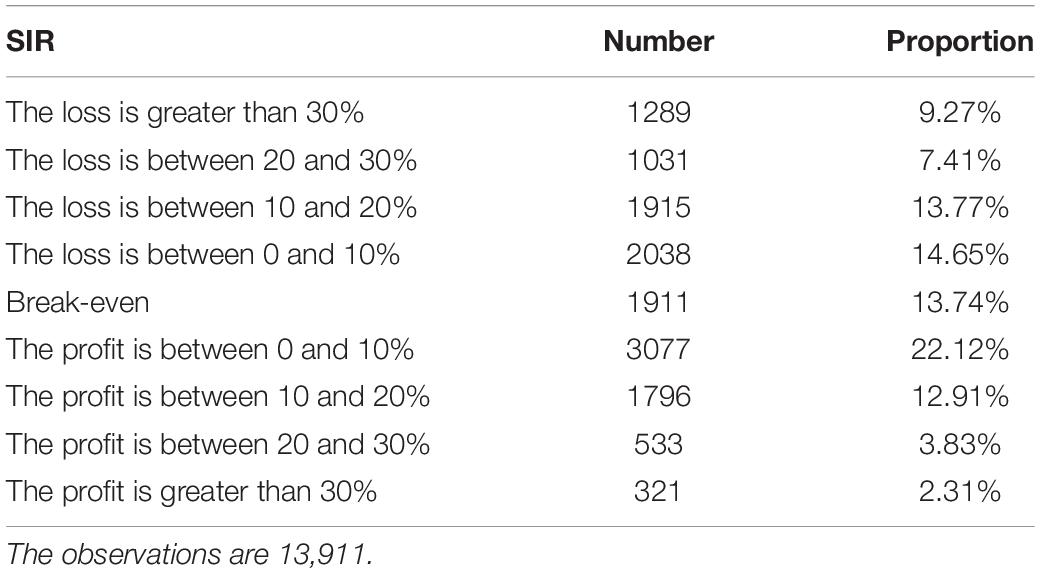
Table 2. The summary of SIR.
The Measure of Risk Preference
Like the device of the measure of risk preference in CHFS, we used a multiple-choice question with six items to ask the risk-taking willingness of respondents (refer to the first question of Supplementary Appendix B2). The statistics descriptive of the risk preference of the sample is provided in Table 3. We defined the choices of “A high-risk and high-return project” or “A slightly high-risk, slightly high-return project” as 1 or5 as 0, respectively. Therefore, 0 represents risk aversion, and 1 represents risk loving. In our sample, most of the respondents (70.64%) were risk averse, which was consistent with the characteristics of the population.
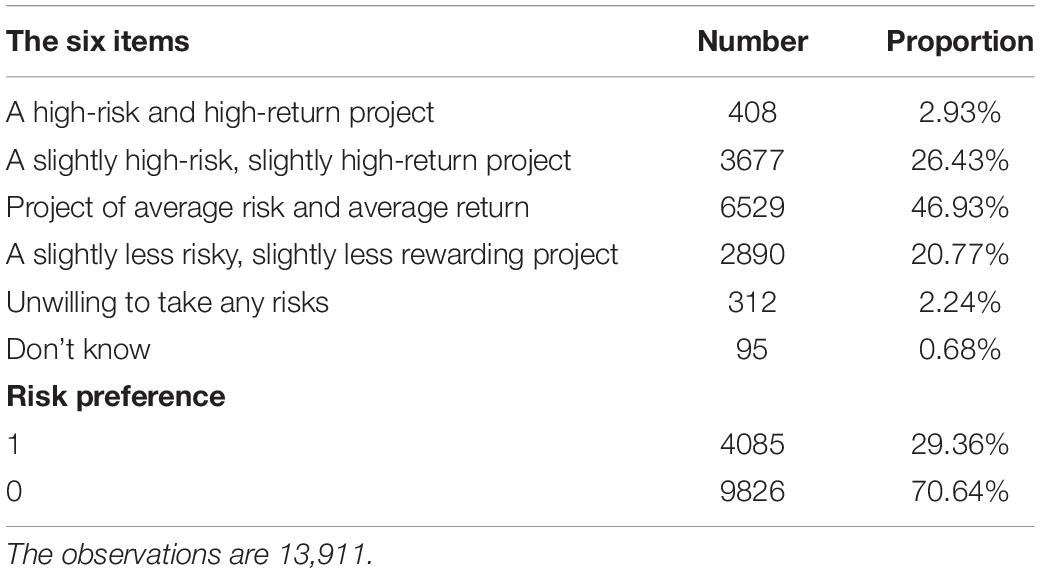
Table 3. The summary of risk preference.
Empirical Methods
Similar to von Gaudecker (2015) study, we argued the stock investment process in terms of a simple production. The output is a measure of investment outcome, i.e., the return of stockholding considered in Section “The measure of risk preference.” The most important independent variable in our study is FL, which is categorized into objective and self-assessed FL, and their composite indices. The other demographic independent variables identified in the literature include education, income, age, and education. A detailed definition of all variables is described in Table 4. We approximated the production function by an equation:
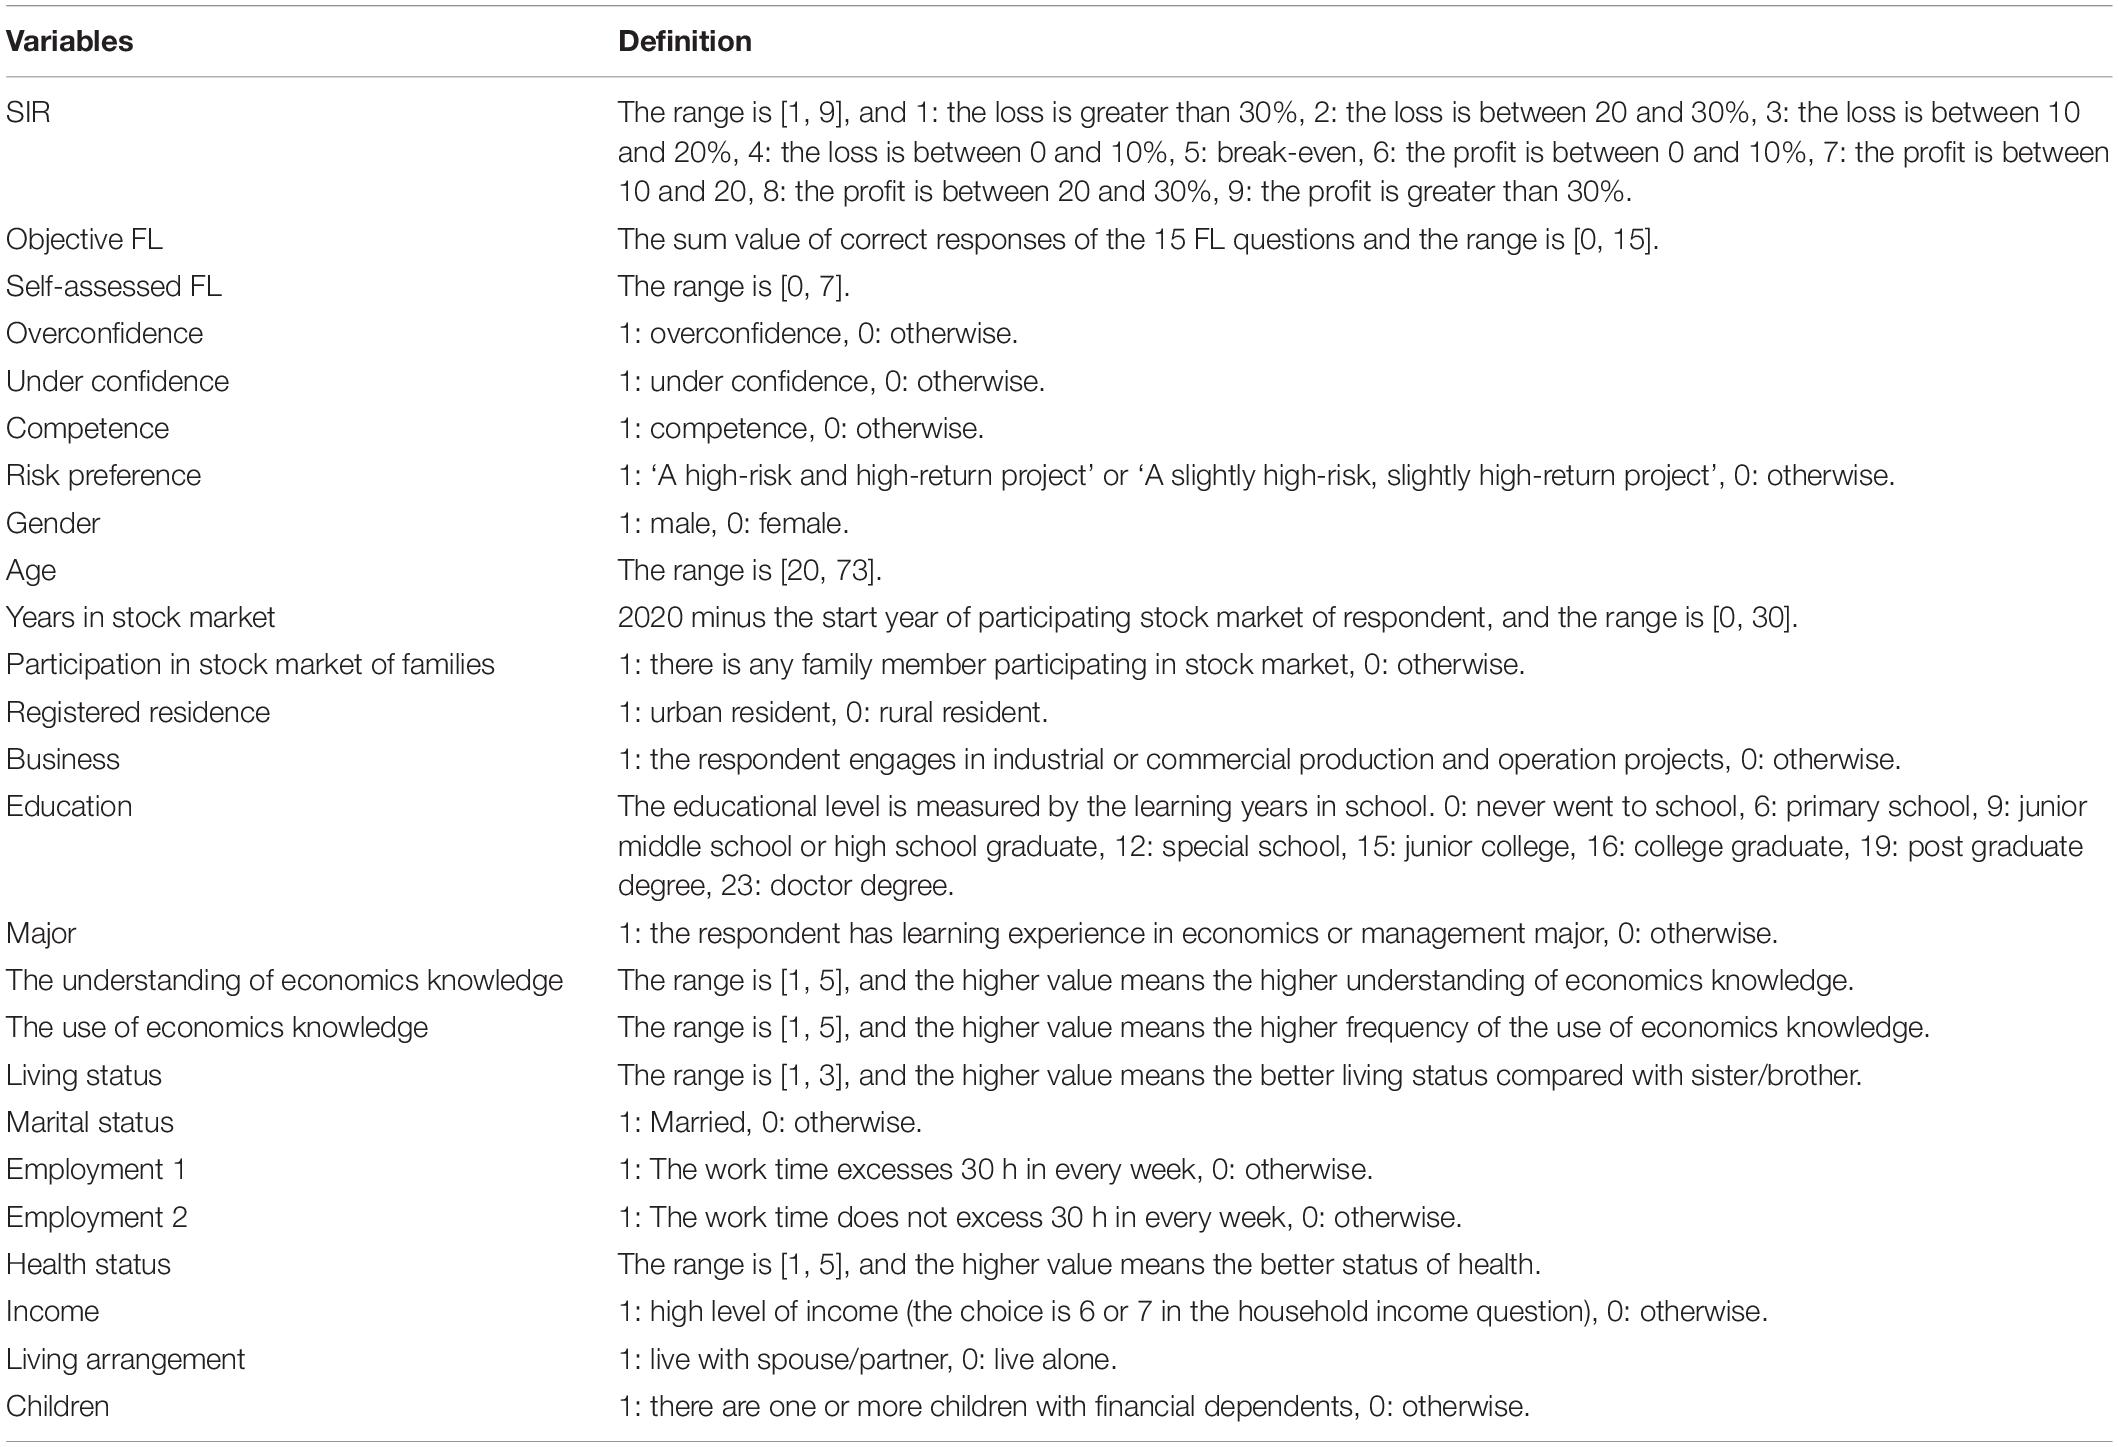
Table 4. The definition of variables.
Given that SIR is an ordered variable, and the disturbance parameter ε1 satisfies the normal distribution, we used the Ordered Probit model and standard maximum likelihood estimation method to estimate the regression (1).
For the test of the role of risk preference on the relationship between FL and stockholding return, we added the two regressions as follows.
The direct effect of FL on SIR is β1, the total effect of FL on SIR is β2, and the indirect effect of risk preference between FL and SIR is θ1 times β3. According to Baron and Kenny (1986) study, if β2, θ1, and β3 are statistically significant, then there is the mediating effect of risk preference between FL and SIR. Given that risk preference is a binary variable, we used the Probit model and standard maximum likelihood estimation method to estimate the regression (3).
Results
The Descriptive Statistics and Correlation Analysis of Variables
As shown in Table 5, the mean of the objective FL of our sample is 10.381, which implies that the level of investment knowledge of investors in the stock market is high. But, the mean of self-assessed FL of investors is not high (4.316, a little higher than the median). Especially, the average SIR of investors is lower than the median, which means low SIR of Chinese investors.
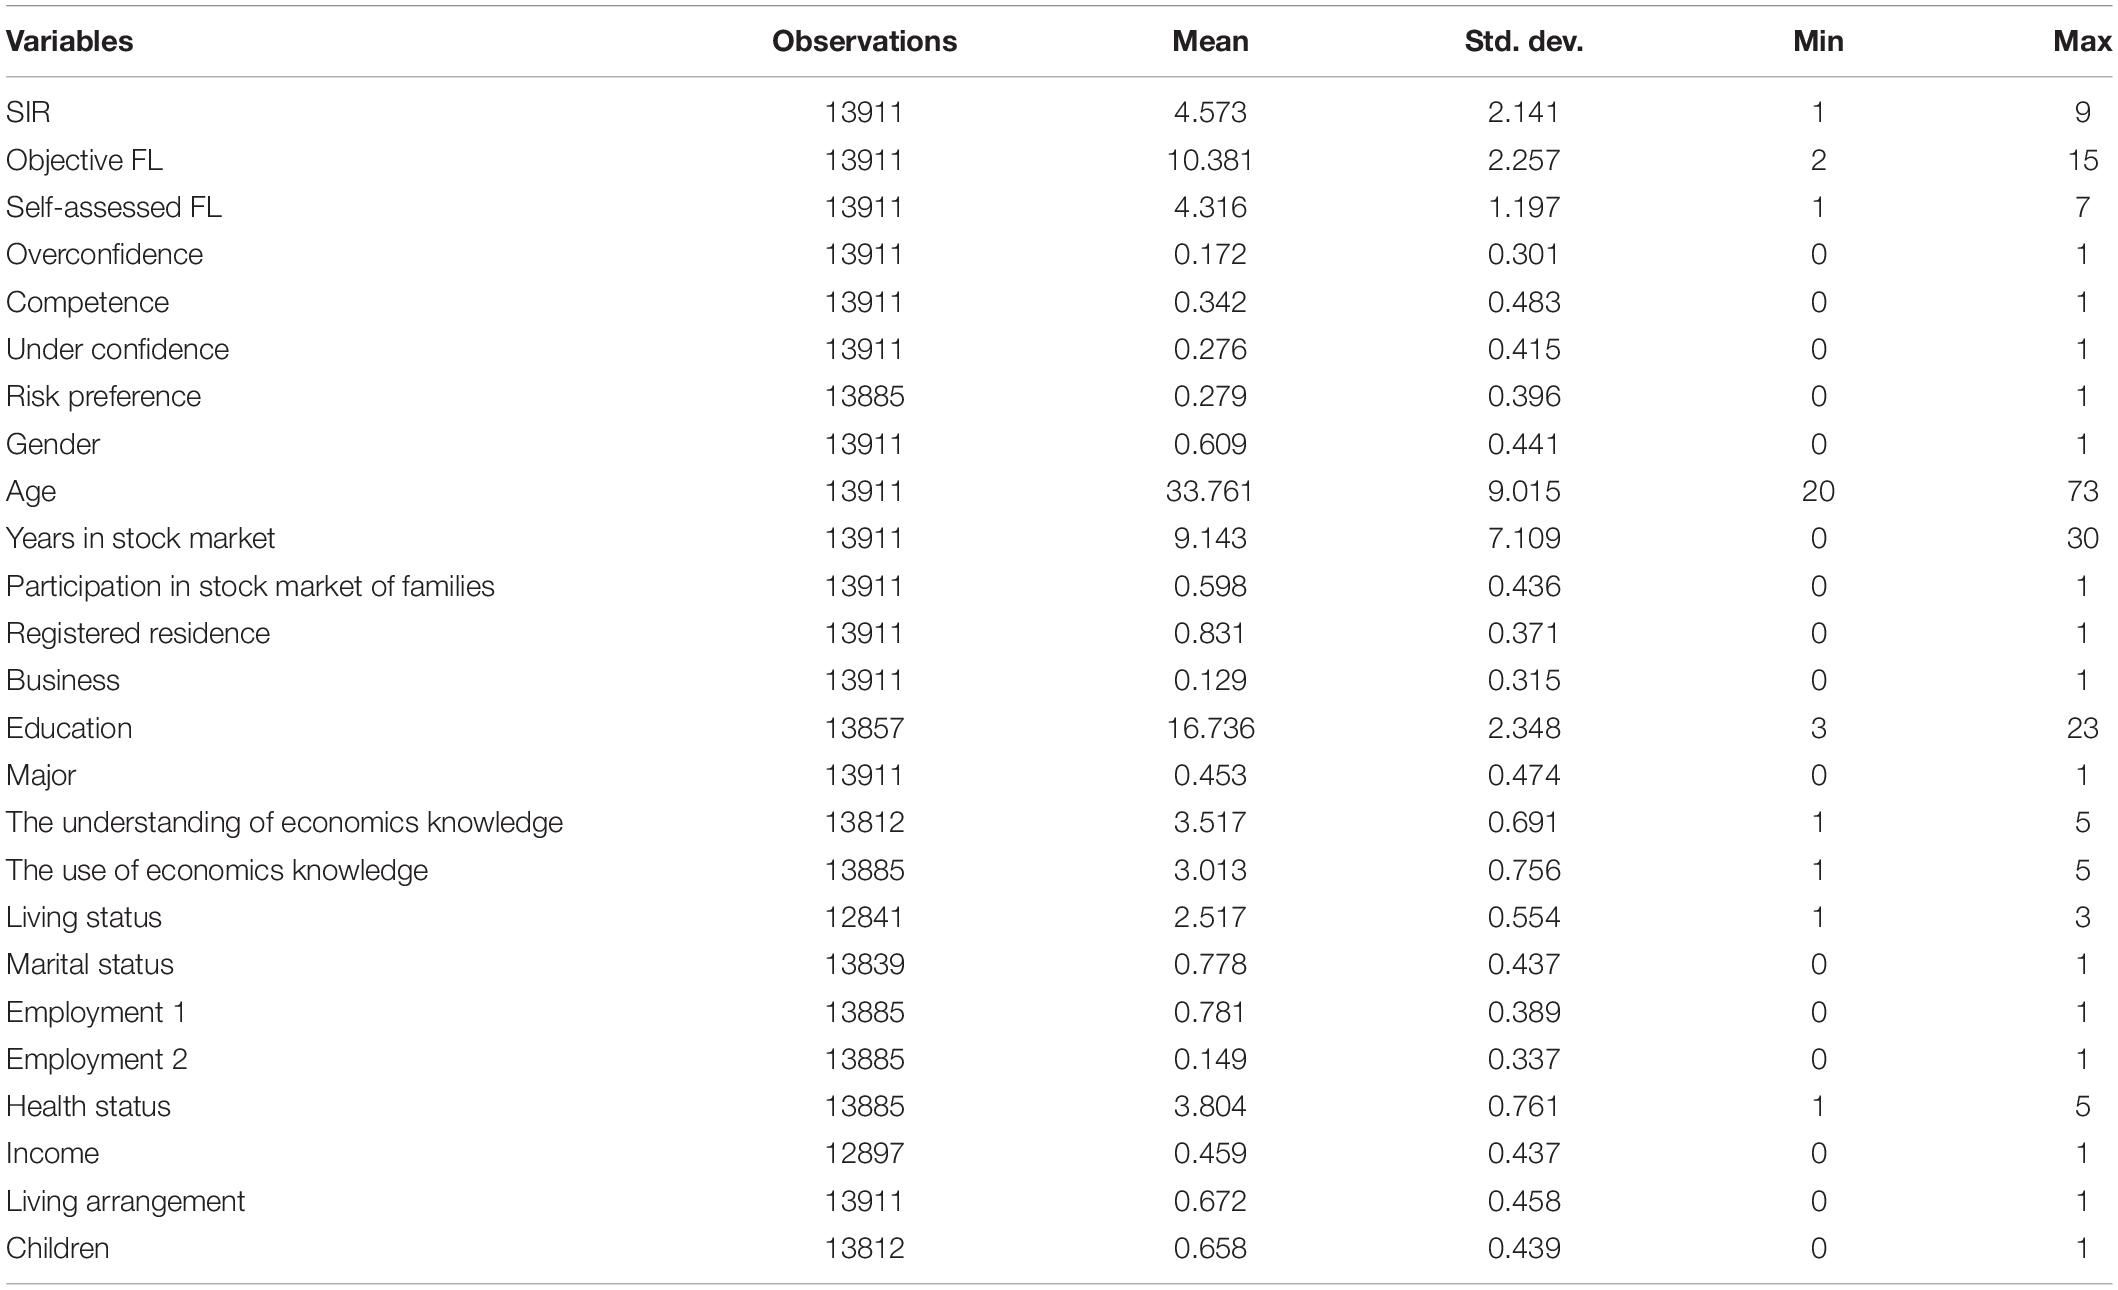
Table 5. The descriptive statistics of variables.
For simplicity, the results of the Pearson’s correlation analysis of some core variables are reported in Table 6. The relationship between objective and self-assessed FL and SIR is significantly positively correlated, but the coefficient of objective FL is less than the self-assessed FL. Also, the significantly negative coefficient between under confidence and SIR implies that under confident investors cannot gain from the stock market. In addition, the correlation coefficient of objective FL and risk preference is insignificant, while the coefficient of self-assessed FL and risk preference is significantly positive. This finding indicates that the investors with high self-assessed FL are more risk loving. Similarly, the overconfident and competent investors show higher risk preference than under confident investors. These results imply that risk preference might play an important role in the relationship between FL and SIR.
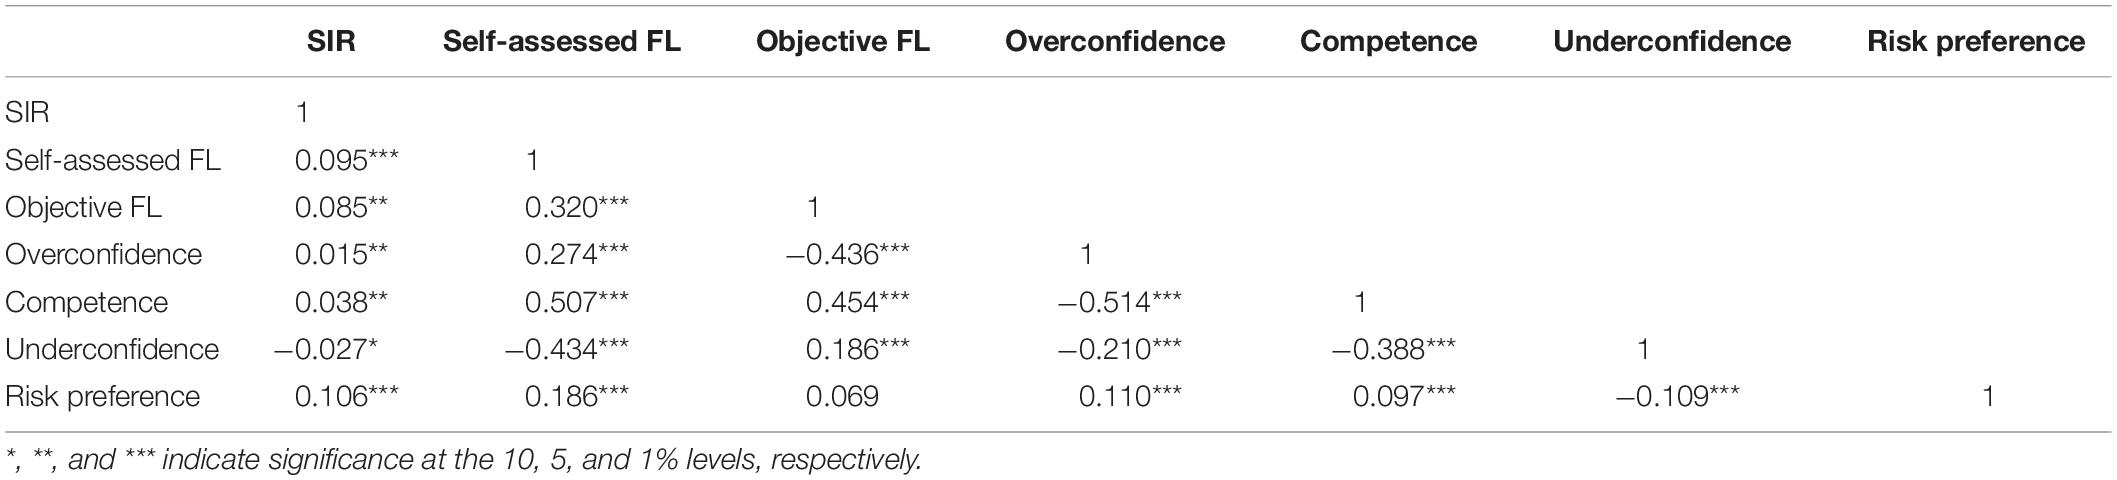
Table 6. The correlation analysis of some core variables.
Objective and Self-Assessed Financial Literacy and Stock Investment Return
As indicated by the findings from Gallery et al. (2011), only 41% of those respondents with a good or very good self-assessed FL had scores on the specific investment questions in the highest two quintiles. Van Rooij et al. (2011) and Lusardi and Mitchell (2017) found that there is a positive relationship between subjective and objective FL, but the cross-tabulations of scores show considerable percentages of respondents in each possible combination. The relationship between the subjective and objective measures of FL in our study is also positive, but the correlation coefficient is small6. Therefore, self-assessed FL is not simply another measure of actual FL. The results in Table 7 show that objective FL and self-assessed FL have positive relationships with SIR, but the impact of objective FL on SIR is significantly lower than the self-assessed FL7. We thus concluded that the SIR resulting from objective FL is much less than that from self-assessed FL. This finding means that confidence has a great impact on the investment return in the stock market.
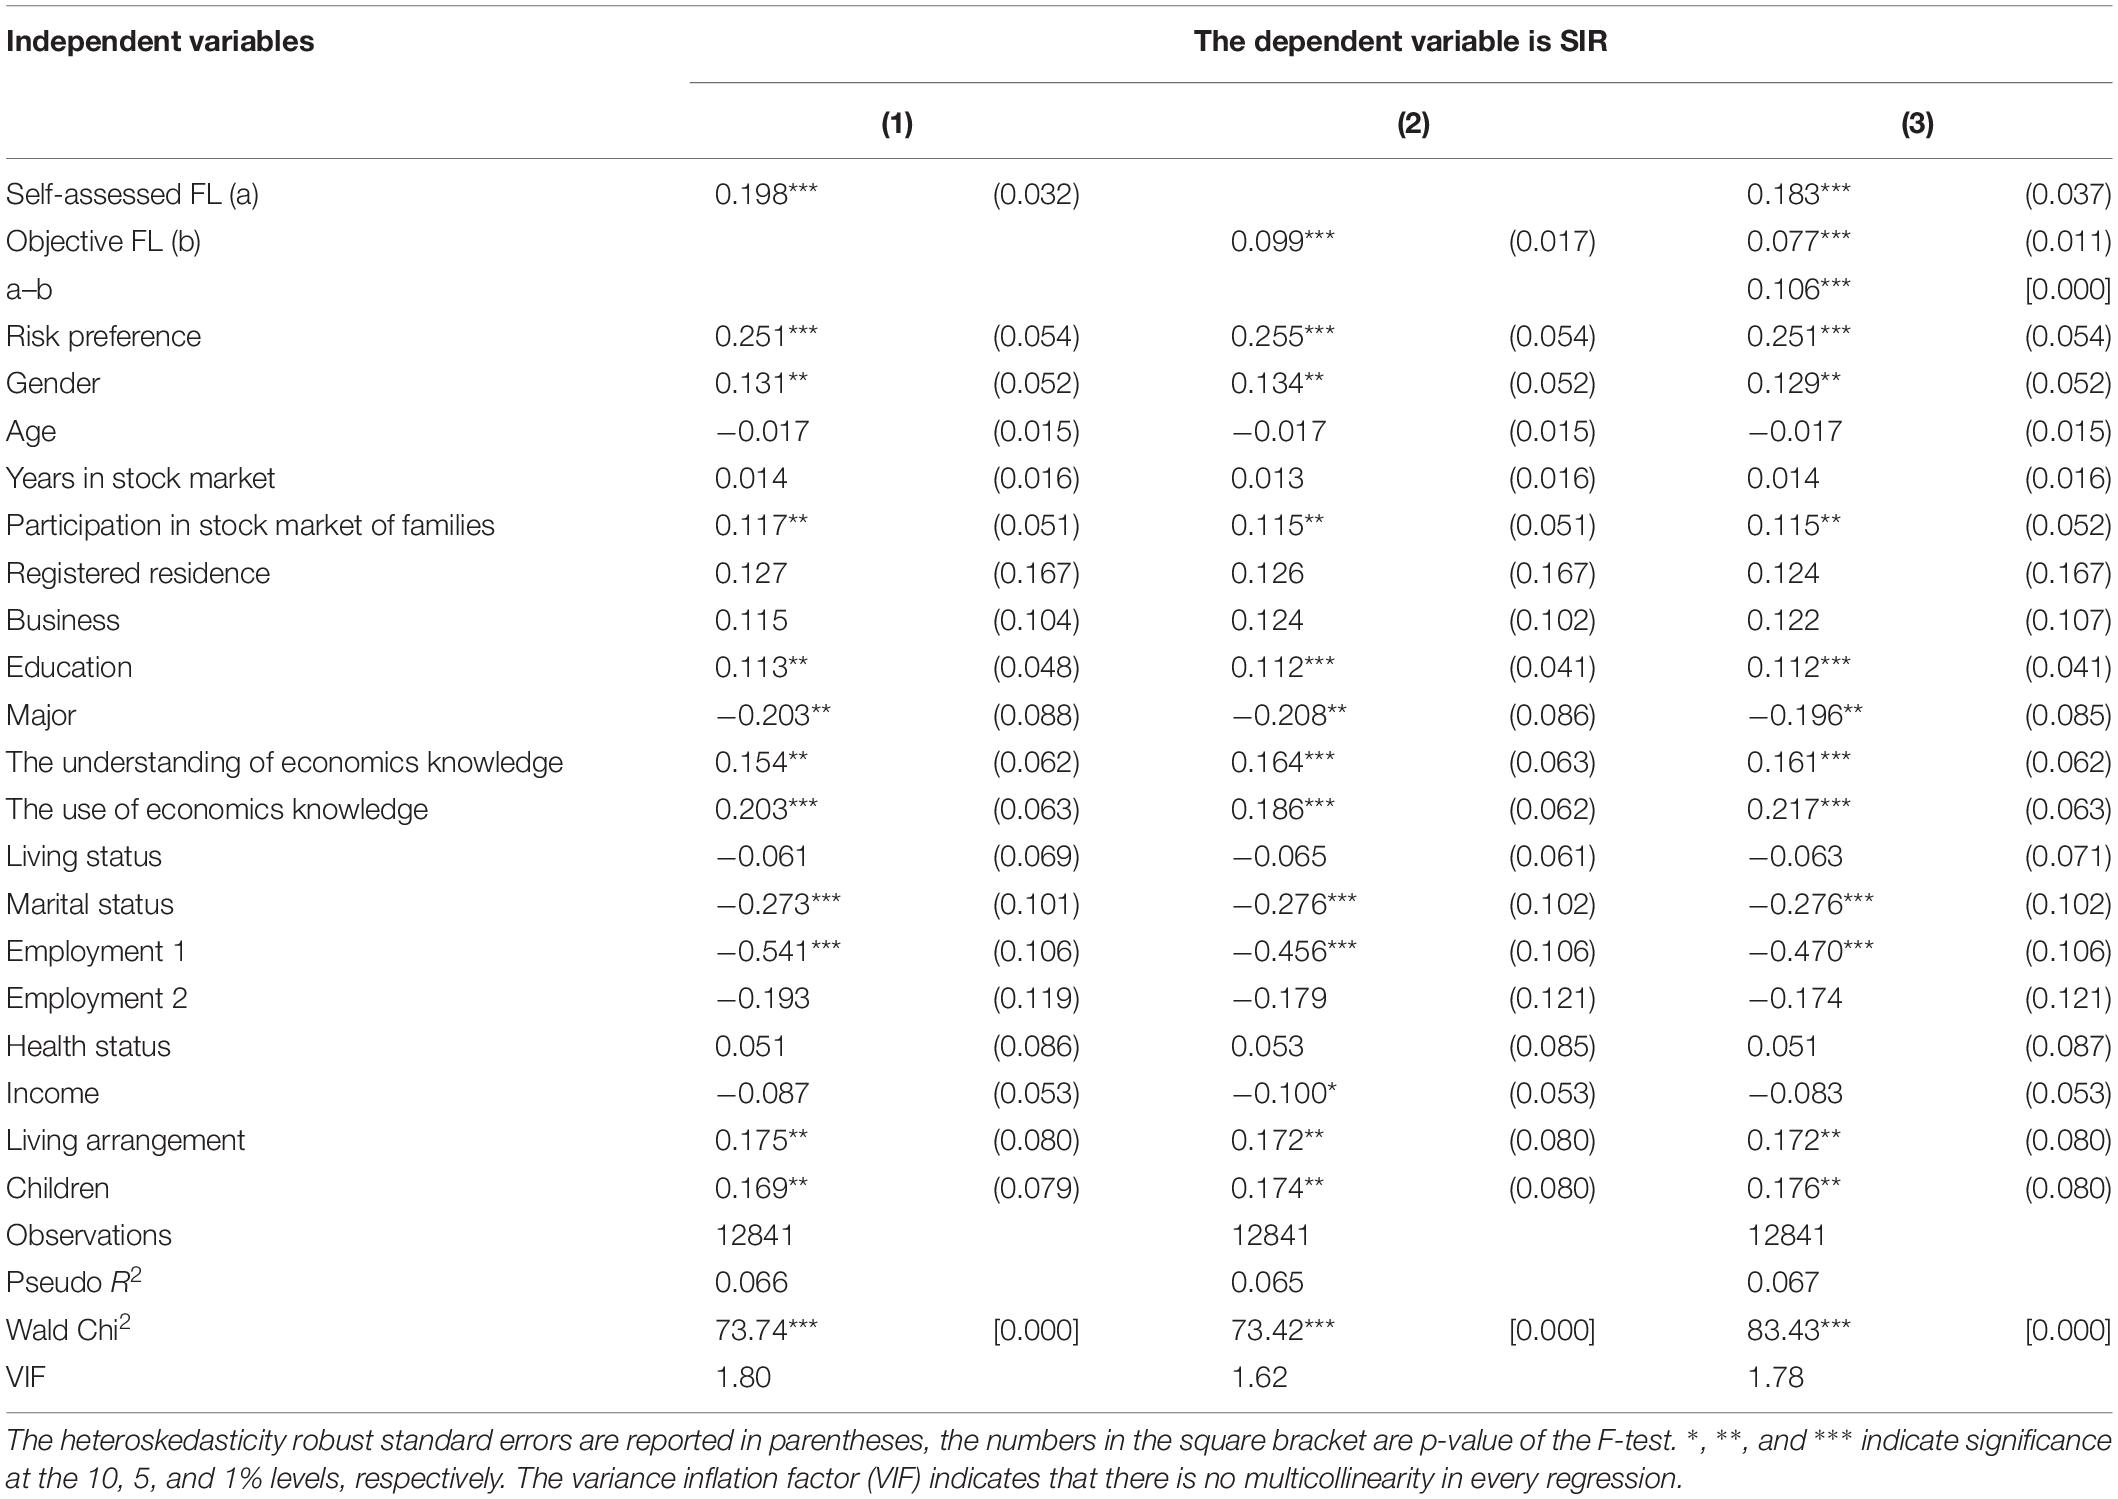
Table 7. The Ordered Probit regression results of the relationship between self-assessed and objective FL and SIR.
The Mediating Effect of Risk Preference Between Objective and Self-Assessed Financial Literacy and Stock Investment Return
Note that risk attitude is always an important predictor of SIR; those who display higher risk loving are more likely to obtain higher return in stock investment. As discussed in the “Introduction” section, both objective FL and self-assessed FL can bring stock returns by making portfolios with more risks, and thus, risk preference might be a mediator between objective and self-assessed FL and SIR. But the Panel A in Table 8 shows that there is no relationship between objective FL and risk preference, which means that individuals with high objective FL do not gain from the stock market by taking more risks. Given the positive relationship between objective FL and SIR, this finding implies that individuals with high objective FL can only accumulate wealth from stock investment by constructing an effective portfolio than by making a portfolio with more risks. Nevertheless, individuals with high self-assessed FL can get excess returns by taking more risks. The proportion of mediating effect in Panel B of Table 8 shows that 25.28% of returns are from risk taking in the relationship between investors’ confidence and SIR.
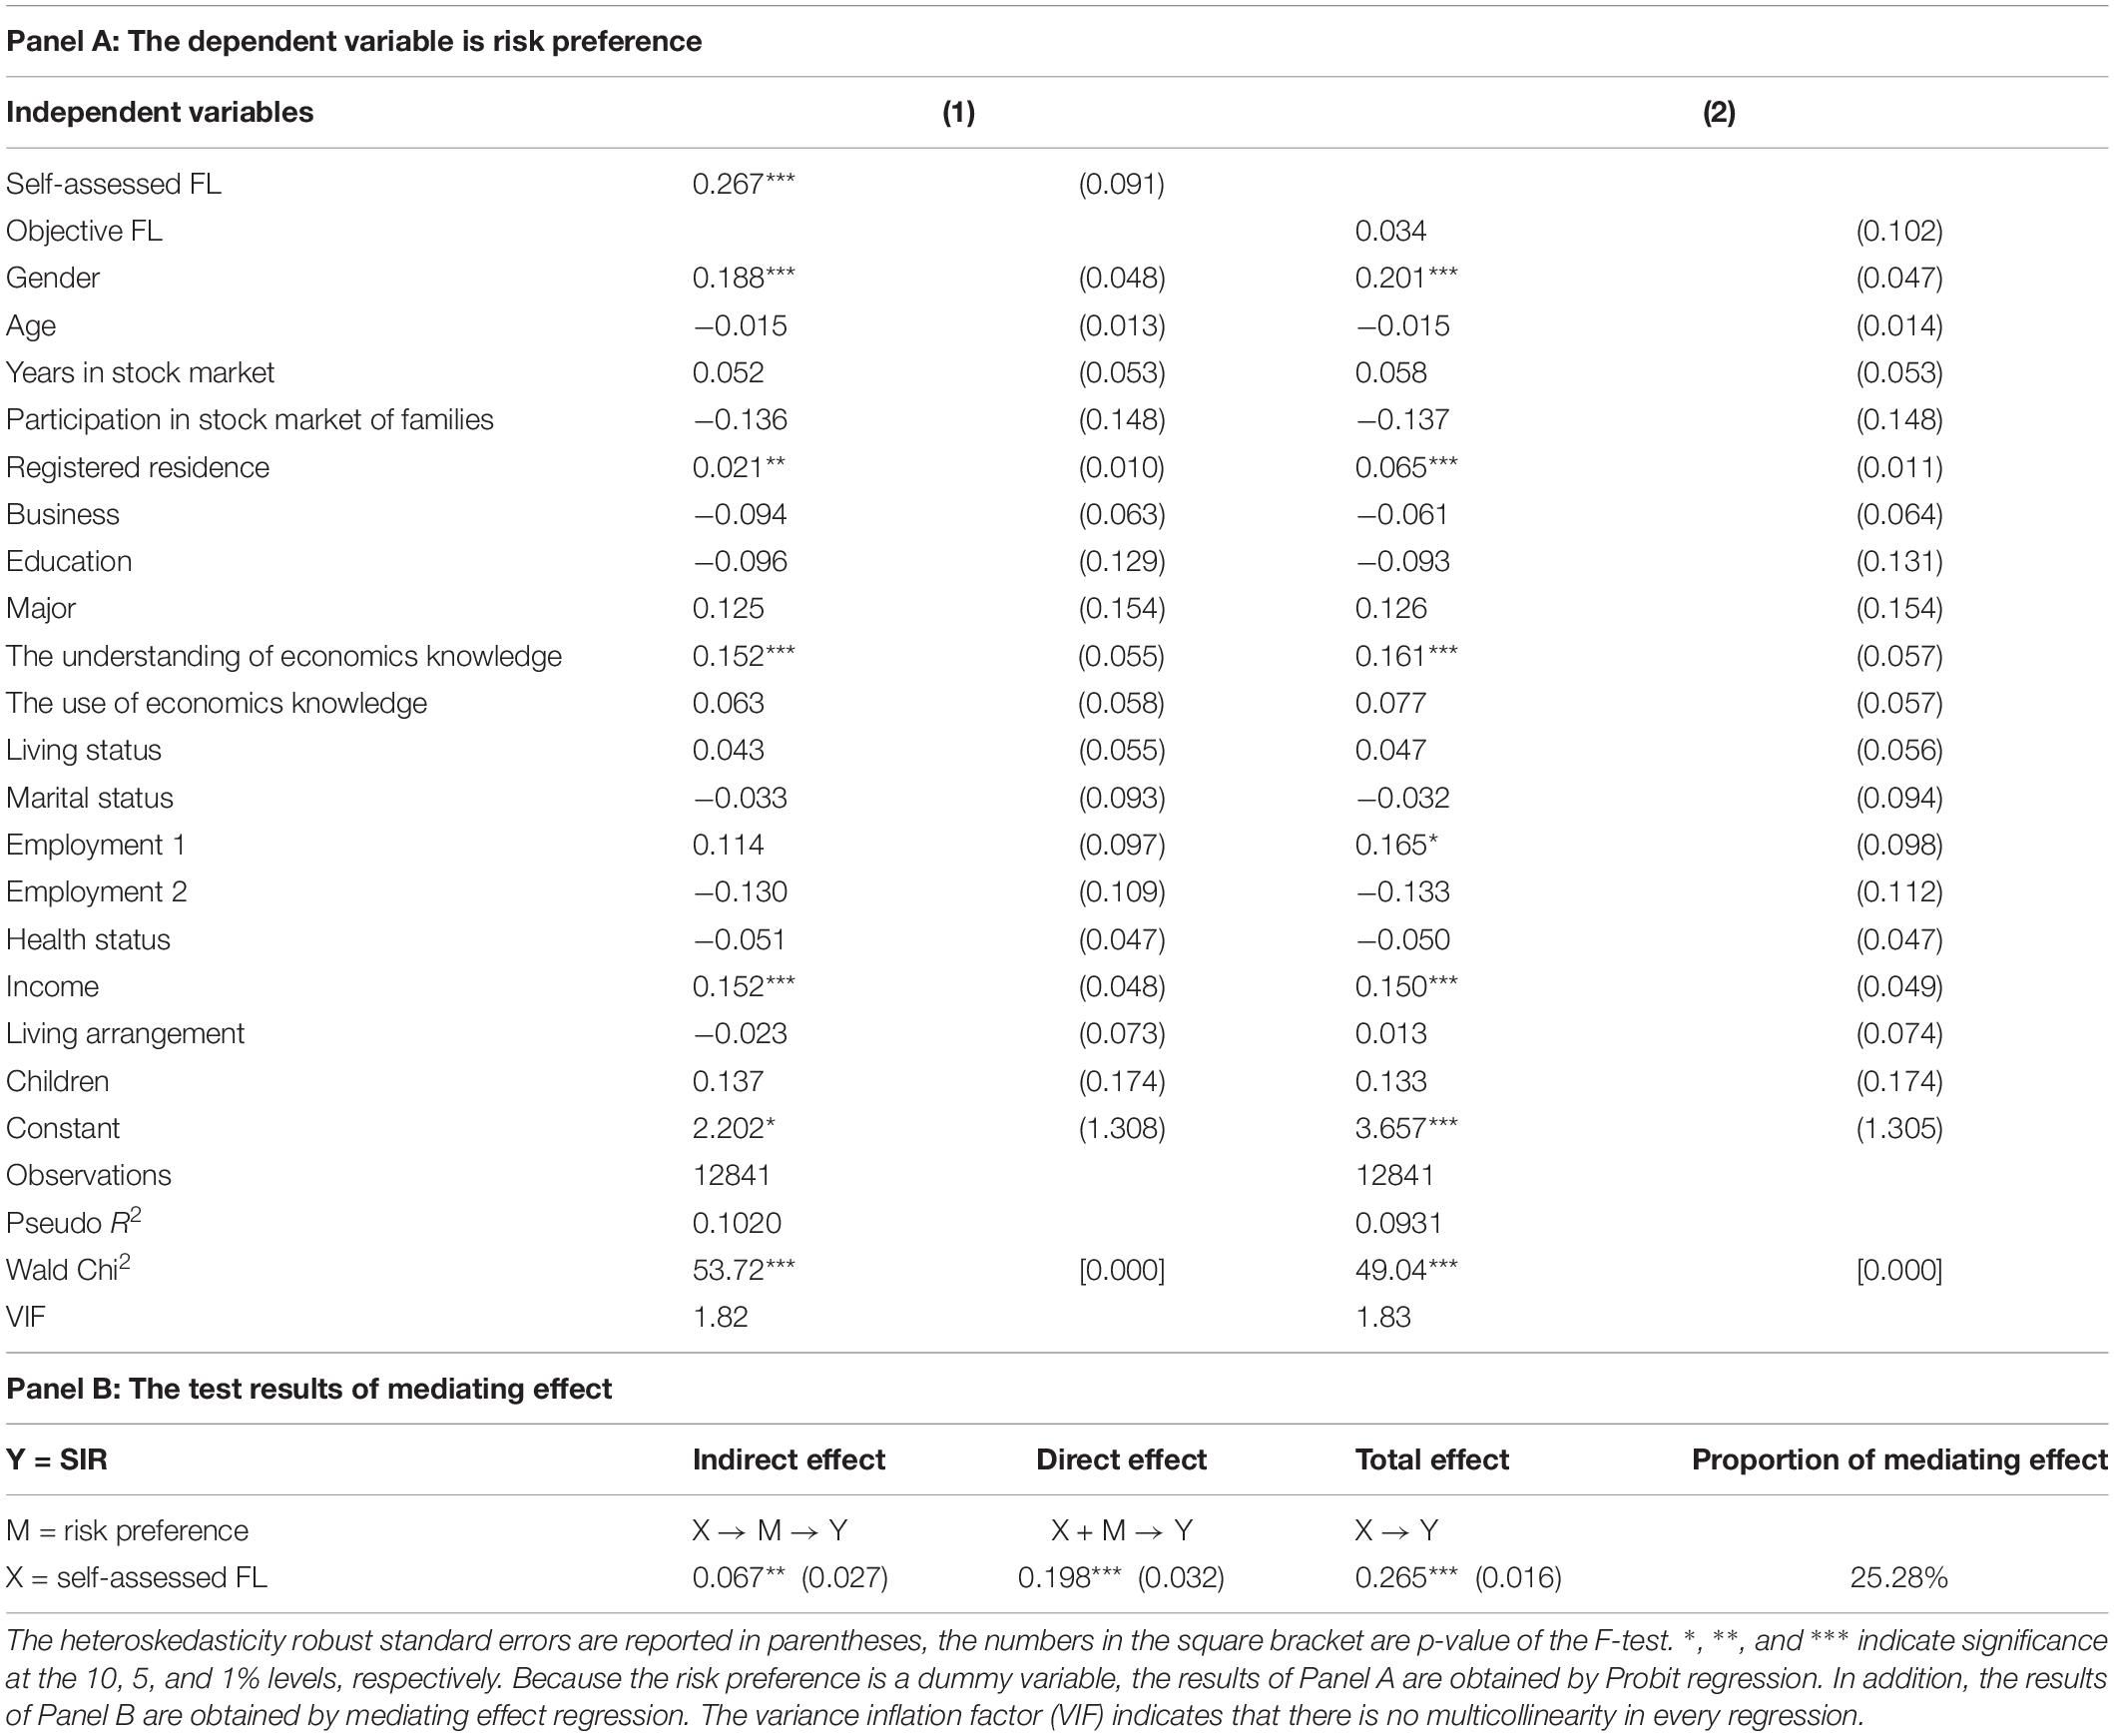
Table 8. The mediating effect of risk preference in the relationship between FL and SIR.
Calvet et al. (2007) found that the diversification loss of highly educated investors is actually higher than that of others because they are more exposed to risk but reach higher returns. They use education as the proxy of FL, which is regarded as the main reason for why our findings are not consistent with theirs. But von Gaudecker (2015) provided the results that many Dutch households reach reasonably effective investment outcomes in terms of the risk-return trade-off by choosing a very low level of risk, and others by turning to external help. He argued that both strategies are consistent with a rational response to poor self-perceived investment skills. Our results are similar to such explanation, i.e., respondents with low self-assessed FL always choose a portfolio with low risk.
Composite Financial Literacy and Stock Investment Return
As shown in Table 9, overconfidence and competence have a significantly positive impact on SIR, while underconfidence has no influence on it. In addition, although the impact of overconfidence on SIR is greater than competence, the difference is not significant. The comparison of the coefficients of the three composite FL measures is important because it proves that the better outcomes are concentrated among those who have a high level of self-assessed FL regardless of their actual ability as applied to stock investment matters8.

Table 9. The Ordered Probit regression results of the relationship between composite FL and SIR.
Similarly, we discussed the mediating effect of risk preference between composite FL and SIR. Panel A of Table 10 indicates that overconfidence and competence have a positive relationship with risk preference, while underconfidence has a negative relationship with it. The test results of mediating effect in Panel B of Table 10 further show that there is a negative mediating effect of risk preference in the relationship between underconfidence and SIR. In addition, the mediating effect of risk preference in the relationship between competence and SIR (42.34%) is smaller than the effect in the relationship between overconfidence and SIR (43.05%). Given that investors with high self-assessed FL are more risk loving, it is not surprising that risk preference has a greater mediating effect for overconfidence than for competence.
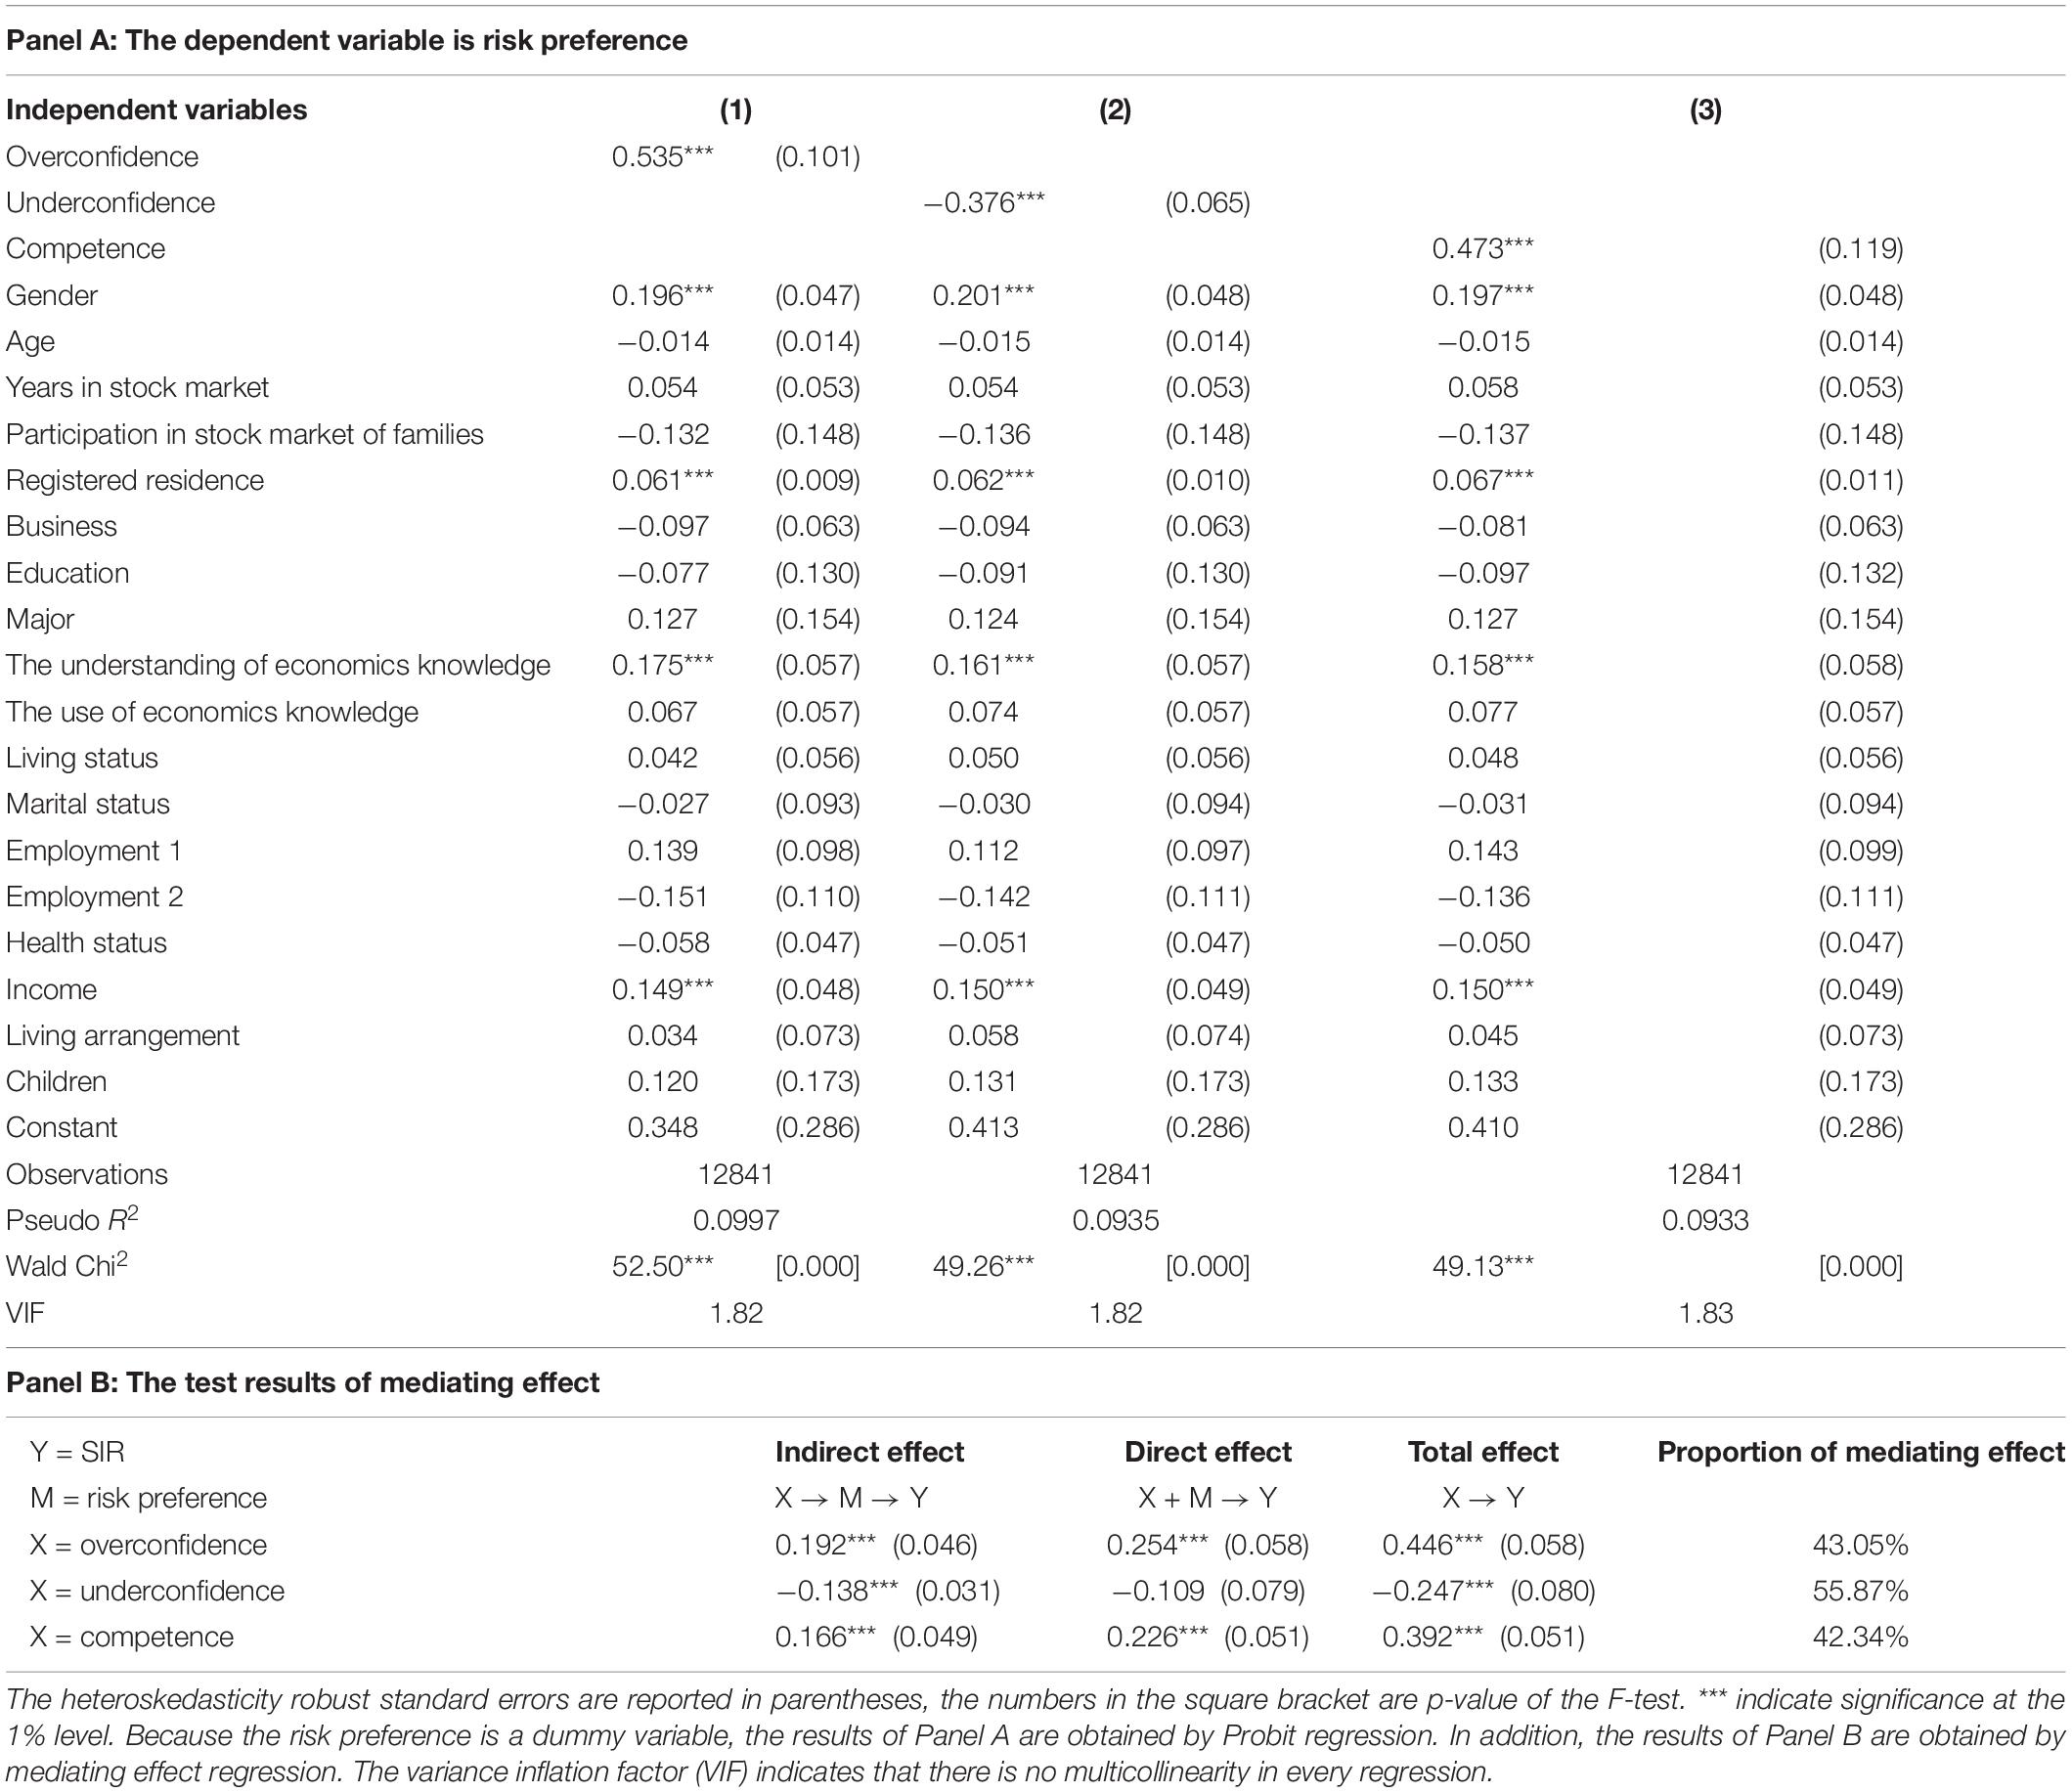
Table 10. The mediating effect of risk preference in the relationship between composite FL and SIR.
Robustness Checks
Endogeneity Analysis
As discussed by Van Rooij et al. (2011), literacy is not an exogenous characteristic because literacy can itself be affected by financial behavior. As for our data, individuals with high SIR might mean they have rich experience in stock investment, and they can learn via experience to increase the level of investment knowledge. To solve this problem, we collected additional information that served as an instrument variable for FL.
To be able to rely on the measures of FL that are exogenous with respect to SIR, we asked respondents about the learning experience in finance or economics of their parents. Specifically, we collected information on whether the parents have ever studied in the major of finance or economics. We used this information as an instrument variable for the objective FL of the respondent. The experience of his or her parents is not under the control of the respondent and is thus exogenous with respect to the respondent’s action, but the respondent can learn from his or her parents, thus increasing his or her own FL. In order to ensure robust results, we used both 2sls and GMM to perform the endogeneity test. For simplicity, we reported only the estimates of the new controls and the regressions.
The first-stage regressions of the two methods reported in Table 11 show that not only our instrument is statistically significant but the F-statistics are high and above or in range with the value recommended to avoid the problem of weak instruments (Bound et al., 1995; Staiger and Stock, 1997). The estimates in the second stage show that the relationship between objective FL and SIR remains positive and statistically significant in the two regressions. Moreover, the exogeneity test is not rejected. The results of the Hansen J-test show that the over-identifying restrictions are also not rejected. Therefore, the objective FL is not an endogenous variable in the empirical analysis, and all the regression results above are credible.
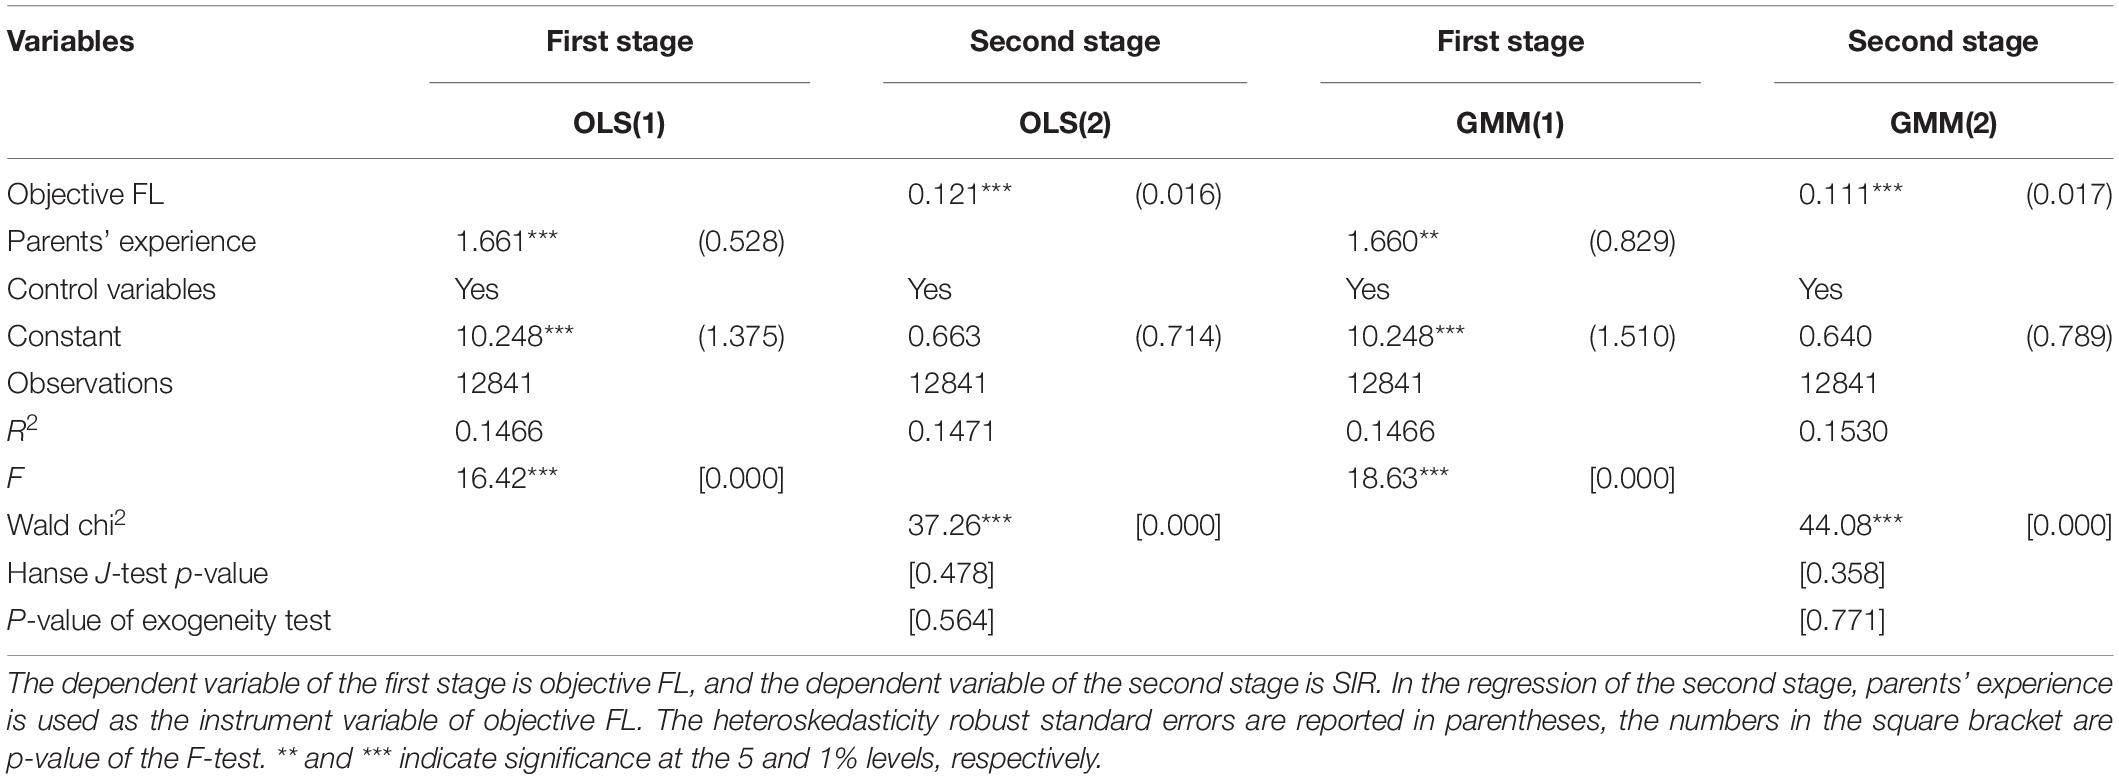
Table 11. The comparison of 2sls and GMM estimation.
The Different Measures of Core Variables
Stock investment return, composite FL, and risk preference are core variables in this study, and they can be measured by other methods. For SIR, we used a dummy variable other than an ordered variable to measure it. Specifically, the choices for the items with positive return (including break-even) in the SIR question are defined as 1 and others are defined as 0. Then, we used the Probit model to estimate the regressions with SIR as the dependent variable.
The method used to measure composite FL in this article was developed by Allgood and Walstad (2013). Allgood and Walstad (2013) used a sample with 28,146 adults to calculate the average of FL, and then, they used it as the benchmark to split the sample into high or low group. But our sample has only 13,911 observations, so the average FL of the sample with relatively small scale may not have the representative. We thus used the median value 8 as the benchmark to define the low or high level for objective FL and the median value 4 for self-assessed FL, and then, the four new groups of composite FL were obtained.
For risk preference, we used another question to investigate the risk attitude of respondents because the question of risk preference described in Section “The Measurement of Financial Literacy” is crude. The new question is described as the second question in Supplementary Appendix B2. We coded the first choice as 4, the second as 3, the third as 2, the fourth as 1, and the fifth as 0, and then, we obtained an ordered data of risk preference. Obviously, the respondent with a bigger value is more risk loving.
Using the new measures of SIR, composite FL, and risk preference, we conducted all the regressions again. Also, we found that the same pattern holds for the different measures, which proved that our results are valid and robust9.
Conclusion and Discussion
In this study, the theoretical analysis shows that FL and risk preference are the two sources of SIR, but FL can affect SIR by influencing risk tolerance. This finding implies that FL might play a more important role on SIR than risk preference. Then, the detailed stock investor’s information is obtained through a survey, which allows us to examine the relation between FL and SIR of stock investors in China. With our data set, FL can be categorized into objective and self-assessed FL and four groups of composite FL. Especially, we discerned that the high SIR is due to that investors are better equipped to make their own investment decisions or they are more confident to purchase risky stocks. If the former case is proved, financial education programs could be of help (Tang et al., 2010). But if the investor’s confidence is the key, the policies would target the enhancement of the investment confidence.
The findings show that objective FL has a positive impact but with a low significant level (10%) on stockholding return, which is consistent with the results of von Gaudecker (2015) and Clark et al. (2017). Most importantly, we found that the self-assessed FL has a more strong impact with high significant level (1%) on SIR and risk preference has a significant mediating effect in the relationship between them. The results show that the correlation between self-assessed FL and stockholding return is mainly driven by risk-taking willingness. Since the objective FL can improve SIR, the findings about the mediating effect of risk preference imply that stockholding return is determined by both risk-taking willingness and investment ability. In addition, we found that overconfident and competent investors can get a higher return by stockholding, while underconfident investors cannot accumulate wealth from the stock market. Also, we found that risk preference has a significant mediating effect in the relationship between composite FL and SIR. The robustness tests show that these results are robust for the different measures of SIR, composite FL, and risk preference.
Despite SIR in this study is a coarse indicator for the measurement of the outcome of stock market participation, we obtained some meaningful conclusions. The findings showed that the effect of self-assessed FL on SIR is larger than the objective FL. In addition, our results showed that SIR is also determined by the combination of actual literacy and confidence. Most importantly, when considering other measures of composite FL, SIR, and risk preference, the same basic patterns emerge. A plausible interpretation of these patterns is the impact of the self-assessed FL, and the combination of actual and self-assessed FL on the willingness to taking risks, just as the illustrations of theoretical analysis. Investors with high level of self-assessed financial knowledge trust their own capabilities to control more risks, which may incur higher returns. Consistent with this interpretation, the mediating effect of risk preference is proved to be economically and statistically significant in the relationship between self-assessed FL, composite FL, and SIR. The pattern also suggests that high SIR most often should reflect more risk of the portfolio as opposed to optimal strategies. That the investment confidence turns out to be much more important means that increasing it would do much for portfolio outcomes, regardless of the level of actual FL of investors. Additionally, our results show that individuals might shy away from the stock market because the ones with low self-confidence level cannot get an ideal return by stockholding.
Our findings have a particular policy implication. The results of this study show that confidence could bring a higher realized return from stock market investment than the actual level of financial knowledge. So policies that aim to enhance the confidence investors could substantially improve the welfare of stock market participation in China. Therefore, we suggest that both FL and confidence—be it from perfect security market supervision, public information disclosure, etc.—are potential starting points for policies seeking to enhance households welfare from the stock market in China.
We plan to expand this work in several directions. First, we will examine the relationship between FL and specific portfolio and explore whether difficulties in low financial sophistication related to stock investment affect the ability to construct an efficient portfolio. Moreover, we will assess whether overconfidence or underconfidence has an effect on the efficient portfolio construction.
Data Availability Statement
The raw data supporting the conclusions of this article will be made available by the authors, without undue reservation, to any qualified researcher.
Author Contributions
KL: acquisition of original data, software, formal analysis, methodology, and manuscript revision. YZ: reference management and manuscript revision critically. GP: conceptualization, writing – review and editing, methodology, funding acquisition, and manuscript revision. HL and WK: data calculation and writing. All authors contributed to the article and approved the submitted version.
Funding
The authors would like to acknowledge the funding from the National Natural Science Foundation of China [71863009] and the Social Science Fund of Jiangsu University of Technology [KYY20512].
Conflict of Interest
The authors declare that the research was conducted in the absence of any commercial or financial relationships that could be construed as a potential conflict of interest.
Publisher’s Note
All claims expressed in this article are solely those of the authors and do not necessarily represent those of their affiliated organizations, or those of the publisher, the editors and the reviewers. Any product that may be evaluated in this article, or claim that may be made by its manufacturer, is not guaranteed or endorsed by the publisher.
Supplementary Material
The Supplementary Material for this article can be found online at: https://www.frontiersin.org/articles/10.3389/fpsyg.2022.842277/full#supplementary-material
Footnotes
- ^ In this study, the extensions of FL consist of self-assessed FL, overconfidence, underconfidence, competence, and naivety.
- ^ Portfolio theory initiated by Markowitz in 1952 aims to construct an efficient portfolio by selecting a package of securities with a specific investment proportion.
- ^ This implies that they confront the same portfolio frontier, i.e., NB in Figure 1.
- ^ We calculated Cronbach’s alpha for the answer results of these 15 questions. The Cronbach’s alpha is 0.832, which imply that there is a strong reliability and internal consistency for the measurement of objective FL.
- ^ The respondents answering “don’t know” are excluded from the sample.
- ^ As shown in Table 6, the correlation coefficient between the self-assessed and objective FL is only 0.32.
- ^ The difference between the coefficients of self-assessed FL and objective FL is 0.106, which is statistically significant.
- ^ According to the definition of the four composite FL, overconfident and competent investors have relatively high self-assessed FL level.
- ^ For brevity, we do not report the robustness check results in this study, but they can be provided upon request.
References
Allgood, S., and Walstad, W. B. (2013). Financial literacy and credit card behaviors: a cross-sectional analysis by age. Numeracy 6:3.
Allgood, S., and Walstad, W. B. (2016). The effects of perceived and actual financial literacy on financial behavior. Econ. Inquiry 54, 675–697. doi: 10.1111/ecin.12255
Balloch, A., Nicolae, A., and Philip, D. (2015). Stock market literacy, trust, and participation. Rev. Finance 19, 1925–1963. doi: 10.1093/rof/rfu040
Barber, B. M., and Odean, T. (2001). Boys will be boys: gender, overconfidence, and common stock investment. Quarterly J. Econ. 116, 261–292. doi: 10.1162/003355301556400
Baron, R. M., and Kenny, D. A. (1986). The moderator-mediator variable distinction in social psychological research: conceptual, strategic, and statistical consideration. J. Pers. Soc. Psychol. 51, 1173–1182. doi: 10.1037/0022-3514.51.6.1173
Benjamin, D. J., Brown, S. A., and Shapiro, J. M. (2013). Who is behavioral? cognitive ability and anomalous preferences. J. Eur. Econ. Assoc. 11, 1231–1255. doi: 10.1111/jeea.12055
Bound, J., Jaeger, D., and Baker, R. (1995). Problems with instrumental variables estimation when the correlation between the instruments and the endogenous explanatory variable is weak. J. Am. Statistical Assoc. 90, 443–450. doi: 10.1080/01621459.1995.10476536
Calvet, L. E., Campbell, J. Y., and Sodini, P. (2007). Down or out: assessing the welfare costs of household investment mistakes. J. Political Econ. 115, 707–747. doi: 10.1086/524204
Campbell, J. (2006). Household finance. J. Finance 61, 1553–1604. doi: 10.1111/j.1540-6261.2006.00883.x
Chang, L., and Krosnick, J. (2009). National surveys via RDD telephone interviewing versus the Internet: comparing sample representative- ness and response quality. Public Opin. Quarterly 73, 641–678. doi: 10.1093/poq/nfp075
Christelis, D., Jappelli, T., and Padula, M. (2010). Cognitive abilities and portfolio choice. Eur. Econ. Rev. 54, 18–38. doi: 10.1016/j.euroecorev.2009.04.001
Clark, R., Lusardi, A., and Mitchell, O. S. (2017). Financial knowledge and 401(k) investment performance: a case study. J. Pension Econ. Finance 16, 324–347. doi: 10.1017/S1474747215000384
Gallery, N., Gallery, G., Brown, K., Furneaux, C., and Palm, C. (2011). Financial literacy and pension investment decisions. J. Consumer Affairs 27, 286–307. doi: 10.1111/j.1468-0408.2011.00526.x
Graham, J. R., Harvey, C. R., and Huang, H. (2009). Investor competence, trading frequency, and home bias. Manag. Sci. 55, 1094–1106. doi: 10.1287/mnsc.1090.1009
Haliassos, M., and Bertaut, C. (1995). Why do so few hold stocks? Econ. J. 105, 1110–1129. doi: 10.2307/2235407
Hung, A. A., Parker, A. M., and Yoong, J. K. (2009). Defining and measuring financial literacy. SSRN Electronic J. 708. doi: 10.2139/ssrn.1498674
Lusardi, A., and Mitchell, O. S. (2017). How ordinary consumers make complex economic decisions: financial literacy and retirement readiness. Quarterly J. Finance 7, 1–31. doi: 10.1142/S2010139217500082
Odean, T. (1998). Volume, volatility, price, and profit when all traders are above average. J. Finance 53, 1887–1934. doi: 10.1111/0022-1082.00078
Peng, G., Liu, F., Lu, W., Liao, K., Tang, C., and Zhu, L. (2018). A spatial-temporal analysis of financial literacy in united states of America. Finance Res. Lett. 26, 56–62. doi: 10.1016/j.frl.2017.12.003
Peng, G., Zhang, X., Liu, F., Lu, W., Wang, Y., and Yin, Q. (2020). On the relationship between financial literacy and choice behaviours under different risk elicitation methods in surveys. Appl. Econ. 52, 6090–6099. doi: 10.1080/00036846.2020.1784385
Porto, N., and Xiao, J. J. (2016). Financial literacy overconfidence and financial advice seeking. J. Financial Service Professionals 70, 78–88.
Simon, H. A. (1947). Administrative Behavior: A Study of Decision-making Processes in Administrative Organization. New York, NY: The Macmillan Company.
Staiger, D., and Stock, J. H. (1997). Instrumental variables regression with weak instruments. Econometrica 65, 557–586. doi: 10.2307/2171753
Tang, N., Mitchell, O. S., Mottola, G. R., and Utkus, S. P. (2010). The efficiency of sponsor and participant portfolio choices in 401(k) plans. J. Public Econ. 94, 1073–1085. doi: 10.1016/j.jpubeco.2010.06.016
Taylor, M. P. (2016). Are high-ability individuals really more tolerant of risk? a test of the relationship between risk aversion and cognitive ability. J. Behav. Exp. Econ. 63, 136–147. doi: 10.1016/j.socec.2016.06.001
Van Rooij, M., Lusardi, A., and Alessie, R. (2011). Financial literacy and stock market participation. J. Financial Econ. 101, 449–472. doi: 10.1016/j.jfineco.2011.03.006
von Gaudecker, H. M. (2015). How does household portfolio diversification vary with financial literacy and financial advice? J. Finance 70, 489–507. doi: 10.1111/jofi.12231
Xia, T., Wang, Z., and Li, K. (2014). Financial literacy overconfidence and stock market participation. Soc. Indicators Res. 119, 1233–1245. doi: 10.1007/s11205-013-0555-9
Keywords: composite financial literacy, objective financial literacy, risk preference, self-assessed financial literacy, stock investment return
Citation: Liao K, Zhang Y, Lei H, Peng G and Kong W (2022) A Comparative Analysis of the Effects of Objective and Self-Assessed Financial Literacy on Stock Investment Return. Front. Psychol. 13:842277. doi: 10.3389/fpsyg.2022.842277
Received: 23 December 2021; Accepted: 28 February 2022;
Published: 06 April 2022.
Edited by:
Tachia Chin, Zhejiang University of Technology, ChinaReviewed by:
Huang Lei, Zhejiang University of Technology, ChinaChien-liang Lin, Ningbo University, China
Copyright © 2022 Liao, Zhang, Lei, Peng and Kong. This is an open-access article distributed under the terms of the Creative Commons Attribution License (CC BY). The use, distribution or reproduction in other forums is permitted, provided the original author(s) and the copyright owner(s) are credited and that the original publication in this journal is cited, in accordance with accepted academic practice. No use, distribution or reproduction is permitted which does not comply with these terms.
*Correspondence: Geng Peng, penggeng@jsut.edu.cn