Task Context Influences Brain Activation during Music Listening
 Andjela Markovic
 Jürg Kühnis1
  Lutz Jäncke
- 1Division Neuropsychology, Institute of Psychology, University of Zurich, Zurich, Switzerland
- 2International Normal Aging and Plasticity Imaging Center, University of Zurich, Zurich, Switzerland
- 3University Research Priority Program, Dynamic of Healthy Aging, University of Zurich, Zurich, Switzerland
In this paper, we examined brain activation in subjects during two music listening conditions: listening while simultaneously rating the musical piece being played [Listening and Rating (LR)] and listening to the musical pieces unconstrained [Listening (L)]. Using these two conditions, we tested whether the sequence in which the two conditions were fulfilled influenced the brain activation observable during the L condition (LR → L or L → LR). We recorded high-density EEG during the playing of four well-known positively experienced soundtracks in two subject groups. One group started with the L condition and continued with the LR condition (L → LR); the second group performed this experiment in reversed order (LR → L). We computed from the recorded EEG the power for different frequency bands (theta, lower alpha, upper alpha, lower beta, and upper beta). Statistical analysis revealed that the power in all examined frequency bands increased during the L condition but only when the subjects had not had previous experience with the LR condition (i.e., L → LR). For the subjects who began with the LR condition, there were no power increases during the L condition. Thus, the previous experience with the LR condition prevented subjects from developing the particular mental state associated with the typical power increase in all frequency bands. The subjects without previous experience of the LR condition listened to the musical pieces in an unconstrained and undisturbed manner and showed a general power increase in all frequency bands. We interpret the fact that unconstrained music listening was associated with increased power in all examined frequency bands as a neural indicator of a mental state that can best be described as a mind-wandering state during which the subjects are “drawn into” the music.
Introduction
The capacity to appreciate music is a universal human phenomenon that helps inspire individual and social life. Neuroscientific studies have shown that music is processed in a cascade of steps that begins with segregation within the auditory stream, followed by the extraction and integration of a variety of acoustic features, and leading to cognitive memory-related processes that induce personal, often emotional, experiences. In the past 25 years, a wealth of brain-imaging studies has explored critical components of music and how they are processed in the underlying neural networks [e.g., chords (Tervaniemi et al., 2011), musical syntax (Koelsch, 2009), major/minor keys (Virtala and Tervaniemi, 2017), consonance/dissonance (Virtala and Tervaniemi, 2017), timing (Istók et al., 2013), absolute pitch (Hirata et al., 1999; Schaal et al., 2015), harmony (Passynkova et al., 2005), rhythm (Grahn and Rowe, 2009), and timbre (Meyer et al., 2006; Alluri et al., 2012) (for a summary see Jäncke, 2008; Koelsch, 2012)].
A major question in neuroscientific music research is whether musical pieces evoke specific subjective emotional and arousal reactions, which are related to neurophysiological activation patterns. A simple and often-used strategy in this context is to ask subjects to rate the musical pieces. Rating can be done either using questionnaires, which are applied after the presentation of the musical pieces, or by having subjects continuously rate the musical piece as it is played. These ratings can be made either verbally or along several dimensions (e.g., relaxation vs. arousal and/or sadness vs. happiness). The continuous rating of musical pieces is a relatively new strategy that has aided the identification of the time course of subjective experiences during music listening (Hutcherson et al., 2005; Mikutta et al., 2012, 2014; Jancke et al., 2015; Trost et al., 2015). For example, Mikutta et al. (2014) instructed subjects to move a computer mouse forward when they experienced increased arousal caused by the music, independently of their affective valence. The subjects were instructed to move the mouse backward when they experienced decreased arousal. The ratings were recorded and stored for offline analysis with a 100-Hz sampling rate. A slightly different strategy was used by Jancke et al. (2015). In their experiment, subjects rated the musical piece according to valence and arousal using analog scales (a vertical line for valence and a horizontal line for arousal). The subjects were instructed to click on the positions of the valence and arousal lines that best represented their actual valence and arousal ratings, respectively. As with Mikutta et al. (2014), these ratings were recorded for offline analysis with a sampling rate of 100 Hz. These continuous ratings have been applied in three different ways so far: (1) continuous rating of the musical piece simultaneously during neurophysiological recording [Listening and Rating (LR)] (Hutcherson et al., 2005); (2) continuous rating during a second presentation of the musical piece, without neurophysiological recording (LR without neurophysiological recording in a second separate session) (Mikutta et al., 2012, 2013, 2014; Jancke et al., 2015; Trost et al., 2015); (3) continuous rating during the first presentation of the musical piece, without neurophysiological recording (LR without neurophysiological recording in an initial separate session).
Although these approaches have yielded some insight into subjective emotional reactions and the related neurophysiological underpinnings, they are nevertheless associated with methodological problems. When continuously rating a musical piece while listening to it, the cognitive and motor processes are active, and are inactive during passive music listening (Hutcherson et al., 2005). Subjects must continuously self-monitor their feelings and thus must direct their attention not only to the musical piece but also to their own feelings. Basically, this is a multitasking situation during which the subject must: (1) listen attentively to the musical piece, (2) monitor their feelings, (3) transform subjective feelings into psychological categories, and (4) indicate these categories with motor responses. Thus, several psychological functions must be supervised and orchestrated. During passive and attentive listening, the subject has the opportunity to listen to a musical piece unconstrained by any other task. This provides the opportunity to be “drawn” into the music without external distraction. Thus, incoming stimuli other than the musical piece are inhibited and the music has the power to elicit a particular brain activation pattern that most likely can induce the extraordinary feelings and subjective experiences encountered when listening to music. This music experience is definitively different from one in which the listener is required to continuously rate the musical piece to which they are listening.
In addition, directing attention to one’s own emotions might also influence the subjective emotions and the associated neurophysiological and vegetative reactions. Some researchers suggest that focus on one’s own emotions may activate processes that might alter or modulate the emotional response (on both the neural and subjective level). As outlined by Hutcherson et al. (2005), three competing hypotheses can be derived regarding the effect of focusing on emotion on subjective, neural, and vegetative responses, which could be: (1) amplified, (2) weakened, or (3) uninfluenced. The findings based on these hypotheses have largely been inconsistent, supporting any one of the hypotheses (for a summary, see Hutcherson et al., 2005). However, the last fMRI paper on this topic revealed that subjective rating of ongoing emotional responses during music listening did not “decrease either self-reported experience of emotion or neural activations relative to passive viewing in any brain regions” (Hutcherson et al., 2005). However, relative to passive viewing, the act of rating increased activity in brain areas involved in the control of executive functions and emotions (e.g., anterior cingulate, insula).
Neural responses to musical pieces have been studied in the last 50 years using methods ranging from EEG/MEG to fMRI and PET. Although these methods have supported our understanding of the neural underpinnings of music listening, they are associated with their respective advantages and disadvantages. fMRI measurements during music listening are particularly problematic for several methodological and psychological reasons: (1) the obtrusive and unavoidable scanner noise induces undesirable activations in the auditory system (Herrmann et al., 2000; Novitski et al., 2006); (2) subjects have to suppress their processing of the background scanner noise in order to focus on the music stimuli, thus additional executive functions that are inactive during undisturbed music listening have to be activated; (3) the scanner environment is uncomfortable and frequently associated with negative emotions such as discomfort, claustrophobia, pain, low-level anxiety, and other variants of negative emotion (Heinrich et al., 2014; Keulers et al., 2014; Mutschler et al., 2014); (4) the fixation of the subject’s head in the coil is often associated with feelings of malaise and pain; (5) the background scanner noise is often so obtrusive that it greatly disturbs the aesthetic enjoyment of music. The latter especially has largely been neglected in fMRI-based music research, given that we do much to exploit modern methods (e.g., sophisticated HiFi presentation methods) and/or specific presentation environments (opera hall with world-class orchestra) to derive maximum enjoyment from music listening. Music presentations in fMRI environments are definitively of much lower quality than the music presentations to which we normally listen. Other studies have used PET to study blood flow responses to musical stimuli (Satoh et al., 2006). Although PET measurements are silent, they are associated with tracer injections into the subject’s blood, which is a stressful intervention for many subjects, thus most likely mitigating the enjoyment of music listening. Thus, fMRI and PET environments are definitively not the perfect experimental environments in which to study neural and emotional responses to aesthetically appealing music stimuli.
EEG and MEG, on the other hand, measure neurophysiological responses in an ecologically valid setting (e.g., sitting on a chair while listening to HiFi music without interfering noise). The relative disadvantage of EEG recordings is the lower spatial resolution (if the aim is to estimate the underlying cortical sources of EEG activity), although the correspondence between EEG-based estimations of intracortical sources and fMRI measurements is astonishingly high (Britz et al., 2010; Van de Ville et al., 2010). Several published studies have used EEG to measure neural responses during music listening (Petsche et al., 1993; Iwaki et al., 1997; Sarnthein et al., 1997; Bhattacharya and Petsche, 2001; Bhattacharya et al., 2001a,b; Altenmuller et al., 2002; Jaušovec and Habe, 2005; Baumgartner et al., 2006; Jausovec et al., 2006; Peterson and Thaut, 2007; Sammler et al., 2007; Schaefer et al., 2009, 2011a,b, 2013; Mikutta et al., 2012, 2014; Wu et al., 2012; Jancke et al., 2015; Jancke and Alahmadi, 2016; Rogenmoser et al., 2016). Some of these studies focused on the functional network characteristics during music listening and identified specific network features in various frequency bands. A further set of studies focused on the frontal activation asymmetry patterns during the listening of differently valenced and arousing music (Tsang et al., 2001; Altenmuller et al., 2002; Mikutta et al., 2012, 2014).
In the context of this paper, the study by Schaefer et al. (2011b) is of particular interest. The authors reported increased alpha band power during imagery of listening to a musical piece as compared to during the perception of the musical piece. The authors explained this increase during imagery as an indicator of a modulation of the attentional network. They related their finding to Klimesch’s “inhibition concept,” where alpha band oscillations are a neurophysiological indicator of an active inhibition of non-task-relevant cortical areas. Thus, when directing attention internally (as when imagining listening to the musical piece), numerous networks, especially those processing incoming information, must be inhibited. However, several studies have shown that alpha band power is increased also while listening to rhythms, tone sequences, and even natural musical pieces. In a previous study, we identified increased power during music listening not only in the alpha band, but also in the theta and beta bands (Jancke et al., 2015). We interpreted this general synchronizing in different frequency bands as a neural indicator of a psychological process during which the subject is torn into the music.
However, the question arises as to whether this general synchronization only occurs during unconstrained music listening or whether it is disrupted or diminished when music listening is accompanied by a task that must be performed simultaneously. In this context, we reconsidered the question of whether simultaneous music listening and rating (LR condition) will induce different neural and vegetative activations compared to passive listening without rating (listening: L condition). We were also interested in examining whether the sequence in which these experimental conditions are followed is important. Particularly, we were interested in whether the LR condition influences the subsequent L condition in terms of the neural, vegetative, and subjective responses. Thus, it is possible that when the subjects have rated the musical pieces first (LR condition), they might implicitly do so even when not required (L condition) subsequently. To measure the neural responses, we focused (similarly as in our previous paper) on the power in the theta, alpha, and beta bands. In addition, we used subjective ratings of the musical pieces and heart rate (HR) and electrodermal (EDA) responses. The HR and EDA were used because these measures are good indicators of vegetative arousal responses during music listening (Jancke et al., 2015; Koelsch and Jancke, 2015). Using these measures, we addressed the following research questions:
(1) Does the same synchronization occur in the theta, alpha, and beta bands during the L condition as we have shown previously (Jancke et al., 2015)?
(2) Does the LR condition diminish the synchronization in the different frequency bands?
(3) Is there less synchronization in the different frequency bands during the L condition when subjects have previously followed the LR condition? In other words, does the earlier experience of explicitly rating a musical piece prevent or negatively influence the synchronization of EEG oscillations?
(4) Are the HR and EDA responses different during the LR and L conditions?
(5) Are the HR and EDA responses during the L condition different when subjects have followed the LR condition prior?
Materials and Methods
Subjects
Fifty-one subjects (18 men and 33 women) took part in this experiment. All were students enrolled in psychology, biology, medicine, or computer sciences at the University Zurich or ETH Zurich. Mean age was 24 years (range: 19–31 years). All subjects were consistently right-handed, as revealed by the Edinburgh Handedness Inventory (Oldfield, 1971). In order to control for general cognitive abilities, we applied two short intelligence tests, namely the KAI (Kurztest der aktuellen geistigen Leistungsfähigkeit; Lehrl et al., 1992) and the MWT (Mehrfachwahl-Wortschatz-Intelligenz; Lehrl et al., 1974). These tests revealed above average general cognitive abilities for the participating subjects (KAI-IQ: mean = 124.02, SD = 12.08; MWT-IQ: mean = 109.57, SD = 13.17). To control for personality traits and emotional responsiveness subjects had to work on a personality questionnaire (NEO-FFI; Borkenau and Ostendorf, 1993), an alexithymia scale (TAS-26; Kupfer et al., 2001), and a rating scale measuring emotional responsiveness [Skalen zum Erleben von Emotionen (SEE); Becker, 2004]. The musical aptitudes of the participants were estimated using the Advanced Measure of Music Audiation (AMMA) test published by Gordon (1989). This procedure is based on the assumption that a fundamental prerequisite for musical aptitude is the ability to hold musical sounds in memory and detect melodic and rhythmic variations. During the AMMA test, the volunteers listened to short pairs of piano tone sequences and had to decide whether these sequences were equivalent, rhythmically different, or tonally different. The subjects scored above average (per the norms of the Gordon test; total score for all subjects: 56.16, SD = 20.31; mean and SD of the norm population for non-musicians = 50.6 ± 7.9). No subjects reported a history of present or past neurological, psychiatric, or audiological disorders, and all possessed an unremarkable audiological status. In addition, the subjects completed the Barcelona Music Reward Questionnaire (BMRQ), which is known to be a reliable measure of inter-individual variability in music-induced reward (Mas-Herrero et al., 2013). All subjects denied consuming illegal drugs or regular medication. None of the subjects indicated any history of professional musical training, as assessed by an in-house questionnaire frequently used by our research group. In addition, all subjects indicated that they did not perform in an orchestra, band, or choir within the last 5 years. Each subject received 50 Swiss Francs for the participation. The study was carried out in accordance with the Declaration of Helsinki principles, approved by the ethics committee of the University of Zurich. All subjects gave written, informed consent and were informed of their right to discontinue participation at any time.
The subjects were randomly assigned to one of the two groups. 26 subjects were assigned to group 1 (G1) while the remaining 25 subjects were allocated to group 2 (G2). There was no between groups difference with respect to the above-mentioned control variables (age, KAI, MWT, NEO-FFI, TAS-26, AMMA, SEE, and handedness).
Stimuli
We used four musical pieces taken from well-known Oscar awarded sound tracks: (1) “Ship at Sea” from the “Pocahontas” sound track composed by Alan Menken; (2) “Pretty Peppy” from the soundtrack “The Artist” composed by Ludovic Bource; (3) “Concerning the Hobbits” from the soundtrack “Lord of the Rings” composed by Howard Shore; (4) “A Familiar Taste” from the soundtrack “The Social Network” composed by Trent Reznor and Atticus Ross. We have chosen these musical pieces according to a procedure applied by Lin et al. (2010). In a pilot study 20 students (not taking part in the final experiment) rated 20 musical pieces according to valence and arousal. Based on their evaluations we chose the above-mentioned musical pieces because of their dynamic variability in terms of arousal and valence ratings. We used the iTunes version of these musical pieces and transformed the mp4 format into the widely used mp3 format. The musical pieces were presented via HiFi earphones (Sennheiser, CX-350, Colchester, Essex, United Kingdom) with a convenient volume level (intensity = 75 dB). The duration of each musical piece was set to 3 min. Presentation of the musical pieces as well as the supervision of the entire experiment was controlled by Presentation software (Neurobehavioral Systems, Inc., Berkeley, CA, United States).
Procedure
Over the entire course of the study, participants were seated in a comfortable chair in a sound-shielded room in front of a computer monitor. After fixation of the Geodesics EEG net, all subjects conducted an eyes open (EO) and eyes closed (EC) EEG measurement condition for 3 min each. During these conditions the subjects were instructed to relax and to let their mind wander. After these initial measurements, they practiced the usage of the computer mouse for the later following ratings for 6 min (3 min without and 3 min with music). After that the experimental conditions started.
We used two experimental conditions during which the four musical pieces (3 min duration each) were presented in random order. Between each musical piece a pause of 10 s duration was placed during which the subjects were instructed to relax. In one condition the subjects were instructed to listen passively to the musical pieces as they normally do when they listen to musical pieces for recreational purposes [Listening (L)]. During the second condition, the subjects were asked to continuously rate the musical pieces using the computer mouse. Thus, they simultaneously performed the rating task while listening to the musical pieces [Listening and Rating (LR)]. These ratings were done on a computer monitor placed in front of the subjects, on which they were shown a horizontal line for valence and a vertical line for arousal. The SAM for valence ranged from a frowning, unhappy figure (left) to a smiling, happy figure (right). The subjects were instructed to place/move the mouse cursor to the position of this horizontal valence line that best represents their actual valence rating. The values for each position on the valence line ranged from -1000 (left = unhappy) to +1000 (right = happy). Thus, values > 0 point to positive valence while values < 0 point to negative valence. For arousal rating we used a vertically arranged analog scale ranging from 0 (bottom = relaxed) to 1000 (top = excited). These rating data were collected with a sampling rate of 500 Hz. Twenty-six subjects started with the passive listening condition (G1) while the second group (G2) started with the LR condition. During the music presentation, we also collected EDA and HR. EDA and HR were recorded with a Biopack MP100 amplifier. The sampling rate for the vegetative data was 200 Hz. The subjects were asked not to clench their teeth and to avoid any kinds of movements other than mouse movement during the entire recording time. The entire experiment lasted about 1.5 h including fixing of electrodes, instruction, conducting the EEG measurements during the two listening conditions, debriefing and removing of electrodes.
We would like to explicitly mention that we refrained from employing further experimental conditions for this study. For example, it would have been possible to use a L-L and a LR-LR condition. However, we refrained from using them because in our previous study (Jancke et al., 2015) we showed that during repeated presentation of a musical piece the EEG and vegetative responses are strikingly similar when the subjects employ similar listening attitudes. Thus, we assumed that these conditions would unnecessarily expand the experiments and would have placed too much burden on the subjects.
EEG Recording and Data Reduction
Electroencephalograms were recorded using a high-density Geodesics EEG system (GSN300; Electrical Geodesics, Inc., Eugene, OR, United States) with a 128-Channel HydroCel Geodesic Sensor Nets@ (HCGSN120). Data was sampled at 500 Hz and bandpass filtered at 0.1–30 Hz. The vertex electrode (Cz) served as an on-line reference. Impedance was maintained below 50 kOhm. For the exact positioning of the onset of music in the EEG, a marker channel was used to indicate the start and end of the musical piece. EEG analysis was conducted to identify the spectral correlates of music-induced fluctuations in cortical activations.
EEG data were analyzed with the Brain Vision Analyzer version 2.0.1 (Brain Products GmbH, D-82205 Gilching). In a first step, raw EEG data were bandpass filtered (1–30 Hz) including a notch-filter of 50 Hz to eliminate even very small oscillations leaking above 30 Hz. Eye movements and muscle artifacts were corrected by applying independent component analysis (Delorme et al., 2007). In addition, remaining muscle artifacts were identified and eliminated using ASR (The Artifact Subspace Reconstruction Method developed and programmed by Christian A. Kothe), a new algorithm designed to remove non-stationary high-variance signals from EEG time series and reconstruct the missing data using a spatial mixing matrix (assuming volume conduction). The EEG data of all channels were recomputed to average reference and frequency transformed by means of a fast Fourier transform (FFT).
Analysis of Vegetative Data
From the time course of vegetative data, we calculated the mean HR and EDA for a one second lasting period before music presentation. These means were used as baseline measures. The HR and EDA values measured during music presentation were related to these baseline values resulting in percent change measures. The mean percent change measures for HR and EDA were subjected as dependent variables to subsequent statistical analysis. Here we focus on the mean HR and EDA response since these vegetative measures are known to be valid indicators of vegetative responses in the context of emotional reactions (Koelsch and Jancke, 2015).
Main Data Analysis
For the artifact-free EEG data we computed spectral amplitudes (μV2/Hz) for the entire EEG recorded during each musical piece, and the EO and EC condition for the theta band (4–8 Hz), the lower alpha band (alpha-1: 8–10 Hz), the upper alpha band (alpha-2: 10–12 Hz), a lower beta band (beta-1: 13–20 Hz), and an upper beta band (beta-2: 20–30 Hz). In this paper we focus on the average EEG response during the entire music presentation in order to uncover general and tonic brain activations induced by the musical pieces in the different conditions. In order to gain statistical power, we defined nine electrode clusters of interest (EOI) for which the mean power of the frequency bands was calculated: three frontal, three central, and three parietal (left, midline, and right). The EOIs comprised the following sensors in the Geodesics space (the number indicate the particular Geodesics scalp electrodes):
(1) left frontal (LF) = 23 (F3), 24, 26, 27, and 33 (F7);
(2) midline frontal (MF) = 4, 5, 10, 11 (Fz), 12, 16, 18, and 19;
(3) right frontal (RF) = 2, 3, 122 (F8), 123, and 124 (F4);
(4) left central (LC) = 36 (C3) and 41;
(5) midline central (MC) = 31, Cz, and 80;
(6) right central (RC) = 103 and 104 (C4);
(7) left parietal (LP) = 47, 51, 52 (P3), 58, and 59;
(8) midline parietal (MP) = 61, 62 (Pz), and 78;
(9) right parietal (RP) = 91, 92 (P4), 96, 97, and 98.
These EOIs were chosen because they symmetrically cover the frontal, central, and parietal scalp regions of both hemispheres. Applying Geodesics EEG montages, several papers have used similar or even the same electrodes of interest (e.g., Curran and Dien, 2003). The power values of the different frequency bands from these EOIs were log transformed to stabilize the variances. These values were collapsed over the four different songs since they are all rated as being positive and arousing and the scope of this analysis was not to identify differences between the songs. We conducted four-way ANOVAs with three repeated measurements factors [Region: Frontal, Central, Parietal; Hemisphere: Left, Central, Right; Condition: Listening (L), Listening and Rating (LR)] and one grouping factor (Group: Group1: Listening → Listening and Rating, Group2: Listening and Rating → Listening). Arousal and valence ratings were subjected to t-tests comparing both groups (Group1: L → LR, Group2: LR → L). The HR and EDA measures were subjected to three-way ANOVAs with two repeated measurements factor (Condition: Listening, Rating and Listening; Song: Song 1 to Song 4) and one grouping factor (Group: Group1: L → LR, Group2: LR → L). For calculating the ANOVAs we used the afex R package for mixed and repeated measurements designs (Singmann et al., 2016). We only report Greenhouse–Geisser corrected p-values. A p-value of < = 0.05 was defined as significant. In case of significant interactions, we calculated Bonferroni–Holm-corrected post hoc t-tests as provided by the lsmean and multcomp R packages.
Results
Subjective Ratings and Vegetative Measures
The t-tests for the valence and arousal ratings revealed no between-group differences (all p-values > 0.3). The three-way ANOVA for HR revealed a significant main effect for Condition [F(1,52) = 5.87, p = 0.02, η2 = 0.02], which is qualified by HR decreases during the LR condition, while there was a slight HR increase during the L condition. There was no further significant main effect nor interaction with respect to the HR changes. The ANOVA for the EDA measures only revealed a trend toward a significant interaction between Group and Condition [F(1,52) = 3.03, p = 0.09, η2 = 0.006]. This interaction is qualified by differently changing EDA measures for both groups in the LR and L conditions. Those subjects starting with the L condition demonstrated reduced EDA values during the LR compared to the L condition. Subjects starting with the LR condition demonstrated slightly increased EDA measures during the LR condition.
EEG Measures
In Figure 1 EEG topoplots are shown for each frequency band broken down for the major conditions (L and LR) and for the two groups with the different sequences of L and R (L → LR and LR → L). Table 1 lists all significant effects obtained from the mixed ANOVAs for the five frequency bands. The detailed tabulation of these results is given in the Appendix at the end of this manuscript including the degrees of freedom and the general effect size measures. Here, we will only discuss the findings based on the reported p-values.
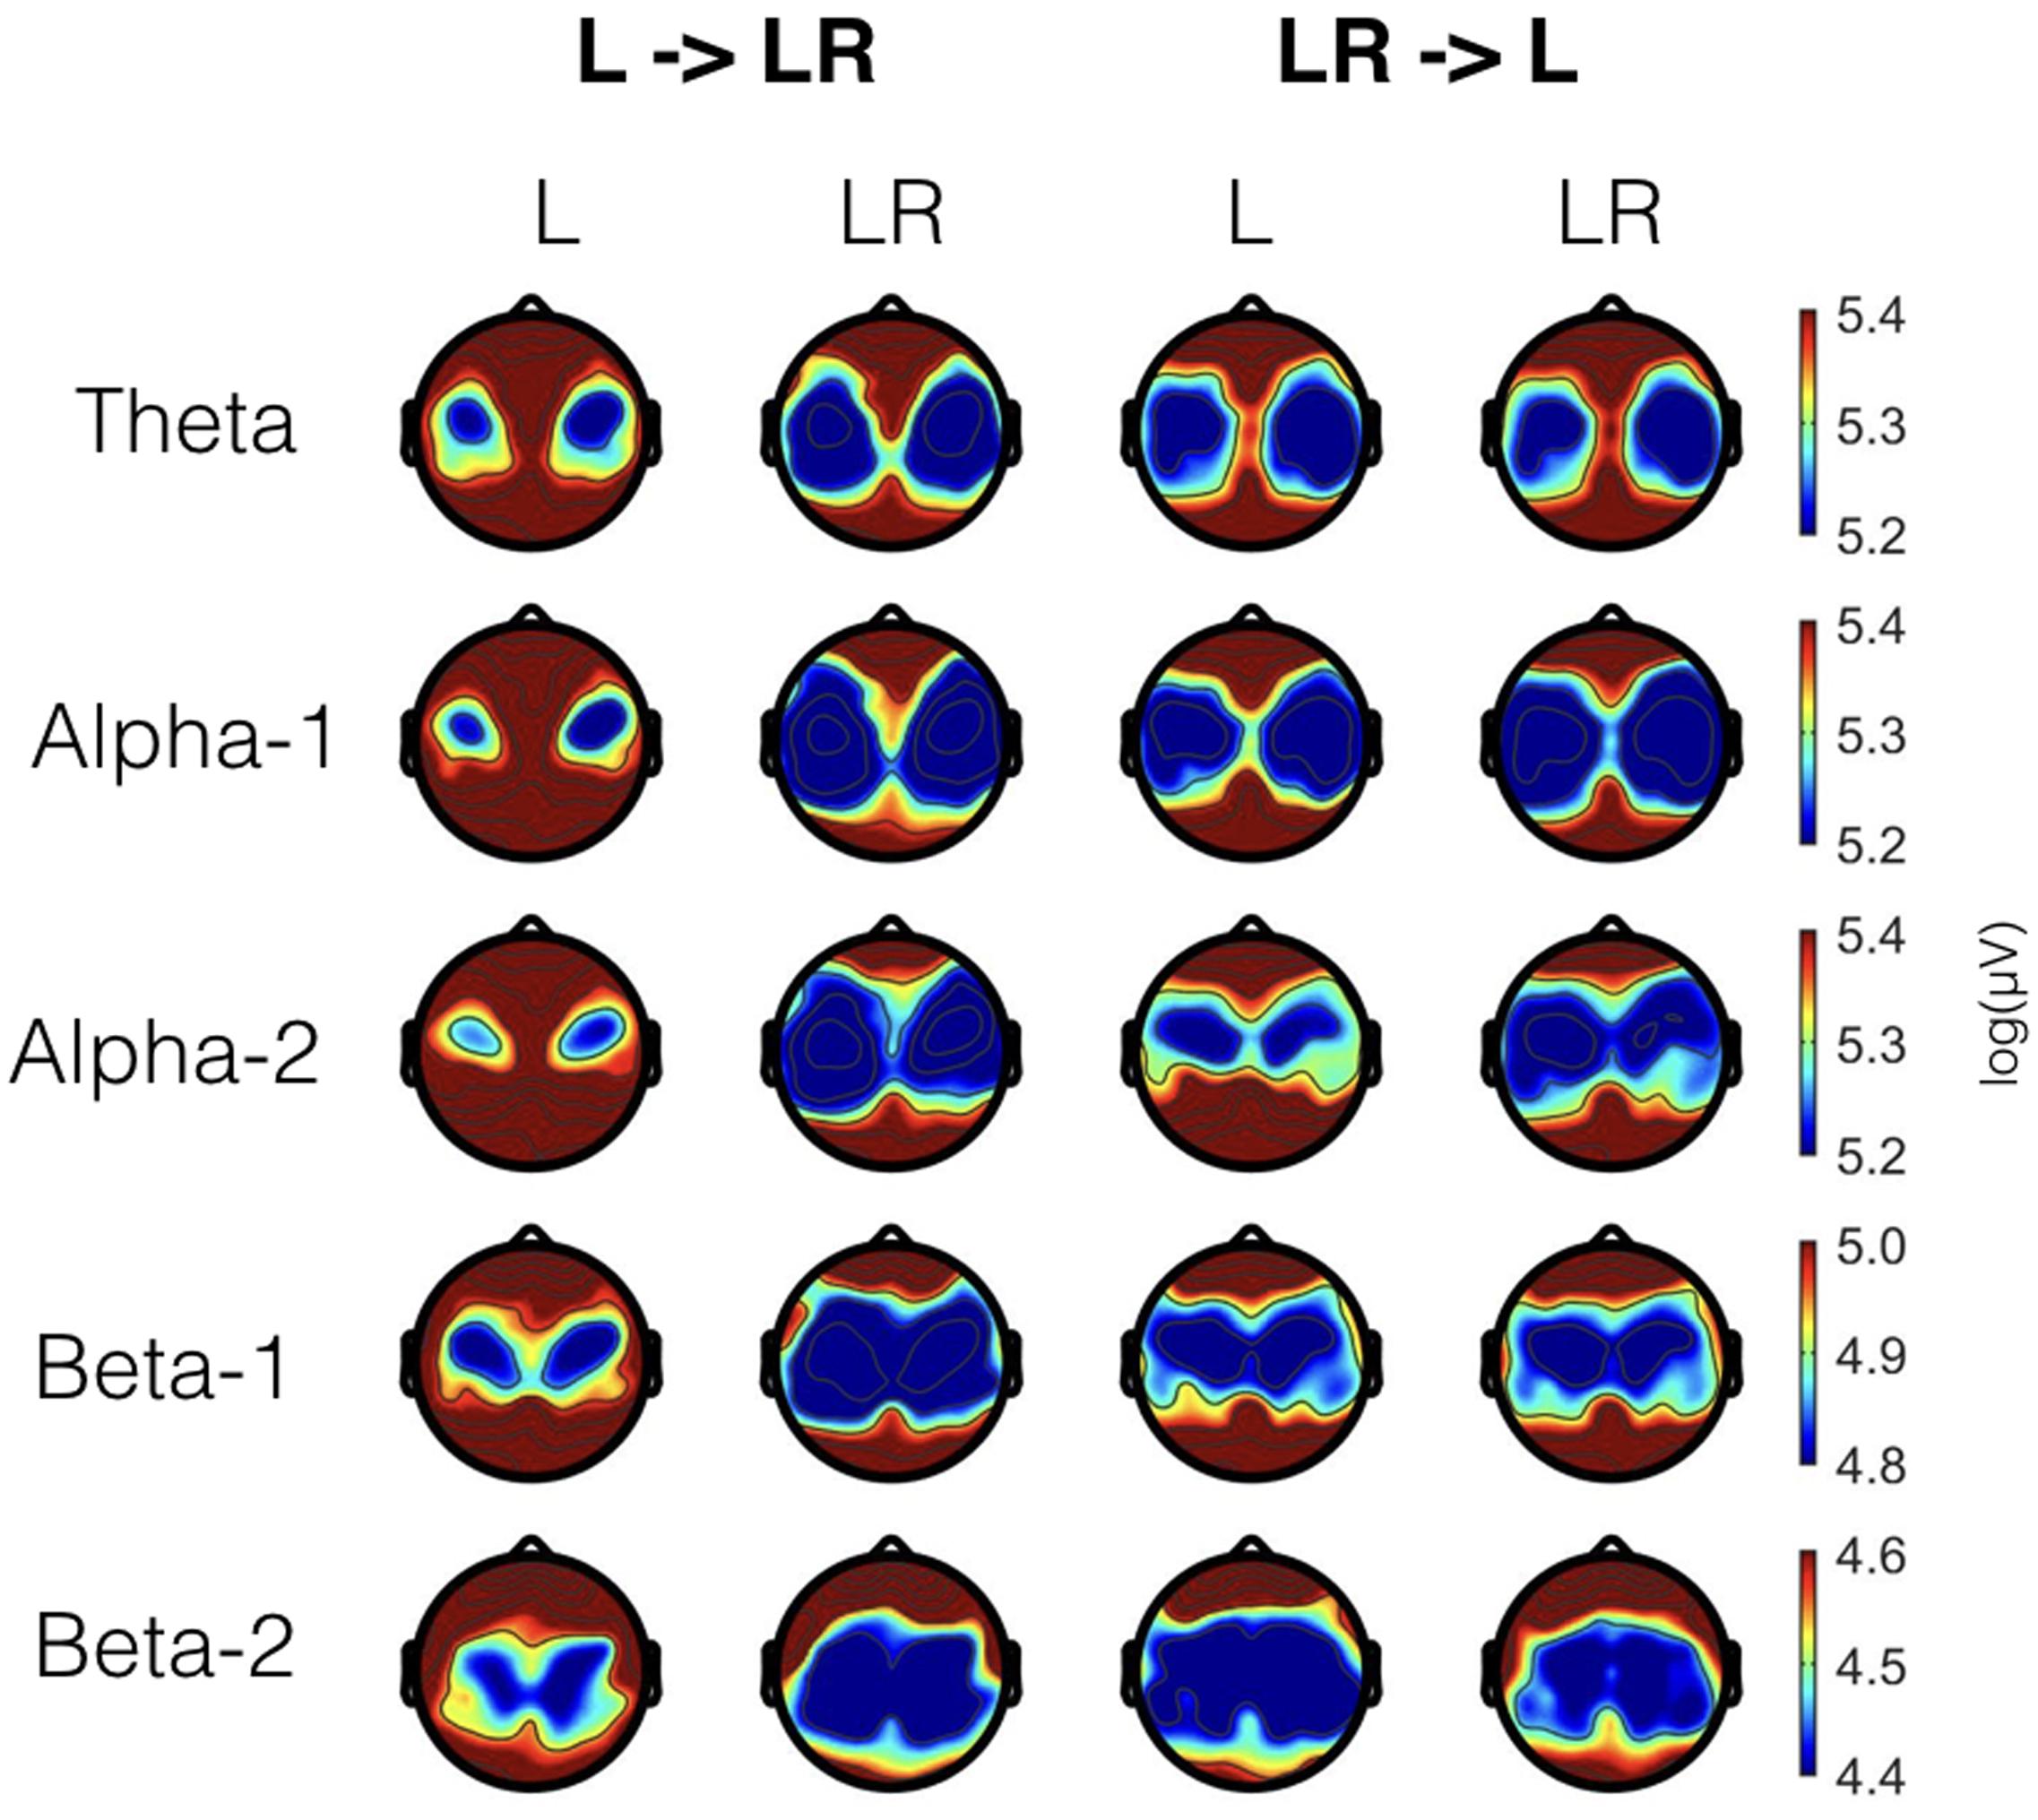
FIGURE 1. EEG topoplots for the different frequency bands broken down for the two conditions (L and LR) and the two groups (L → LR and LR → L). For each frequency band, we have used a slightly different scale. These scales are the same as for the Figures 2–4.
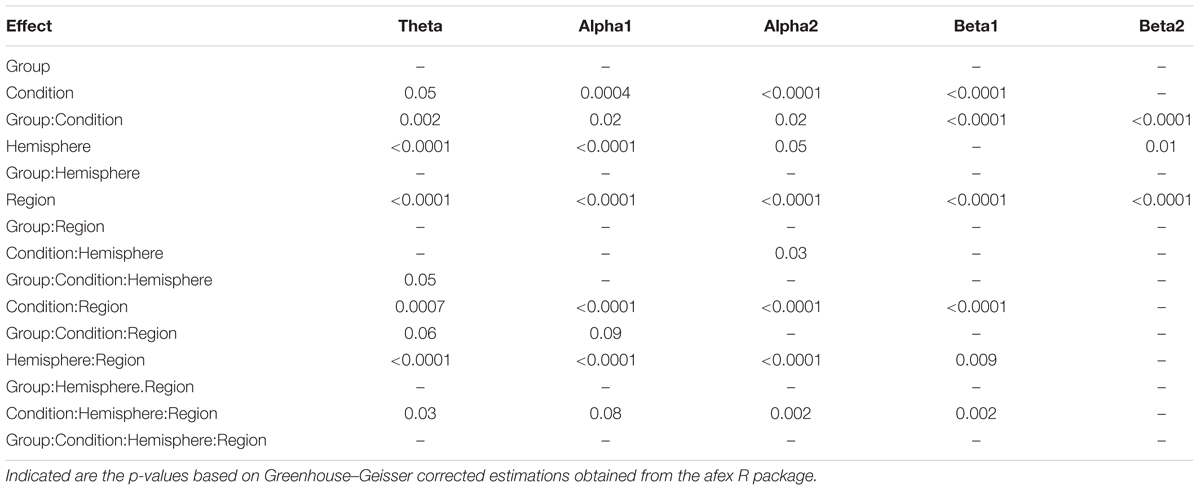
TABLE 1. Significant effects from the mixed ANOVAs for the different frequency bands.
Since, the Group × Condition interactions are most important for our study we will present them first. These interactions are graphically presented in Figure 2. Post hoc tests revealed stronger power values during the L condition than during the LR condition but only for those subjects who started with the L condition (Group L → LR). The other group who started with the LR condition showed basically similar power values during both conditions. There are also two partly significant three-way Group × Condition × Region interactions, which are graphically shown in Figure 3. These interactions are qualified by slightly stronger differences between L and LR for the central and parietal EOIs than for the frontal EOIs. There is also a three-way Group × Condition × Hemisphere interaction which became significant for the theta band power only Figure 4. This interaction is qualified by the stronger theta power values during the L than during the LR condition only for the subjects from the L → LR group. These L vs. LR differences are particularly strong for the central and parietal EOIs.
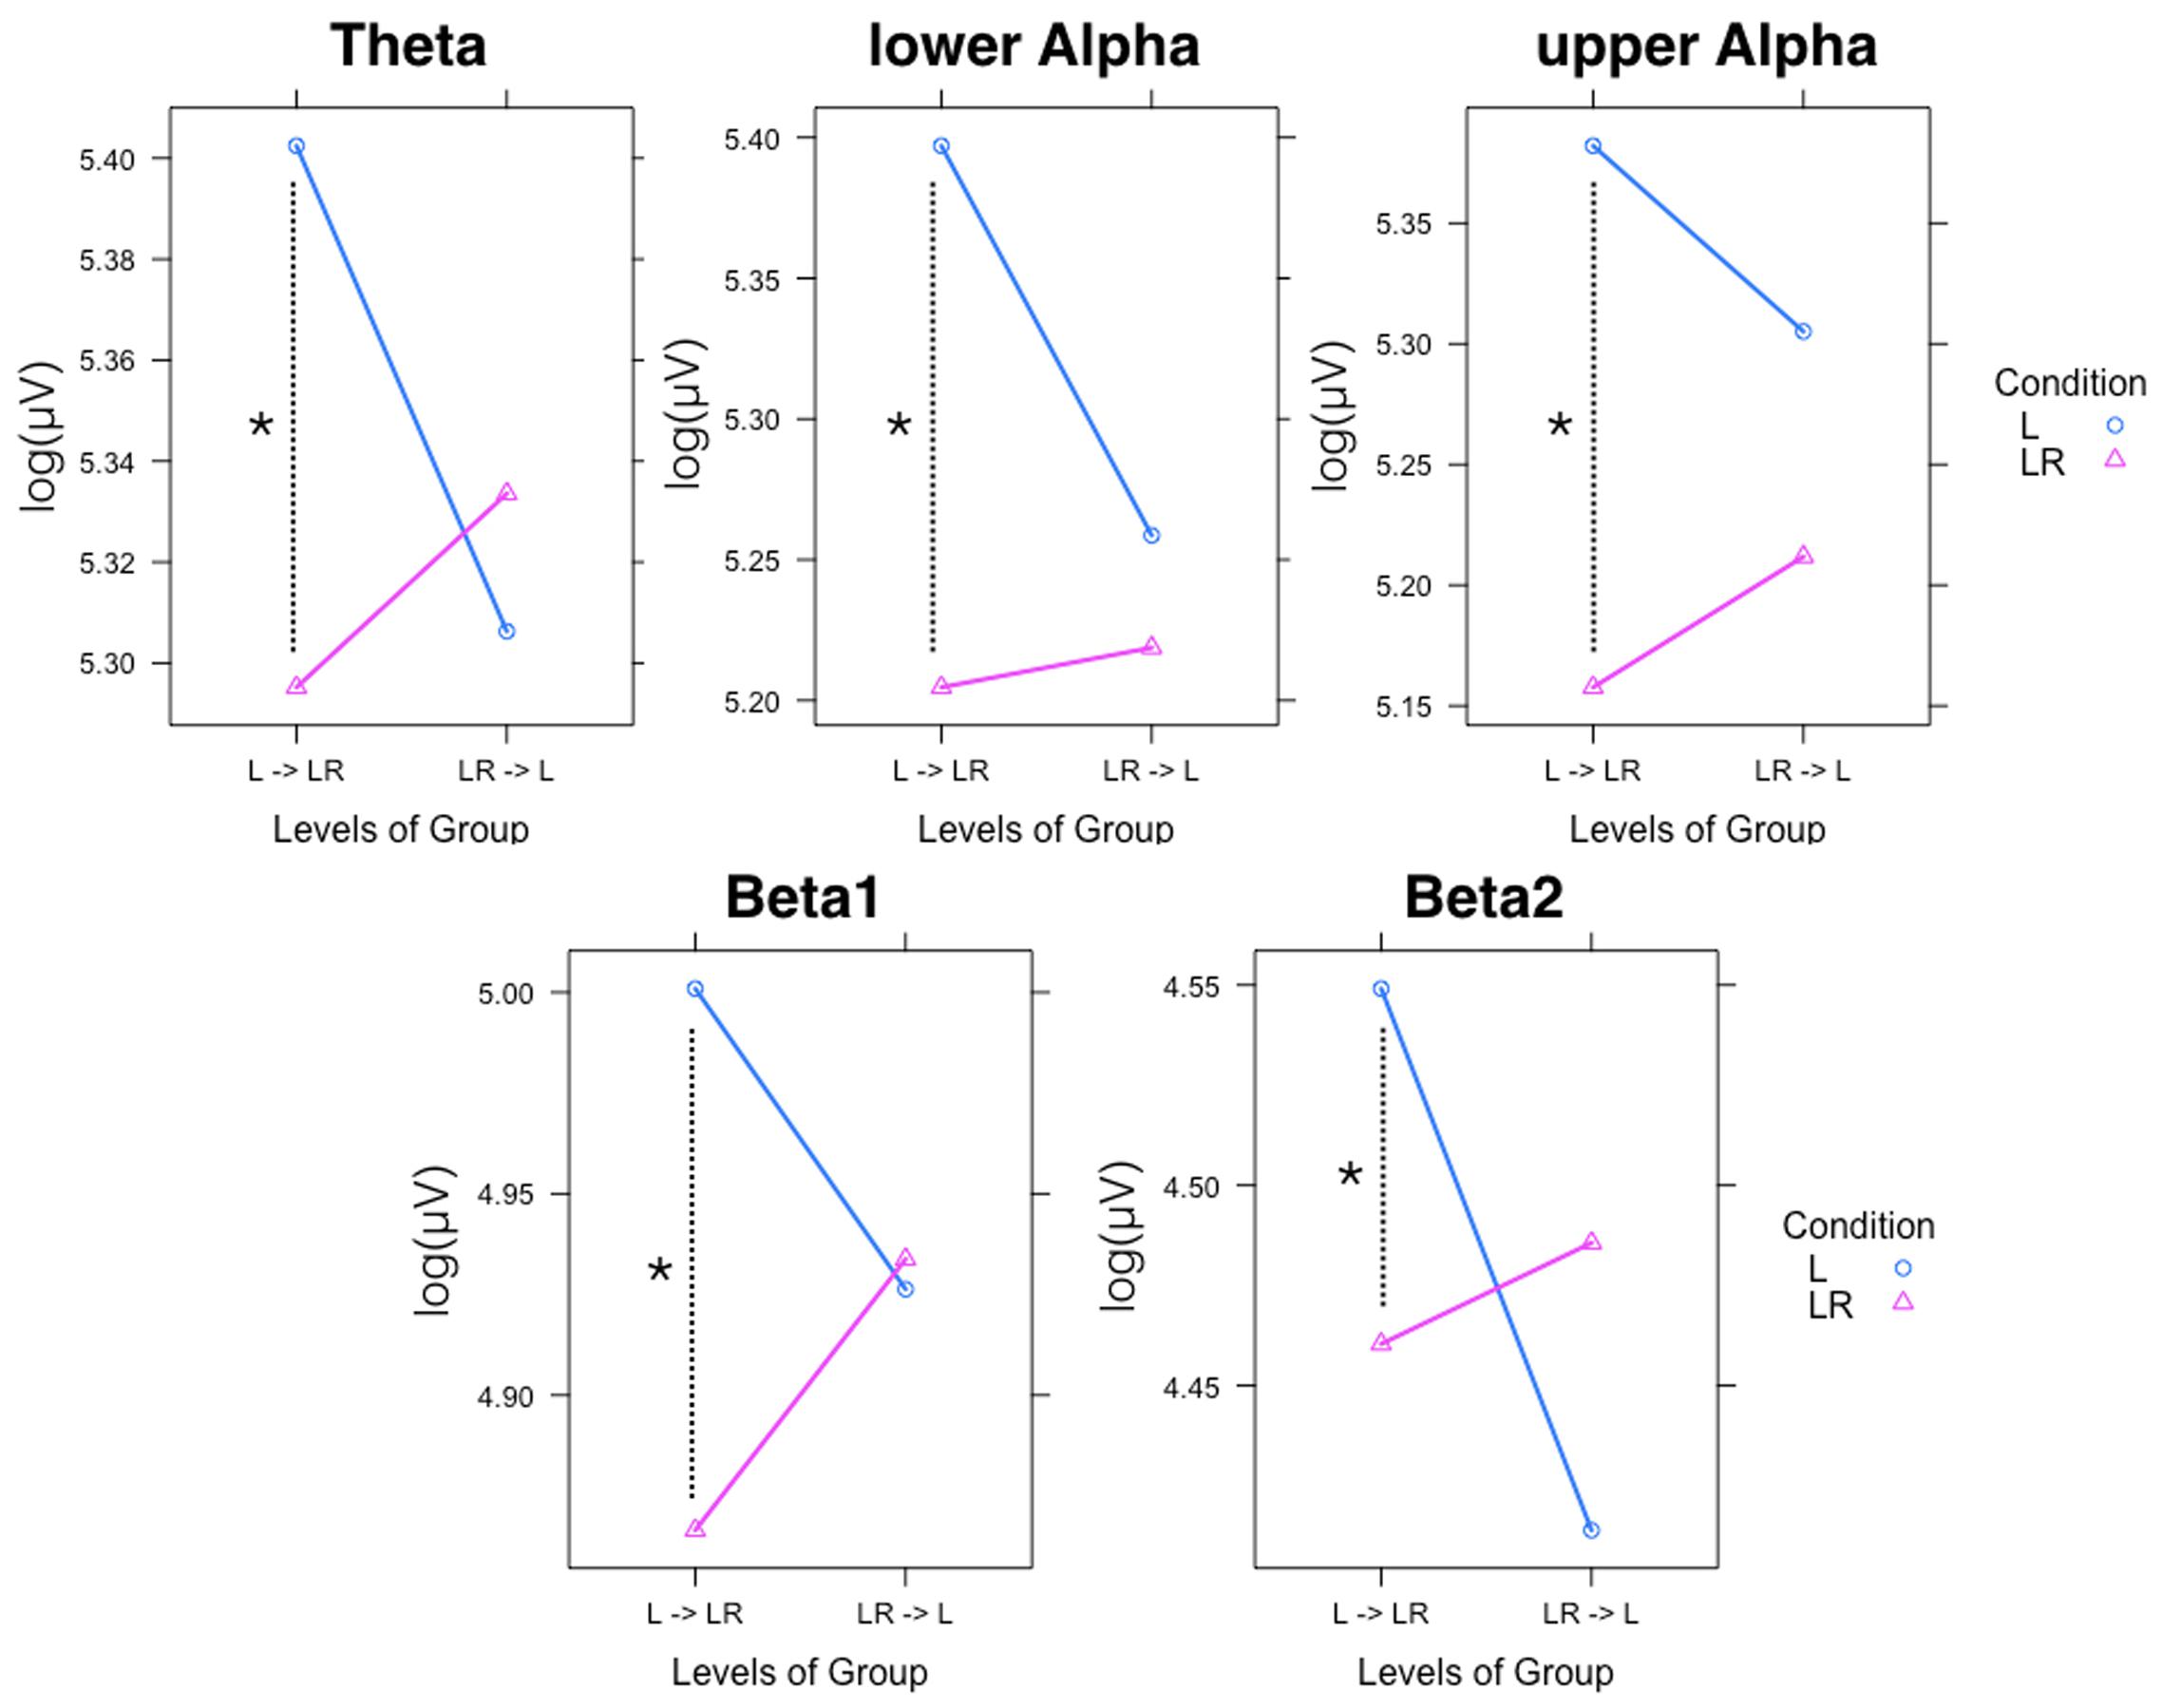
FIGURE 2. Significant two-way Group × Condition interactions for all frequency bands. Abscissa depicting the levels for the two groups: L = Group starting with Listening and continuing with Listening and Rating; LR = Group starting with Listening and Rating and continuing with Listening. The colored lines indicate the different Conditions: L (blue) = Listening, LR (red) = Listening and Rating. ∗Indicates a significant difference.
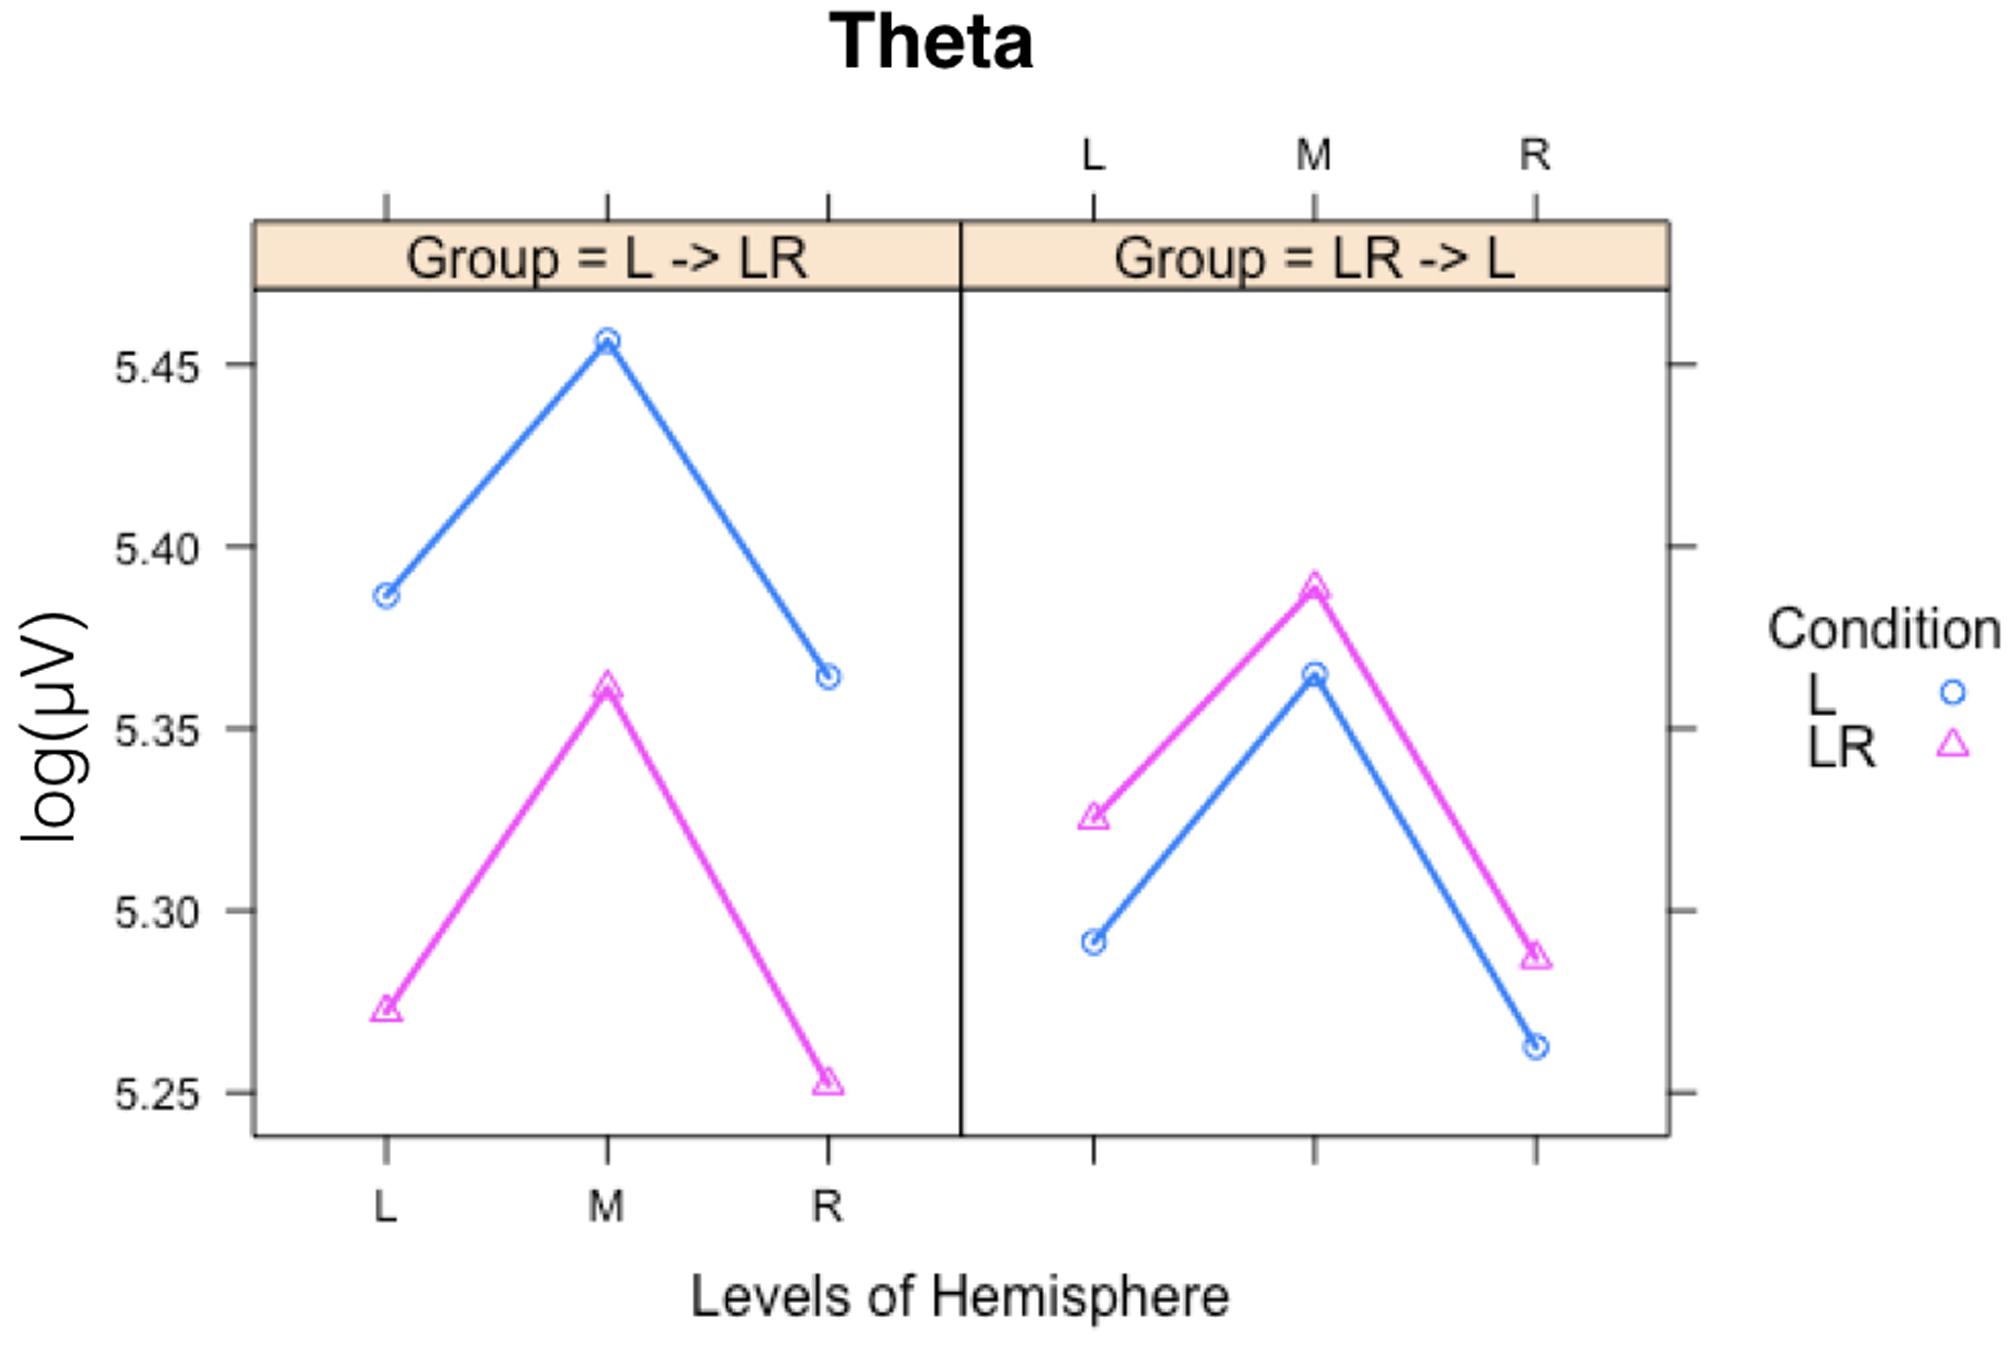
FIGURE 3. Interaction plot for the significant three-way Group × Condition × Hemisphere interaction for the theta band. Abscissa depicting the different Hemisphere positions (L = left, M = middle, R = right). The colored lines indicate the different Conditions: L (blue) = Listening, LR (red) = Listening and Rating. The left panel shows the results for the Group starting with Listening and Rating and continuing with Listening; the right panel shows the results for the Group starting with Listening and continuing with Listening and Rating.
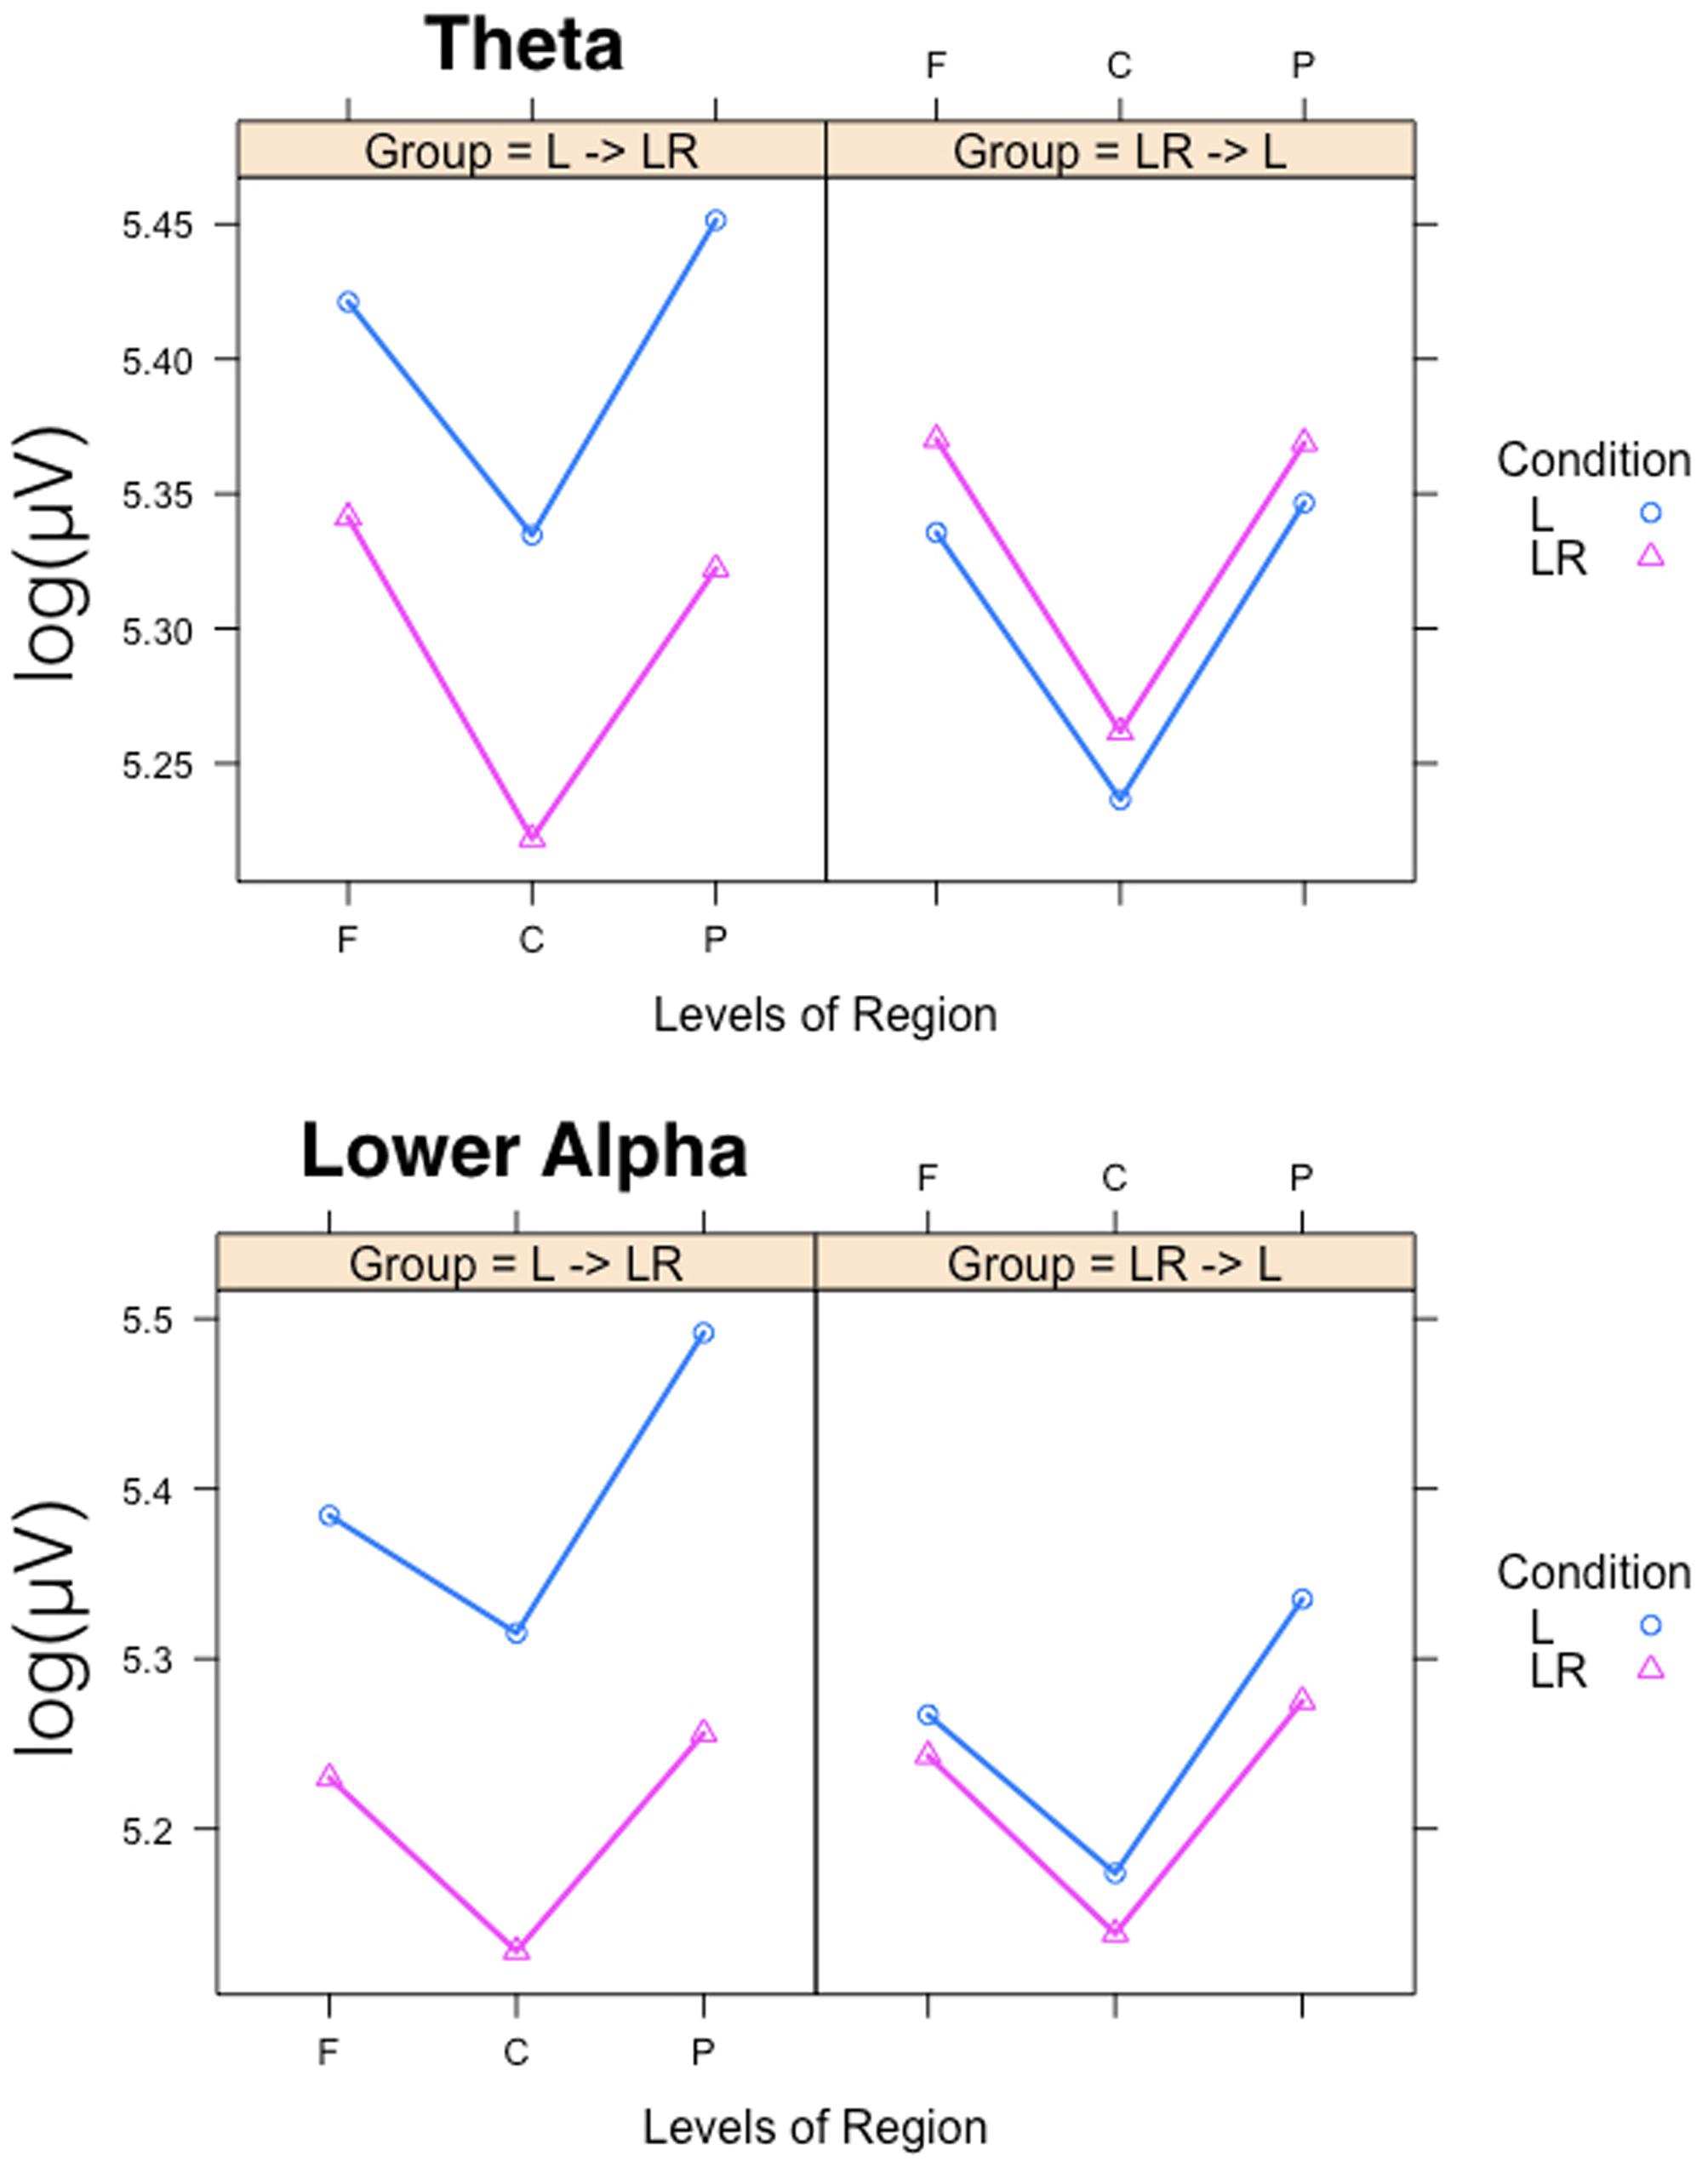
FIGURE 4. Interaction plots for the partly significant three-way Group × Condition × Region interactions for the theta and lower alpha band. Abscissa depicting the different positions in the fronto-parietal direction (F = frontal, C = central, P = parietal). The colored lines indicate the different Conditions: L (blue) = Listening, LR (red) = Listening and Rating. The left panel shows the results for the Group starting with Listening and Rating and continuing with Listening; the right panel shows the results for the Group starting with Listening and continuing with Listening and Rating.
In Figure 5 the significant three-way Condition × Hemisphere × Region interaction plots are shown. As one can see from these plots the frontal to parietal profiles of the power values are different across the hemispheres and conditions. For lower and upper alpha, there are preponderances for the parietal EOI. For theta, the strongest power values are found for frontal midline EOIs. Beta1 power is mostly stronger frontally. In addition, the power values for the L condition are significantly stronger except for beta1. The two-way Condition × Region interactions revealed significant differences between the power values obtained during the L compared to the LR conditions for all regions and the four frequency bands except for the theta band at frontal EOIs.
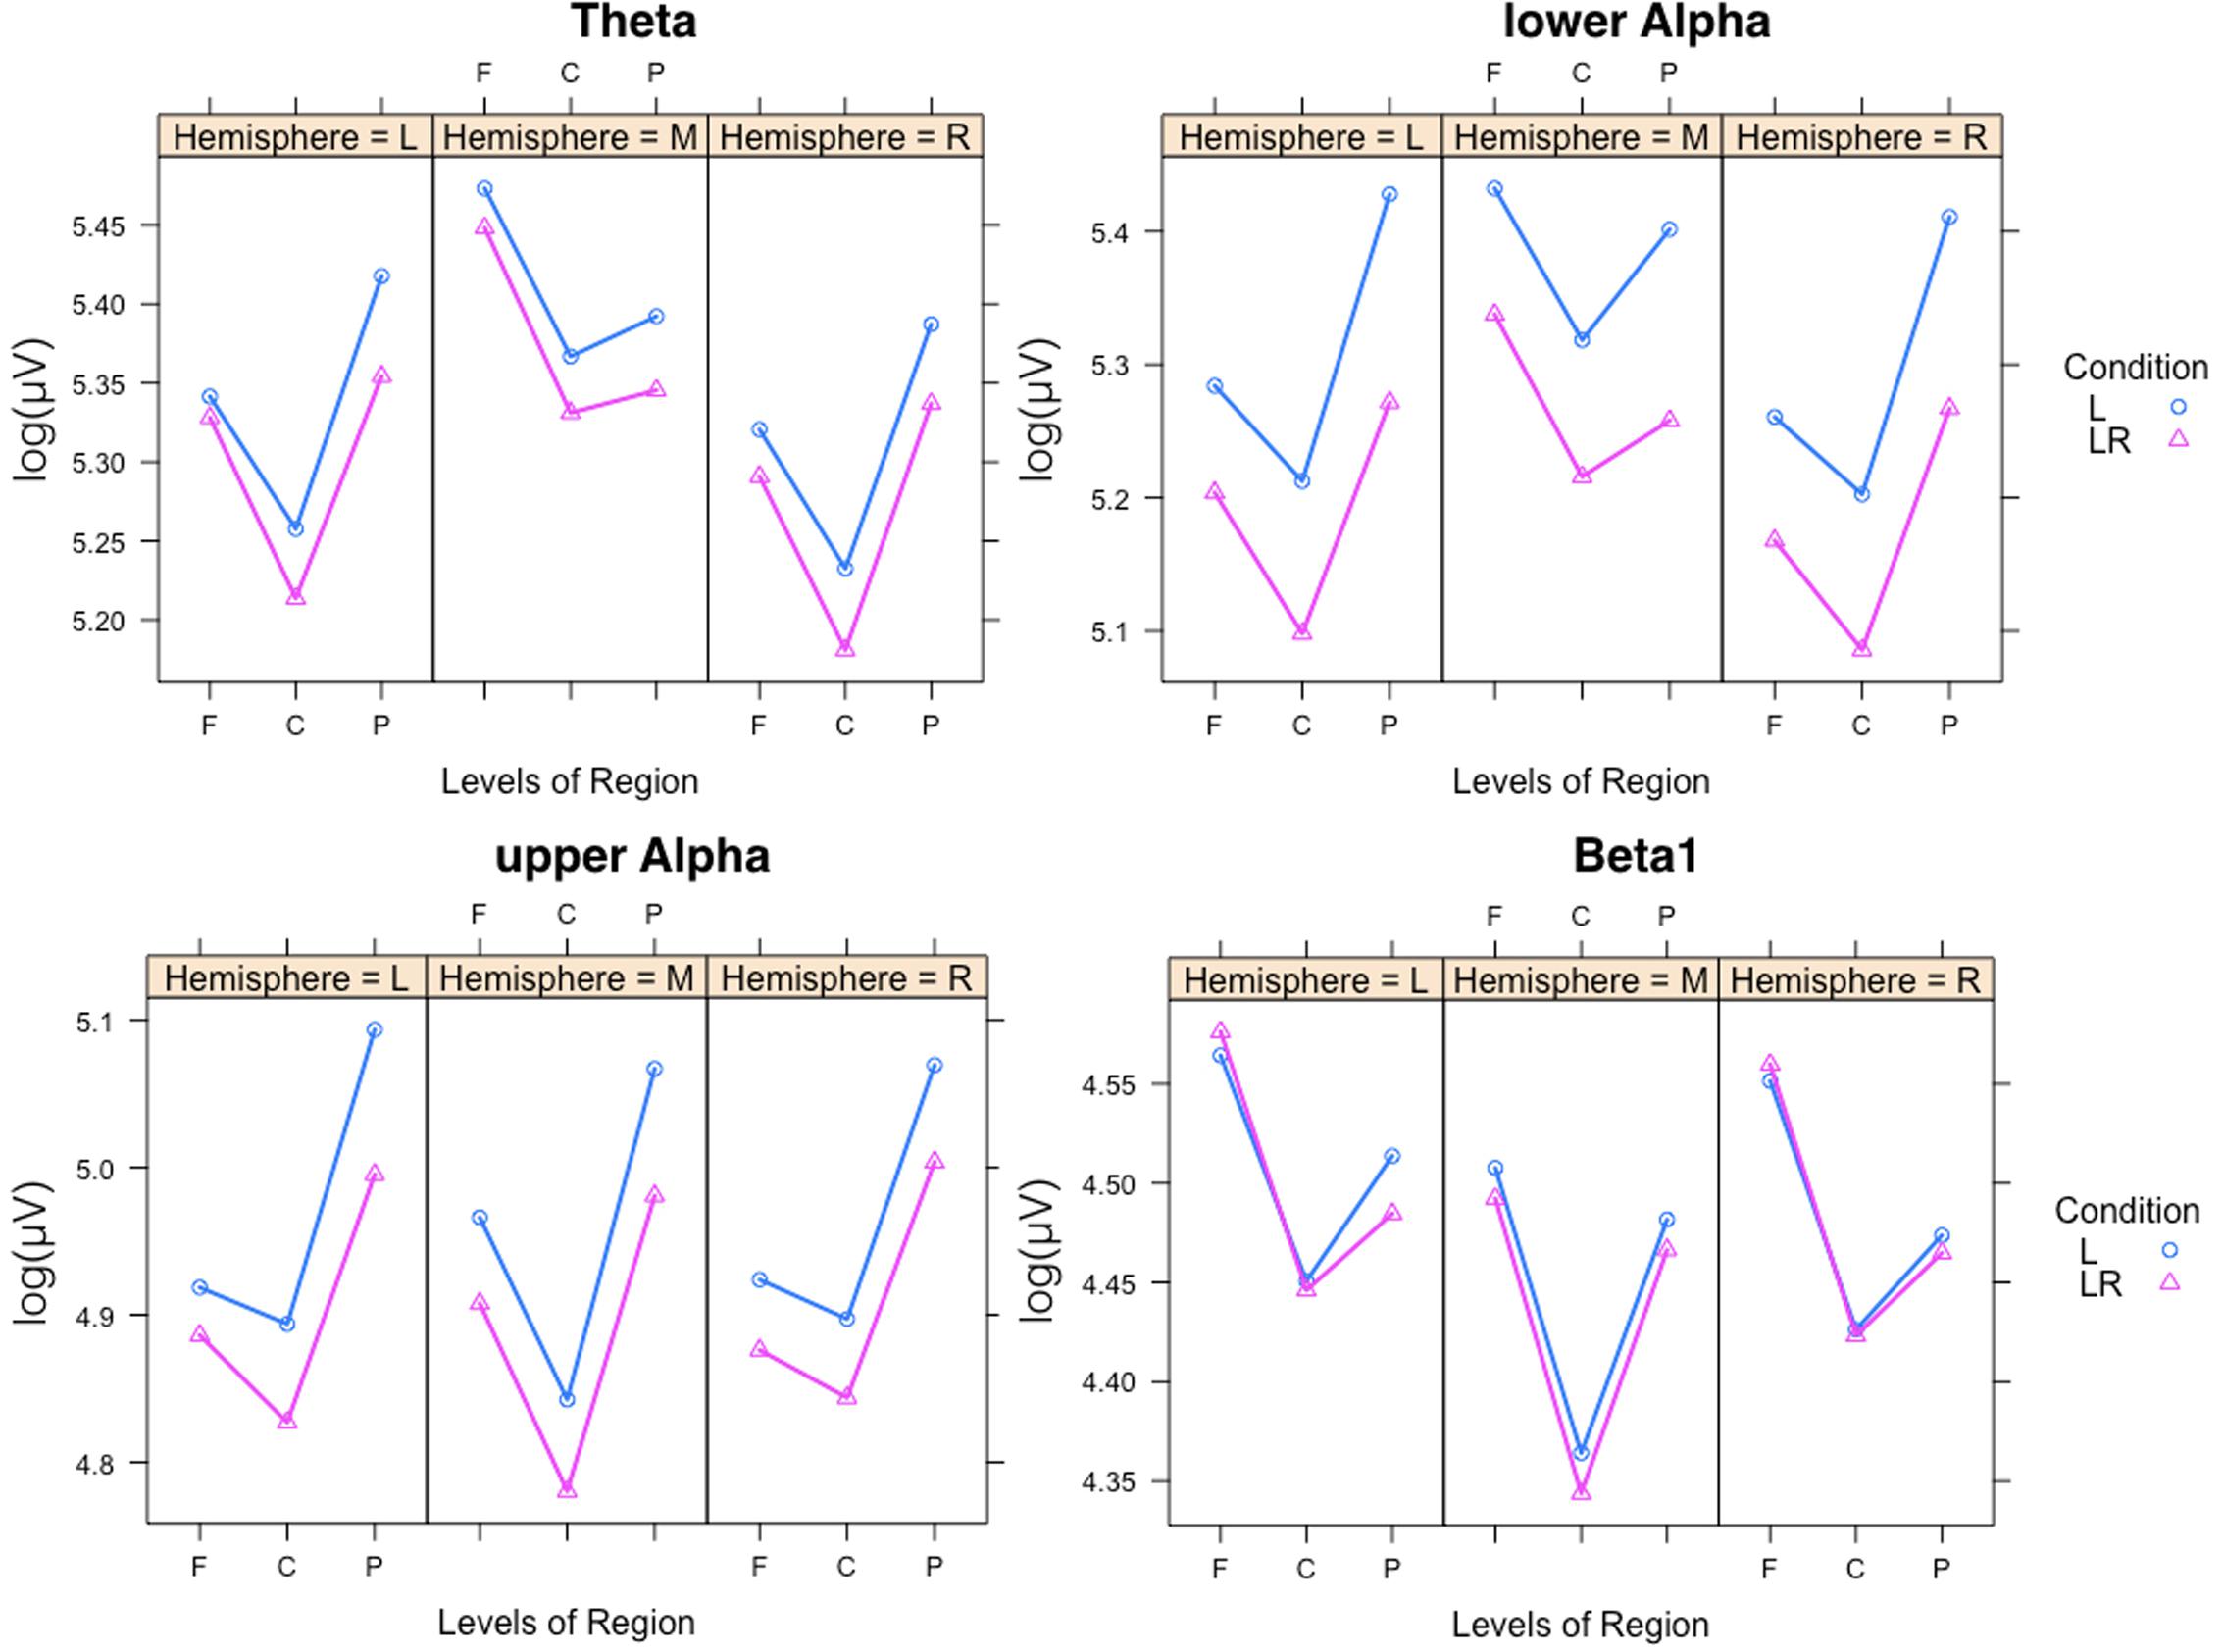
FIGURE 5. Significant three-way Condition × Hemisphere × Region interaction plots for the four frequency bands theta, lower alpha, upper alpha, and beta1. Abscissa depicting the different positions in the fronto-parietal direction (F = frontal, C = central, P = parietal). The colored lines indicate the different Conditions: L (blue) = Listening, LR (red) = Listening and Rating. The three panels of each figure depict the results for the left (L), middle (M), and right (R) part of the scalp.
In Figure 6 the intercorrelations between the power values of the different frequency bands are shown. As one can see from this Figure the correlations are generally strong with the strongest correlation between adjacently located frequency bands. This speaks for a general mechanism driving and/or modulating the power in the different frequency bands.
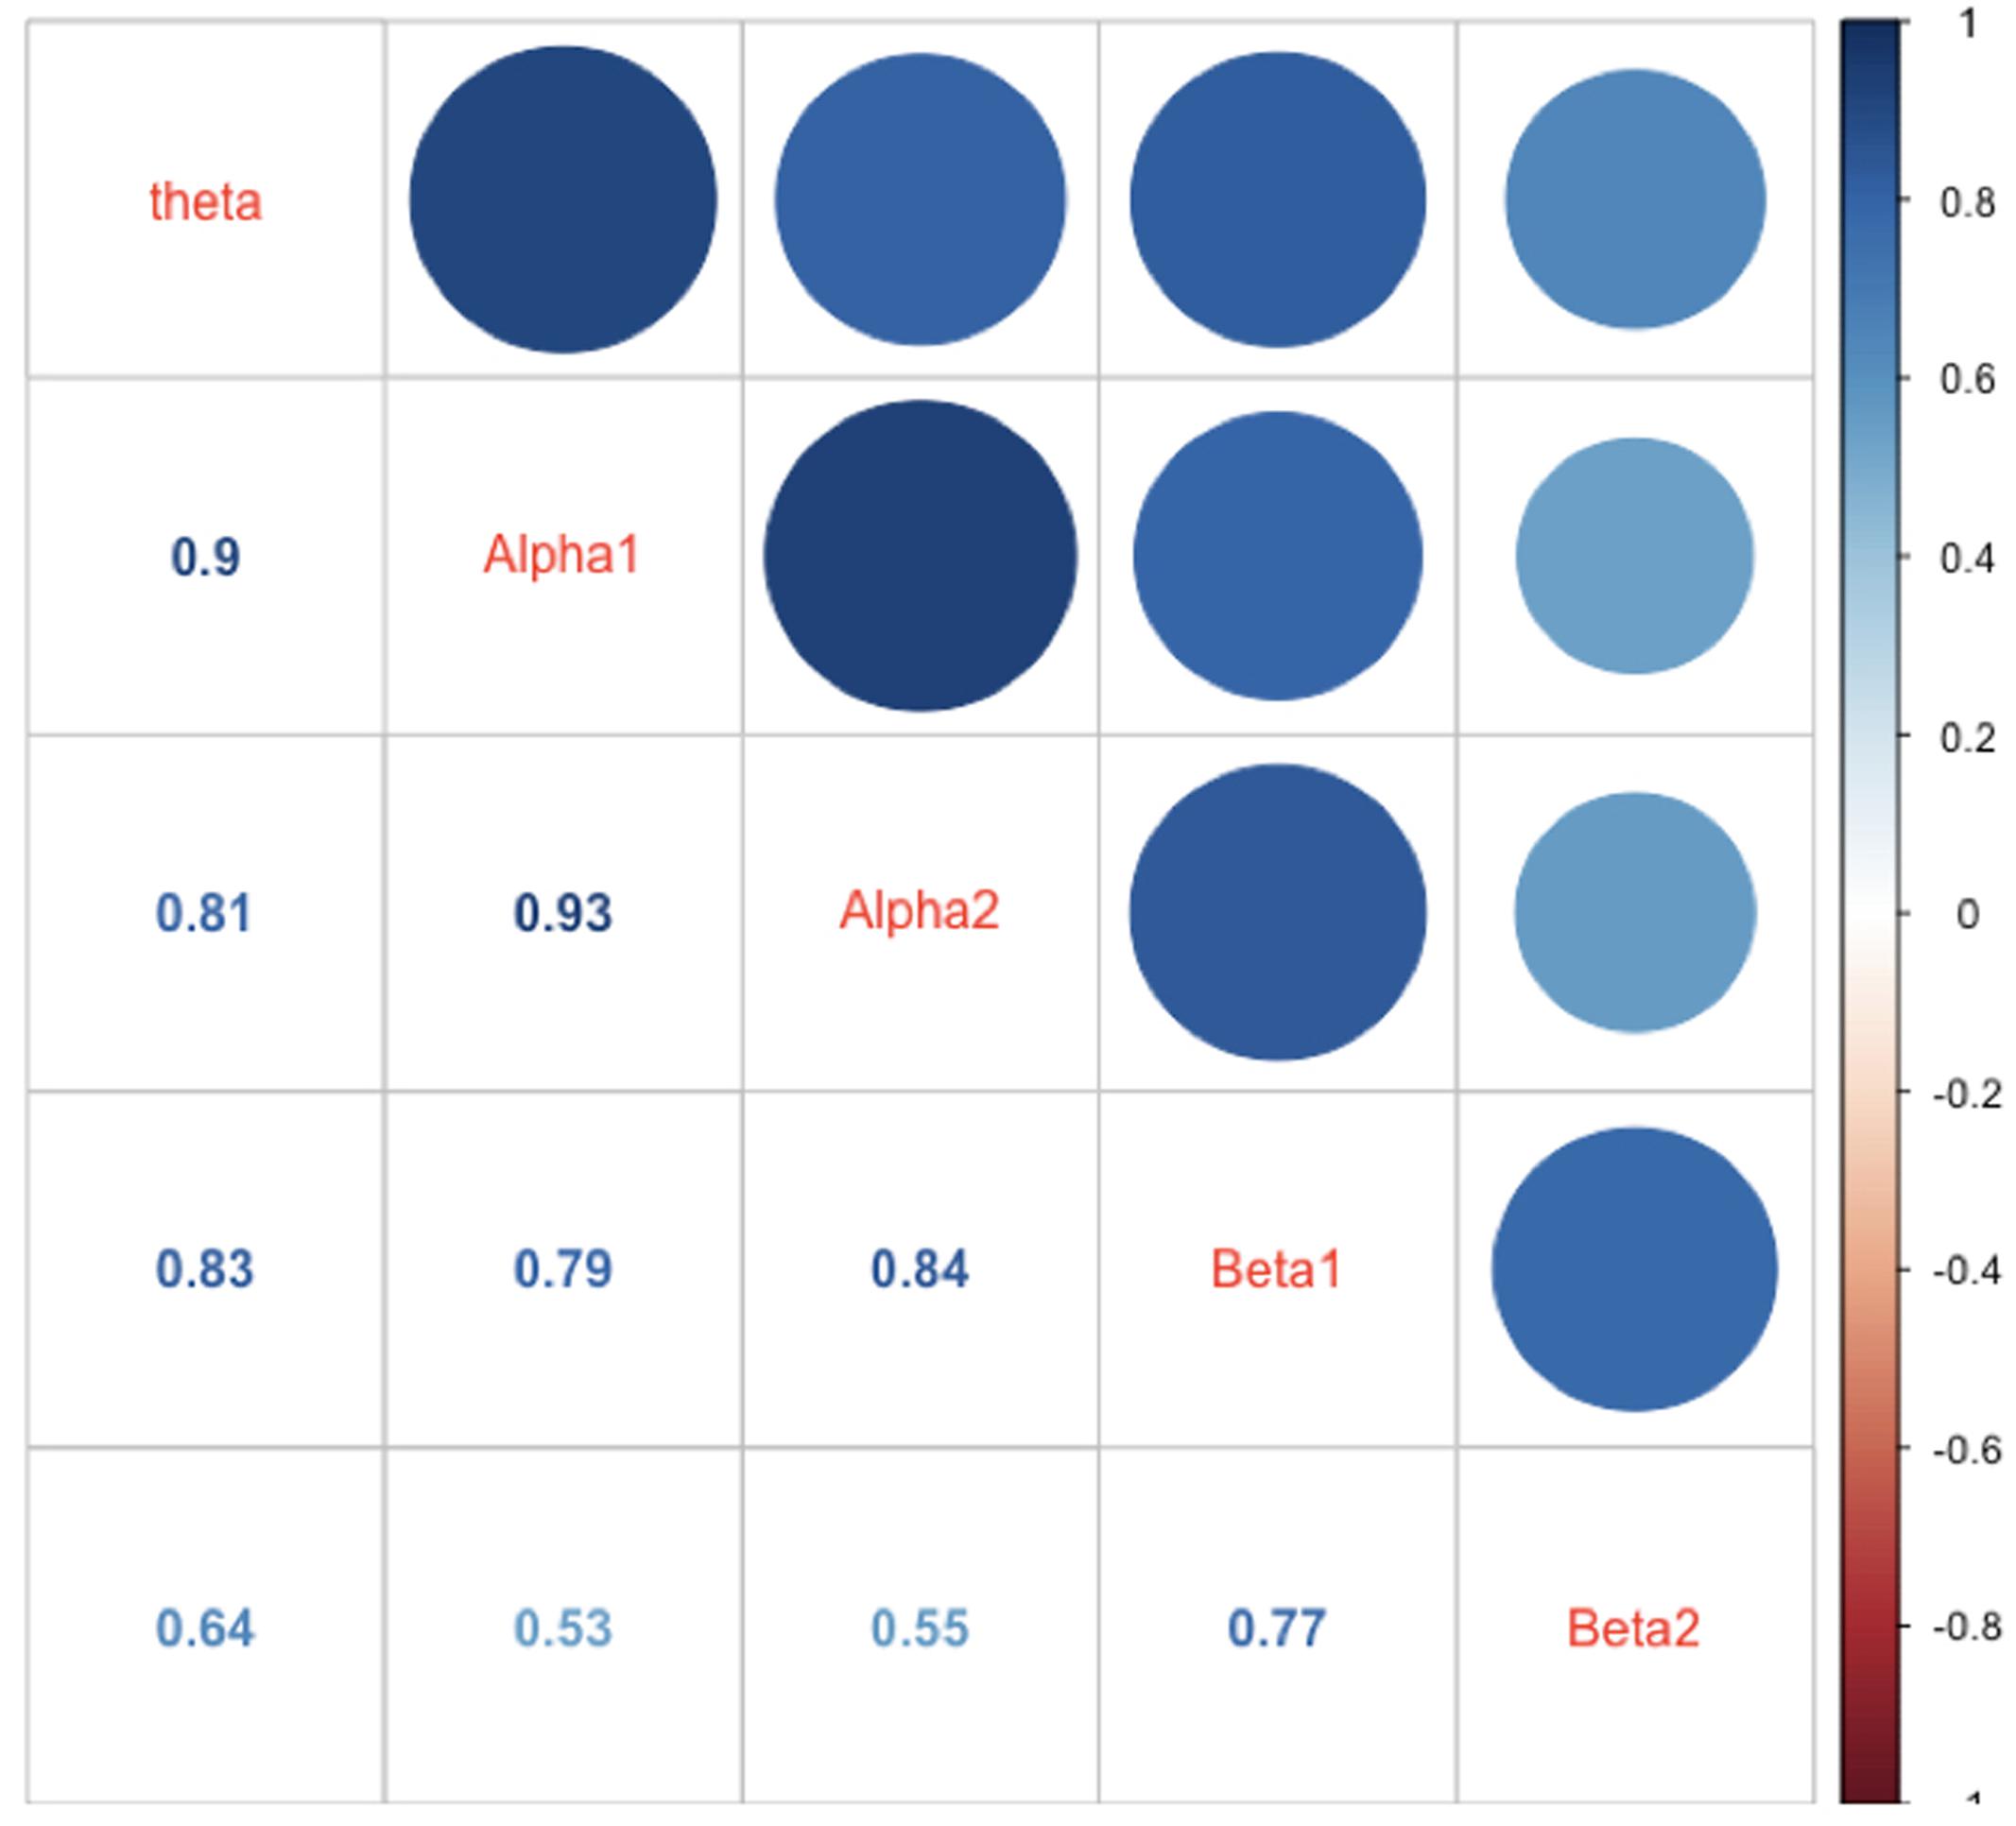
FIGURE 6. Correlations between mean power values of the different frequency bands. The correlations are represented as numbers, circles, and blue hue. The size of the circles as well as the saturation of the color indicates the size of the correlation (the larger the circle the larger the correlation, or the bluer the circle or the number the larger the correlations). The diagonal shows the name of the frequency bands.
Discussion
In this study, we show that passive unconstrained music listening (L condition) is associated with increased power values in all examined frequency bands (theta, lower alpha, upper alpha, lower beta, upper beta). However, this power increase was only apparent when the subjects followed the L condition first. Thus, after following the LR condition first and the L condition second, the subjects obviously did not listen to the music during the L condition in an unconstrained manner. They most likely applied the same (or similar) mental state as used during the LR condition when listening to the music in the L condition. Possibly, they implicitly rated the musical pieces although they are not required to do so.
We also observed HR increases during the L condition but HR decreases during the LR condition. HR decreases are often reported during the performance of long-lasting and partly boring tasks, while HR increases are generally observed during emotionally arousing situations (i.e., during passive listening of emotionally arousing music) (Koelsch and Jancke, 2015). We interpreted the HR increase during the L condition as emotional arousal, which is evoked by listening to positively valenced music. The HR decrease during the LR condition might indicate less emotional arousal. For the EDA measures, the findings are less clear, as we obtained only a marginally significant effect for the Group × Condition interaction. However, this marginally significant interaction fits the general findings of our study. The subjects who began with the L condition demonstrated decreased EDA responses (indicating less vegetative arousal) during the LR condition. Thus, simultaneous music listening and rating appears less emotionally arousing after unconstrained music listening. In summary, the findings for both vegetative measures may indicate that simultaneous listening and rating is associated (at least slightly) with less emotional/vegetative arousal.
Nevertheless, what is the functional meaning of our findings? An initial approach to interpreting our findings is interpreting the power in the EEG frequency bands as indicators of the activity of different cortical and subcortical networks. The best-elaborated frequency band in this context is the alpha band. Meanwhile, several studies support the notion that alpha band oscillations are strongly related to cortical inhibition, especially of task-irrelevant brain areas (Klimesch et al., 2007). It has also been argued that alpha band oscillations indicate a neurophysiological process during which the engaged neural networks need to maintain optimal neural activation. This is most likely realized by maintaining an optimal level of excitation–inhibition through the suppression of neural networks, which might “disturb” or “interfere” with the on-going processing of the relevant task. This is consistent with findings demonstrating strong alpha power increases during such processes, which are characterized by redirecting attention from external events to internal thoughts. Typical examples of such psychological processes are meditation (Aftanas and Golocheikine, 2001; Faber et al., 2012); effortful cognition, such as perception of degraded speech (Weisz et al., 2011); imagination (Cooper et al., 2003; Schaefer et al., 2011b); creative thinking (Benedek et al., 2011); working memory tasks (Klimesch, 1999; Palva and Palva, 2007); or during unconstrained music listening (Iwaki et al., 1997; Schaefer et al., 2011b; Jancke et al., 2015). Previously, we speculated that this could indicate a “dragging into the music” while simultaneously neglecting other stimuli or even thoughts (Jancke et al., 2015). Thus, subjects let their minds wander per the musical rhythm, harmonies, and/or melody. In a way, this is similar to what occurs during meditation or imagination, psychological states that are also accompanied by increased alpha band power.
Explaining the functional meaning of the other frequency bands during music listening is less easy and straightforward. In our study, we also identified an increase in theta band power. Increased theta band power has been associated with three psychological functions: (a) the so-called frontal midline theta (Fm theta), which is generally related to cognitive effort, working memory, and emotion processing (Gevins et al., 1997; Sammler et al., 2007; Maurer et al., 2015; Wisniewski et al., 2015); (b) the widespread theta most prominent at the frontal and parietal scalp locations, which is associated with low-level alertness, drowsiness, and “mind-wandering” (Braboszcz and Delorme, 2011; Platt and Riedel, 2011; Baumeister et al., 2012; Park et al., 2014; Poudel et al., 2014); and (c) the widespread theta with parietal dominance, which has been related to the effective encoding of new memories (Klimesch, 1999). Theta increases have also been reported during meditation (Lagopoulos et al., 2009; Baijal and Srinivasan, 2010; Faber et al., 2012). The theta band power increase in our study was more widespread but also with a strong power increase over frontal midline EOIs. The musical pieces used in our study were all positively evaluated, thus it is possible that the frontal midline theta power increases observed were due to positively valenced arousal, as in the study of Sammler et al. (2007). It is also possible that the subjects exerted more mental effort to perceive and process the musical pieces. However, we find this explanation implausible, as the LR condition is definitively more demanding than the L condition. Thus, we would anticipate a greater workload and therefore more frontal midline theta during the LR condition than during the L condition. As we have argued previously, it is more plausible that our subjects were “drawn into” the music, resulting in a state that shares some similarities with the “mind-wandering” state, a state during which theta increases have frequently been reported (Braboszcz and Delorme, 2011). Mind-wandering is characterized by the experience of one’s attention drifting from a task or from external matters toward internal, mostly personal, issues. Braboszcz and Delorme (2011) argue that mind-wandering is a form of low-alertness and low-concentration state of rest.
Increased beta power during unconstrained music listening is, on one hand, difficult to explain, as tonic beta band power increases are generally reported during conditions of increased tonic alertness. During the resting state, upper alpha and beta band power both positively correlate with tonic alertness network activity (Sadaghiani et al., 2010). Thus, it is possible that the subjects were tonically alert (but with a more internal direction of attention) during the L condition. Increased beta band power has also been reported during emotional processing (Sebastiani et al., 2003; Aftanas et al., 2006), which is consistent with the fact that the musical pieces we used are also emotionally arousing. Increases in beta oscillations have also been observed during the “minimally conscious state” (MCS; Schiff et al., 2014). This state is characterized by intermittent or inconsistent evidence of consciousness. Typical behavioral signs are intermittent or inconsistent responses to verbal commands, reduced verbal output or object use, as well as intermittent or inconsistent purposeful eye movements. In terms of the EEG pattern, MCS is characterized by a coupled increase in theta and beta oscillations, which is thought to indicate functional or structural deafferentation of the thalamus from its cortical inputs.
One striking finding is that the power values in all examined frequency bands in our study were highly intercorrelated, suggesting strong functional interplay between the frequency bands (see, for example, Steriade, 2006). One reason could be that the different cognitive processes and associated networks, and their specific frequency bands, are simultaneously or sequentially active. Thus, when calculating power values for the frequency bands across longer periods (as we have done), it is most likely that they correlated substantially during the experiment. A further possibility is that all other frequencies are “grouped” around the alpha band oscillation according to harmonic rules (Klimesch, 2012). It has been suggested that this so-called “harmonic coupling” provides an optimal basis for a functional interchange between two or more oscillatory systems (Klimesch, 2012). In addition, we also should take into account the fact that the definition of the frequency bands used in the present study is somewhat arbitrary (although we used a traditional frequency band definition that has been used in most EEG studies so far), especially considering the borders between adjacent frequency bands. Thus, it is most likely that some overlap and leakage between the adjacently located band borders caused spurious correlations between the frequency bands.
However, we propose a further possibility for explaining the general power increase in all examined frequency bands during the L condition. It is possible that the active networks are highly synchronized and are not disrupted by interfering psychological processes. Thus, they can synchronize without any disturbance because they do the same during the entire music-listening process. Consequently, all networks oscillate synchronically, resulting in generally increased power values in several frequency bands. In future studies and analyses, it would thus be interesting to study the functional network architecture and the associated coherences during music listening. Some first studies have shown changed (mostly increased) coherences during unconstrained music listening (e.g., Bhattacharya and Petsche, 2001).
Our most important finding, however, is that the pattern of brain activation during unconstrained and undisturbed music listening depends on whether the subjects had followed the L condition before or after the LR condition. The LR condition is a multitasking condition wherein subjects were required to listen to the music, evaluate their emotional feelings, transfer these feelings to reportable (verbal) categories, and to indicate these feelings with the appropriate motor output. These psychological functions obviously disrupt unconstrained music listening and the associated brain activations. As mentioned above, we speculate that during unconstrained music listening, the subjects employed increased internal attention, accompanied by reduced external attention, increased inhibition of brain networks uninvolved in generating this internal state, and a mind-wandering state. Thus, subjects engaged in the LR condition could not let their mind wander; rather, they had to focus their attention on the manipulandum with which they indicated their internal state. They also focused their attention on their feelings and on the processes necessary for transferring the feelings to reportable categories. These different processes would prevent the development of mind-wandering as in unconstrained music listening. Interestingly, when the subjects were confronted with this particular state, it was obviously not that easy to switch to the unconstrained listening style.
A possible limitation of our study is that we did not explicitly examine whether repeated exposure to the L and LR conditions (i.e., L → L and LR → LR) might have revealed similar or different results to the L → LR and/or LR → L conditions. However, we refrained from using these conditions in our experiment because: (1) Previously (Jancke et al., 2015), we showed that during repeated presentation of a musical piece, with the same listening context, the EEG and vegetative responses are strikingly similar across the repeated presentations. Thus, we are certain that the neurophysiological and vegetative responses would have been the same across the repeated presentation of the L and LR conditions. (2) Including the abovementioned conditions would have increased the duration of the entire experiment for each subject. As our plan was to study the neurophysiological and vegetative responses to musical pieces in an ecologically valid setting, we wanted to keep the subjects’ experimental load as low as possible. Nevertheless, we are confident that we have shown that the neurophysiological and vegetative reactions to musical pieces depends, at least partly, on the listening context.
Taken together, we show that the power in all examined frequency bands increases during the L condition, but only when subjects have not had previous experience with the LR condition. During the LR condition, the power values are all substantially lower. We interpret the association between unconstrained music listening and increased power in all examined frequency bands as a neural indicator of a mental state, which can best be described as a mind-wandering state, during which subjects are “drawn into the music.” Further studies are needed to delineate possible characteristic differences (if they exist) between what has typically been described as mind-wandering or meditation.
Author Contributions
LJ designed the experimental paradigm, performed the statistical analysis and drafted the manuscript. AM conducted the experiments, did the analysis of the EEG, vegetative, and behavioral data, and drafted the manuscript. JK designed the experimental paradigm, performed the statistical analysis and drafted the manuscript. All authors read and approved the final manuscript.
Conflict of Interest Statement
The authors declare that the research was conducted in the absence of any commercial or financial relationships that could be construed as a potential conflict of interest.
Acknowledgment
This research was supported by the Swiss National Foundation (SNF, Grant No. 320030B_138668 granted to LJ).
Supplementary Material
The Supplementary Material for this article can be found online at: https://www.frontiersin.org/article/10.3389/fnhum.2017.00342/full#supplementary-material
References
Aftanas, L. I., and Golocheikine, S. A. (2001). Human anterior and frontal midline theta and lower alpha reflect emotionally positive state and internalized attention: high-resolution EEG investigation of meditation. Neurosci. Lett. 310, 57–60. doi: 10.1016/S0304-3940(01)02094-8
Aftanas, L., Reva, N., Savotina, L., and Makhnev, V. (2006). Neurophysiological correlates of induced discrete emotions in humans: an individually oriented analysis. Neurosci. Behav. Physiol. 36, 119–130. doi: 10.1007/s11055-005-0170-6
Alluri, V., Toiviainen, P., Jääskeläinen, I., Glerean, E., Sams, M., and Brattico, E. (2012). Large-scale brain networks emerge from dynamic processing of musical timbre, key and rhythm. Neuroimage 59, 3677–3689. doi: 10.1016/j.neuroimage.2011.11.019
Altenmuller, E., Schurmann, K., Lim, V., and Parlitz, D. (2002). Hits to the left, flops to the right: different emotions during listening to music are reflected in cortical lateralisation patterns. Neuropsychologia 40, 2242–2256. doi: 10.1016/S0028-3932(02)00107-0
Baijal, S., and Srinivasan, N. (2010). Theta activity and meditative states: spectral changes during concentrative meditation. Cogn. Process 11, 31–38. doi: 10.1007/s10339-009-0272-0
Baumeister, J., Reinecke, K., Schubert, M., Schade, J., and Weiss, M. (2012). Effects of induced fatigue on brain activity during sensorimotor control. Eur. J. Appl. Physiol. 112, 2475–2482. doi: 10.1007/s00421-011-2215-6
Baumgartner, T., Esslen, M., and Jancke, L. (2006). From emotion perception to emotion experience: emotions evoked by pictures and classical music. Int. J. Psychophysiol. 60, 34–43. doi: 10.1016/j.ijpsycho.2005.04.007
Benedek, M., Bergner, S., Konen, T., Fink, A., and Neubauer, A. C. (2011). EEG alpha synchronization is related to top-down processing in convergent and divergent thinking. Neuropsychologia 49, 3505–3511. doi: 10.1016/j.neuropsychologia.2011.09.004
Bhattacharya, J., and Petsche, H. (2001). Universality in the brain while listening to music. Proc. Biol. Sci. 268, 2423–2433. doi: 10.1098/rspb.2001.1802
Bhattacharya, J., Petsche, H., and Pereda, E. (2001a). Interdependencies in the spontaneous EEG while listening to music. Int. J. Psychophysiol. 42, 287–301. doi: 10.1016/S0167-8760(01)00153-2
Bhattacharya, J., Petsche, H., and Pereda, E. (2001b). Long-range synchrony in the gamma band: role in music perception. J. Neurosci. 21, 6329–6337.
Borkenau, P., and Ostendorf, F. (1993). NEO-FFI NEO-Fünf-Faktoren Inventar nach Costa und McCrae. Göttingen: Hogrefe.
Braboszcz, C., and Delorme, A. (2011). Lost in thoughts: neural markers of low alertness during mind wandering. Neuroimage 54, 3040–3047. doi: 10.1016/j.neuroimage.2010.10.008
Britz, J., Van De Ville, D., and Michel, C. M. (2010). BOLD correlates of EEG topography reveal rapid resting-state network dynamics. Neuroimage 52, 1162–1170. doi: 10.1016/j.neuroimage.2010.02.052
Cooper, N. R., Croft, R. J., Dominey, S. J., Burgess, A. P., and Gruzelier, J. H. (2003). Paradox lost? Exploring the role of alpha oscillations during externally vs. internally directed attention and the implications for idling and inhibition hypotheses. Int. J. Psychophysiol. 47, 65–74. doi: 10.1016/S0167-8760(02)00107-1
Curran, T., and Dien, J. (2003). Differentiating amodal familiarity from modality-specific memory processes: an ERP study. Psychophysiology 40, 979–988. doi: 10.1111/1469-8986.00116
Delorme, A., Sejnowski, T., and Makeig, S. (2007). Enhanced detection of artifacts in EEG data using higher-order statistics and independent component analysis. Neuroimage 34, 1443–1449. doi: 10.1016/j.neuroimage.2006.11.004
Faber, P. L., Lehmann, D., Tei, S., Tsujiuchi, T., Kumano, H., Pascual-Marqui, R. D., et al. (2012). EEG source imaging during two Qigong meditations. Cogn. process. 13, 255–265. doi: 10.1007/s10339-012-0441-4
Gevins, A., Smith, M., McEvoy, L., and Yu, D. (1997). High-resolution EEG mapping of cortical activation related to working memory: effects of task difficulty, type of processing, and practice. Cereb. Cortex 7, 374–385. doi: 10.1093/cercor/7.4.374
Grahn, J., and Rowe, J. (2009). Feeling the beat: premotor and striatal interactions in musicians and nonmusicians during beat perception. J. Neurosci. 29, 7540–7548. doi: 10.1523/JNEUROSCI.2018-08.2009
Heinrich, A., Szostek, A., Meyer, P., Reinhard, I., Gilles, M., Paslakis, G., et al. (2014). Women are more strongly affected by dizziness in static magnetic fields of magnetic resonance imaging scanners. Neuroreport 25, 1081–1084. doi: 10.1097/WNR.0000000000000225
Herrmann, C. S., Oertel, U., Wang, Y., Maess, B., and Friederici, A. D. (2000). Noise affects auditory and linguistic processing differently: an MEG study. Neuroreport 11, 227–229. doi: 10.1097/00001756-200002070-00001
Hirata, Y., Kuriki, S., and Pantev, C. (1999). Musicians with absolute pitch show distinct neural activities in the auditory cortex. Neuroreport 10, 999–1002. doi: 10.1097/00001756-199904060-00019
Hutcherson, C., Goldin, P., Ochsner, K., Gabrieli, J., Barrett, L., and Gross, J. (2005). Attention and emotion: does rating emotion alter neural responses to amusing and sad films? Neuroimage 27, 656–668. doi: 10.1016/j.neuroimage.2005.04.028
Istók, E., Friberg, A., Huotilainen, M., and Tervaniemi, M. (2013). Expressive timing facilitates the neural processing of phrase boundaries in music: evidence from event-related potentials. PLoS ONE 8:e55150. doi: 10.1371/journal.pone.0055150
Iwaki, T., Hayashi, M., and Hori, T. (1997). Changes in alpha band EEG activity in the frontal area after stimulation with music of different affective content. Percept. Mot. Skills 84, 515–526. doi: 10.2466/pms.1997.84.2.515
Jäncke, L. (2008). Macht Musik Schlau? Neue Erkenntnisse aus den Kognitiven Neurowissenschaften und der Kognitiven Psychologie. Bern: Huber-Verlag.
Jancke, L., and Alahmadi, N. (2016). Detection of independent functional networks during music listening using electroencephalogram and sLORETA-ICA. Neuroreport 27, 455–461. doi: 10.1097/WNR.0000000000000563
Jancke, L., Kuhnis, J., Rogenmoser, L., and Elmer, S. (2015). Time course of EEG oscillations during repeated listening of a well-known aria. Front. Hum. Neurosci. 9:401. doi: 10.3389/fnhum.2015.00401
Jaušovec, N., and Habe, K. (2005). The influence of Mozart’s Sonata K. 448 on brain activity during the performance of spatial rotation and numerical tasks. Brain Topogr. 17, 207–218. doi: 10.1007/s10548-005-6030-4
Jausovec, N., Jausovec, K., and Gerlic, I. (2006). The influence of Mozart’s music on brain activity in the process of learning. Clin. Neurophysiol. 117, 2703–2714. doi: 10.1016/j.clinph.2006.08.010
Keulers, E., Stiers, P., Nicolson, N., and Jolles, J. (2014). The association between cortisol and the BOLD response in male adolescents undergoing fMRI. Brain Res. 1598, 1–11. doi: 10.1016/j.brainres.2014.12.022
Klimesch, W. (1999). EEG alpha and theta oscillations reflect cognitive and memory performance: a review and analysis. Brain Res. Rev. 29, 169–195. doi: 10.1016/S0165-0173(98)00056-3
Klimesch, W. (2012). Alpha-band oscillations, attention, and controlled access to stored information. Trends Cogn. Sci. 16, 606–617. doi: 10.1016/j.tics.2012.10.007
Klimesch, W., Sauseng, P., and Hanslmayr, S. (2007). EEG alpha oscillations: the inhibition-timing hypothesis. Brain Res. Rev. 53, 63–88. doi: 10.1016/j.brainresrev.2006.06.003
Koelsch, S. (2009). Music-syntactic processing and auditory memory: similarities and differences between ERAN and MMN. Psychophysiology 46, 179–190. doi: 10.1111/j.1469-8986.2008.00752.x
Koelsch, S., and Jancke, L. (2015). Music and the heart. Eur. Heart J. 36, 3043–3049. doi: 10.1093/eurheartj/ehv430
Kupfer, J., Brosig, B., and Brähler, E. (2001). Toronto-Alexithymie-Skala-26. Göttingen: Hogrefe-Verlag.
Lagopoulos, J., Xu, J., Rasmussen, I., Vik, A., Malhi, G., Eliassen, C., et al. (2009). Increased theta and alpha EEG activity during nondirective meditation. J. Altern. Complement. Med. 15, 1187–1192. doi: 10.1089/acm.2009.0113
Lehrl, S., Gallwitz, A., Blaha, L., and Fischer, B. (1992). Geistige Leistungsfähigkeit - Theorie und Messung der Biologischen Intelligenz mit dem Kurztest KAI. Ebersberg: Vless.
Lehrl, S., Merz, J., Erzigkeit, H., and Galster, V. (1974). [MWT-A–a repeatable intelligence short-test, fairly independent from psycho-mental disorders]. Nervenarzt 45, 364–369.
Lin, Y. P., Wang, C. H., Jung, T. P., Wu, T. L., Jeng, S. K., Duann, J. R., et al. (2010). EEG-based emotion recognition in music listening. IEEE Trans. Biomed. Eng. 57, 1798–1806. doi: 10.1109/TBME.2010.2048568
Mas-Herrero, E., Marco-Pallares, J., Lorenzo-Seva, U., Zatorre, R. J., and Rodriguez-Fornells, A. (2013). Individual differences in music reward experiences. Music Percept. 31, 118–138. doi: 10.1525/Mp.2013.31.2.118
Maurer, U., Brem, S., Liechti, M., Maurizio, S., Michels, L., and Brandeis, D. (2015). Frontal midline theta reflects individual task performance in a working memory task. Brain Topogr. 28, 127–134. doi: 10.1007/s10548-014-0361-y
Meyer, M., Baumann, S., and Jancke, L. (2006). Electrical brain imaging reveals spatio-temporal dynamics of timbre perception in humans. Neuroimage 32, 1510–1523. doi: 10.1016/j.neuroimage.2006.04.193
Mikutta, C., Altorfer, A., Strik, W., and Koenig, T. (2012). Emotions, arousal, and frontal alpha rhythm asymmetry during Beethoven’s 5th symphony. Brain Topogr. 25, 423–430. doi: 10.1007/s10548-012-0227-0
Mikutta, C., Maissen, G., Altorfer, A., Strik, W., and Koenig, T. (2014). Professional musicians listen differently to music. Neuroscience 268, 102–111. doi: 10.1016/j.neuroscience.2014.03.007
Mikutta, C. A., Schwab, S., Niederhauser, S., Wuermle, O., Strik, W., and Altorfer, A. (2013). Music, perceived arousal, and intensity: psychophysiological reactions to Chopin’s “Tristesse”. Psychophysiology 50, 909–919. doi: 10.1111/psyp.12071
Mutschler, I., Wieckhorst, B., Meyer, A., Schweizer, T., Klarhofer, M., Wilhelm, F., et al. (2014). Who gets afraid in the MRI-scanner? Neurogenetics of state-anxiety changes during an fMRI experiment. Neurosci. Lett. 583, 81–86. doi: 10.1016/j.neulet.2014.09.021
Novitski, N., Maess, B., and Tervaniemi, M. (2006). Frequency specific impairment of automatic pitch change detection by fMRI acoustic noise: an MEG study. J. Neurosci. Methods 155, 149–159. doi: 10.1016/j.jneumeth.2006.01.030
Oldfield, R. C. (1971). The assessment and analysis of handedness: the edinburgh inventory. Neuropsychologia 9, 97–113. doi: 10.1016/0028-3932(71)90067-4
Palva, S., and Palva, J. (2007). New vistas for alpha-frequency band oscillations. Trends Neurosci. 30, 150–158. doi: 10.1016/j.tins.2007.02.001
Park, H., Lee, D., Kang, E., Kang, H., Hahm, J., Kim, J., et al. (2014). Blocking of irrelevant memories by posterior alpha activity boosts memory encoding. Hum. Brain Mapp. 35, 3972–3987. doi: 10.1002/hbm.22452
Passynkova, N., Sander, K., and Scheich, H. (2005). Left auditory cortex specialization for vertical harmonic structure of chords. Ann. N. Y. Acad. Sci. 1060, 454–456. doi: 10.1196/annals.1360.048
Peterson, D., and Thaut, M. (2007). Music increases frontal EEG coherence during verbal learning. Neurosci. Lett. 412, 217–221. doi: 10.1016/j.neulet.2006.10.057
Petsche, H., Richter, P., and Stein, A. V. (1993). EEG coherence and musical thinking. Music Percept. 11, 117–151. doi: 10.2307/40285613
Platt, B., and Riedel, G. (2011). The cholinergic system, EEG and sleep. Behav. Brain Res. 221, 499–504. doi: 10.1016/j.bbr.2011.01.017
Poudel, G., Innes, C., Bones, P., Watts, R., and Jones, R. (2014). Losing the struggle to stay awake: divergent thalamic and cortical activity during microsleeps. Hum. Brain Mapp. 35, 257–269. doi: 10.1002/hbm.22178
Rogenmoser, L., Zollinger, N., Elmer, S., and Jäncke, L. (2016). Independent component processes underlying emotions during natural music listening. Soc. Cogn. Affect. Neurosci. 11, 1428–1439. doi: 10.1093/scan/nsw048
Sadaghiani, S., Scheeringa, R., Lehongre, K., Morillon, B., Giraud, A., and Kleinschmidt, A. (2010). Intrinsic connectivity networks, alpha oscillations, and tonic alertness: a simultaneous electroencephalography/functional magnetic resonance imaging study. J. Neurosci. 30, 10243–10250. doi: 10.1523/JNEUROSCI.1004-10.2010
Sammler, D., Grigutsch, M., Fritz, T., and Koelsch, S. (2007). Music and emotion: electrophysiological correlates of the processing of pleasant and unpleasant music. Psychophysiology 44, 293–304. doi: 10.1111/j.1469-8986.2007.00497.x
Sarnthein, J., vonStein, A., Rappelsberger, P., Petsche, H., Rauscher, F. H., and Shaw, G. L. (1997). Persistent patterns of brain activity: an EEG coherence study of the positive effect of music on spatial-temporal reasoning. Neurol. Res. 19, 107–116. doi: 10.1080/01616412.1997.11740782
Satoh, M., Takeda, K., Nagata, K., Shimosegawa, E., and Kuzuhara, S. (2006). Positron-emission tomography of brain regions activated by recognition of familiar music. AJNR Am. J. Neuroradiol. 27, 1101–1106.
Schaal, N., Williamson, V., Kelly, M., Muggleton, N., Pollok, B., Krause, V., et al. (2015). A causal involvement of the left supramarginal gyrus during the retention of musical pitches. Cortex 64, 310–317. doi: 10.1016/j.cortex.2014.11.011
Schaefer, R., Desain, P., and Farquhar, J. (2013). Shared processing of perception and imagery of music in decomposed EEG. Neuroimage 70, 317–326. doi: 10.1016/j.neuroimage.2012.12.064
Schaefer, R., Desain, P., and Suppes, P. (2009). Structural decomposition of EEG signatures of melodic processing. Biol. Psychol. 82, 253–259. doi: 10.1016/j.biopsycho.2009.08.004
Schaefer, R., Farquhar, J., Blokland, Y., Sadakata, M., and Desain, P. (2011a). Name that tune: decoding music from the listening brain. Neuroimage 56, 843–849. doi: 10.1016/j.neuroimage.2010.05.084
Schaefer, R., Vlek, R., and Desain, P. (2011b). Music perception and imagery in EEG: alpha band effects of task and stimulus. Int. J. Psychophysiol. 82, 254–259. doi: 10.1016/j.ijpsycho.2011.09.007
Schiff, N., Nauvel, T., and Victor, J. (2014). Large-scale brain dynamics in disorders of consciousness. Curr. Opin. Neurobiol. 25, 7–14. doi: 10.1016/j.conb.2013.10.007
Sebastiani, L., Simoni, A., Gemignani, A., Ghelarducci, B., and Santarcangelo, E. (2003). Autonomic and EEG correlates of emotional imagery in subjects with different hypnotic susceptibility. Brain Res. Bull. 60, 151–160. doi: 10.1016/S0361-9230(03)00025-X
Singmann, H., Bolker, B., Westfall, J., and Aust, F. (2016). afex: Analysis of Factorial Experiments. R Package Version 0.16-1. Available at: https://cran.r-project.org/package=afex
Steriade, M. (2006). Grouping of brain rhythms in corticothalamic systems. Neuroscience 137, 1087–1106. doi: 10.1016/j.neuroscience.2005.10.029
Tervaniemi, M., Sannemann, C., Noyranen, M., Salonen, J., and Pihko, E. (2011). Importance of the left auditory areas in chord discrimination in music experts as demonstrated by MEG. Eur. J. Neurosci. 34, 517–523. doi: 10.1111/j.1460-9568.2011.07765.x
Trost, W., Frühholz, S., Cochrane, T., Cojan, Y., and Vuilleumier, P. (2015). Temporal dynamics of musical emotions examined through intersubject synchrony of brain activity. Soc. Cogn. Affect. Neurosci. 10, 1705–1721. doi: 10.1093/scan/nsv060
Tsang, C. D., Trainor, L. J., Santesso, D. L., Tasker, S. L., and Schmidt, L. A. (2001). Frontal EEG responses as a function of affective musical features. Ann. N. Y. Acad. Sci. 930, 439–442. doi: 10.1111/j.1749-6632.2001.tb05764.x
Van de Ville, D., Britz, J., and Michel, C. M. (2010). EEG microstate sequences in healthy humans at rest reveal scale-free dynamics. Proc. Natl. Acad. Sci. U.S.A. 107, 18179–18184. doi: 10.1073/pnas.1007841107
Virtala, P., and Tervaniemi, M. (2017). Neurocognition of major-minor and consonance-dissonance. Music Percept. 34, 387–404. doi: 10.1525/mp.2017.34.4.387
Weisz, N., Hartmann, T., Muller, N., Lorenz, I., and Obleser, J. (2011). Alpha rhythms in audition: cognitive and clinical perspectives. Front. Psychol. 2:73. doi: 10.3389/fpsyg.2011.00073
Wisniewski, M. G., Thompson, E. R., Iyer, N., Estepp, J. R., Goder-Reiser, M. N., and Sullivan, S. C. (2015). Frontal midline theta power as an index of listening effort. Neuroreport 26, 94–99. doi: 10.1097/WNR.0000000000000306
Keywords: EEG oscillation, music, heart rate, electrodermal response, music listening, EEG, music rating
Citation: Markovic A, Kühnis J and Jäncke L (2017) Task Context Influences Brain Activation during Music Listening. Front. Hum. Neurosci. 11:342. doi: 10.3389/fnhum.2017.00342
Received: 08 April 2017; Accepted: 13 June 2017;
Published: 29 June 2017.
Edited by:
Klaus Gramann, Technische Universität Berlin, GermanyReviewed by:
Roel M. Willems, Radboud University Nijmegen, NetherlandsMari Tervaniemi, University of Helsinki, Finland
Copyright © 2017 Markovic, Kühnis and Jäncke. This is an open-access article distributed under the terms of the Creative Commons Attribution License (CC BY). The use, distribution or reproduction in other forums is permitted, provided the original author(s) or licensor are credited and that the original publication in this journal is cited, in accordance with accepted academic practice. No use, distribution or reproduction is permitted which does not comply with these terms.
*Correspondence: Lutz Jäncke, lutz.jaencke@uzh.ch;, l.jaencke@psychologie.uzh.ch