 Katja Petrowski1,2
 Elmar Brähler
 Bjarne Schmalbach
- 1Medical Psychology and Medical Sociology, University Medical Center of the Johannes Gutenberg-University, Mainz, Germany
- 2Department of Internal Medicine III, University Medical Center Carl Gustav Carus at the University of Dresden, Dresden, Germany
- 3Schussental Clinic, Clinic for Psychosomatic Medicine and Psychotherapy, Aulendorf, Germany
- 4Faculty of Applied Human Studies, University of Applied Sciences Magdeburg and Stendal, Stendal, Germany
- 5Integrated Research and Treatment Center (IFB) AdiposityDiseases - Behavioral Medicine, Psychosomatic Medicine and Psychotherapy, University of Leipzig Medical Center, Leipzig, Germany
- 6Department of Psychosomatic Medicine and Psychotherapy, University Medical Center of the Johannes Gutenberg-University, Mainz, Germany
The present study was conducted with the aim of constructing and validating a short form of the Profile of Mood States (POMS). The POMS is a widely-applied measure for the assessment of an individual's mood. Thus, it is of great relevance for many research questions in clinical and social psychology. To develop the short scale, we first examined psychometric properties and found the optimal 16-item solution among all valid combinations of the full POMS in an exploratory subsample (n = 1,029) of our complete representative sample of the German general population. We then validated this model in a confirmatory subsample (n = 977). Additionally, we examined its invariance across age groups and sex, as well as its reliability. Our results indicate that the POMS-16 is a valid and reliable measure of mood states with minimal losses compared to the 35-item version. Particularly where brevity and an economical assessment is desired, the POMS-16 should be considered.
Introduction
The questionnaire “Profile of Mood States” (POMS; McNair et al., 1992) is a widely used questionnaire in the clinical field when examining psychotherapeutic, psychological and somatic questions, but also in pharmacological, occupational, and sports medicine studies to record the state of mind. In a wide variety of medical subjects, additionally, the POMS is used to examine groups of patients, e.g., patients with cataract (Pesudovs et al., 2003), with sleep apnea syndrome (Bardwell et al., 2003), with epilepsy (von Steinbüchel et al., 1994; Szaflarski et al., 2003), or with heart surgery (Gross, 1991). Especially in the (psycho) oncological area, it is used to measure the general stress on patients (Dilorenzo et al., 1999), but also the quality of life (e.g., Baker et al., 2002) and to evaluate the effects of interventions (e.g., Classen et al., 2001; Hosaka et al., 2001; Grulke et al., 2004). These application areas are consistent with the seven areas of application of the POMS described in the manual by the authors McNair et al. (1992): psychotherapeutic and pharmacological studies, cancer and addiction research, research on emotions as well as in sports psychology.
The American original version (McNair et al., 1971, 1992) contains 65 items that are answered on a 5-point scale (“0 = not at all” to “4 = very strong”) for the period of the “past week, including today” which belong to following scales: Depression, Tension-Anxiety, Anger-Hostility, Fatigue-Inertia, Vigor-Activity, and Confusion-Bewilderment. The Total Mood Disturbance Scale is formed by subtracting the (positive) value of the Vigor scale from the sum of the remaining five scales. For the six scales, the coefficients for the internal consistencies range between 0.90 and 0.94 and the retest reliabilities (median 20 days apart) between 0.65 and 0.74 for samples of psychiatric patients (McNair et al., 1992, p. 7). Gibson reports similar values for a non-clinical sample of 60- to 98-year-olds (Gibson, 1997), with the retest reliabilities being higher at a 1-week interval (0.68–0.83) than in McNair et al. (1992). However, the POMS is also used in variants with a 7-step answer scale for each item and an alternative recording period such as “How did you feel today?” (vs. last week including today) e.g., by Gibson (1997).
Concerning the instructions, the requests “How have you felt during the past week including today?” and “How do you feel right now?” are the most commonly used in the POMS. McNair et al. (1992) chose the reference to the past week since they considered this was a long enough period to capture people's typical and persistent emotional reactions to daily life events, yet short enough to assess the acute effects of a treatment. McNair et al. replicated the original structure by using the “right now” instruction in a one factor analysis (McNair et al., 1992). Some researchers have examined the consequences of switching reference times in mood assessment. According to Watson (1988), the structure of positive and negative affect factors emerged regardless of the time frame rated. However, the scope of the reference period will affect an individual's perception of intensity, as well as of seriousness and frequency of the episode under evaluation (Watson, 1988; Schaeffer and Presser, 2003). In the Anglo-Saxon context the scores obtained on the “past week” instruction were higher than the average scores obtained in multiple “right now” assessments (Terry et al., 2005). Recall of mood appeared to be influenced by mood at the time of recall and possible significant events. So, Terry et al., 2005 suggested that the “right now” response time frame should be the method of choice.
Concerning the factorial structure, a conceptual schema underlying the POMS describes the effect of mood states on performance based on the interactions among the POMS' factor scores (Lane and Terry, 2000). This theoretical model emphasized the relationships of depressed mood state with other unpleasant states, particularly tension, and anger. Furthermore, the internal structure of the POMS seems relatively established, with the exception of the Confusion factor (Netz et al., 2005; Morfeld et al., 2007; Bourgeois et al., 2012), which was regarded as a cognitive state (Lane et al., 2007). Moreover, despite the limited range of pleasant mood states covered, for the aforementioned reasons, few adaptations retained the component of Friendliness (Andrade et al., 2010).
Previous research (Watson, 1988; Winkielman et al., 1998; Terry et al., 1999, 2005) has identified additional factors (e.g., diverse mood state descriptors, response formats, or circumstances of assessment) that could affect the understanding and comparability of the mood state responses. Of all the potential modulators, one variable stands out: the circumstances of mood state assessment, i.e., the conditions of time and place under which the mood state response is registered. In this respect, the POMS questionnaire has been administered before and after competition, and outside the competition context (Terry et al., 1999, 2003). Both the type of instruction and the circumstances of administration of the test are important measurement elements. In addition, the invariance of mood scores should be examined and taken into account when interpreting individual and group mood state assessments (Andrade and Rodríguez, 2018).
Besides various translations into Spanish (Andrade et al., 2013), Turkish (Selvi et al., 2011), Arabic (Aroian et al., 2007), Hebru (Netz et al., 2005), and cross-cultural analyses (Yeun and Shin-Park, 2006), various English short forms have been proposed. Cella et al. (1987) developed a version with 11 items as a Total Mood Disturbance without subscales. Shacham (1983) developed a version with 37 items that form six scales. This short version was used in various samples by Curran et al. (1995) and Dilorenzo et al. (1999) with similar good test parameters as for the long form. Baker et al. (2002) were able to confirm the factor structure. In addition, the authors of the original instrument also developed a short form with 30 items that show the same six scales as the long form (McNair et al., 1992).
The German short version by Biehl et al. (1986) consists of 35 items with four scales: dejection/anxiety (14 items), fatigue (seven items), vigor (seven items), and anger (seven items). Similar to the different English versions the German items were answered on a 5- vs. 7-step response and evaluated for different periods “the last 24 h” vs. “the last week including today.” For this German version, satisfactory psychometric properties (internal consistency coefficients of the subscales from a = 0.88 to 0.94) with satisfactory factorial validity were reported based on a student sample (Bullinger et al., 1990; Gross, 1991). For the inter-scale-correlations, mean correlation coefficients of r = 0.45 (0.44 – 0.65) were determined.
Since the psychometric properties were obtained in a student sample the POMS was implemented in a representative general population sample. Herein, satisfactory internal consistencies between r = 0.89 and 0.95 were observed. The factorial structure, however, was only with limited satisfactory (Albani et al., 2005).
Since the factorial structure was only limited satisfactory in a representative large sample, an item selection for a good factorial structure has to be implemented in order to improve the factorial structure. Furthermore, for epidemiological studies short instruments with good psychometric properties are important in order to avoid exhaustion, resistance and boredom. These are important steps in order to be able to use this instrument in large epidemiological longitudinal studies and to get high quality data. In addition, it would be of interest how many items are necessary in order to evaluate the mood construct. Therefore, the aim of our investigation was to empirically identify a short version of the POMS with very good psychometric properties and a good factorial structure of the instrument in a representative population sample.
Method
The present study was part of a national representative survey of the general population of Germany. Data were collected by an independent institute for opinion and social research (USUMA, Berlin). The criteria for inclusion were a minimum age of 14 and sufficient ability to understand the written German language. After a socio-demographic interview, the participants completed self-report questionnaires regarding physical and psychological symptoms in the presence of (but without any interference from) the interviewer. A random-route sampling procedure with 201 sample points revealed that 3,194 households needed to be contacted for the study. Of these, 3,108 households proved eligible for participation. The selection of the target individuals within the households was carried out according to the Kish selection grid (Kish, 1949). In total, 2,066 individuals took part in the study (participation rate 66%). Subjects with missing data in at least one of the items (n = 60) were excluded from the analysis. Thus, the final sample consisted of 2,006 individuals. A detailed description of the sample can be found in Table 1. Mode monthly net income was 1,500€. The procedure of the present study was approved by the ethics committee of the University of Leipzig (043/20-ek). In addition, it adhered to ICH-GCP-guidelines along with the ICC/ESOMAR International Code of Marketing and Social Research Practice. All participants were informed of the study procedures, data collection and anonymization of all personal data. All the participants provided verbal informed consent according to German law, which was documented by the interviewer before starting the survey.
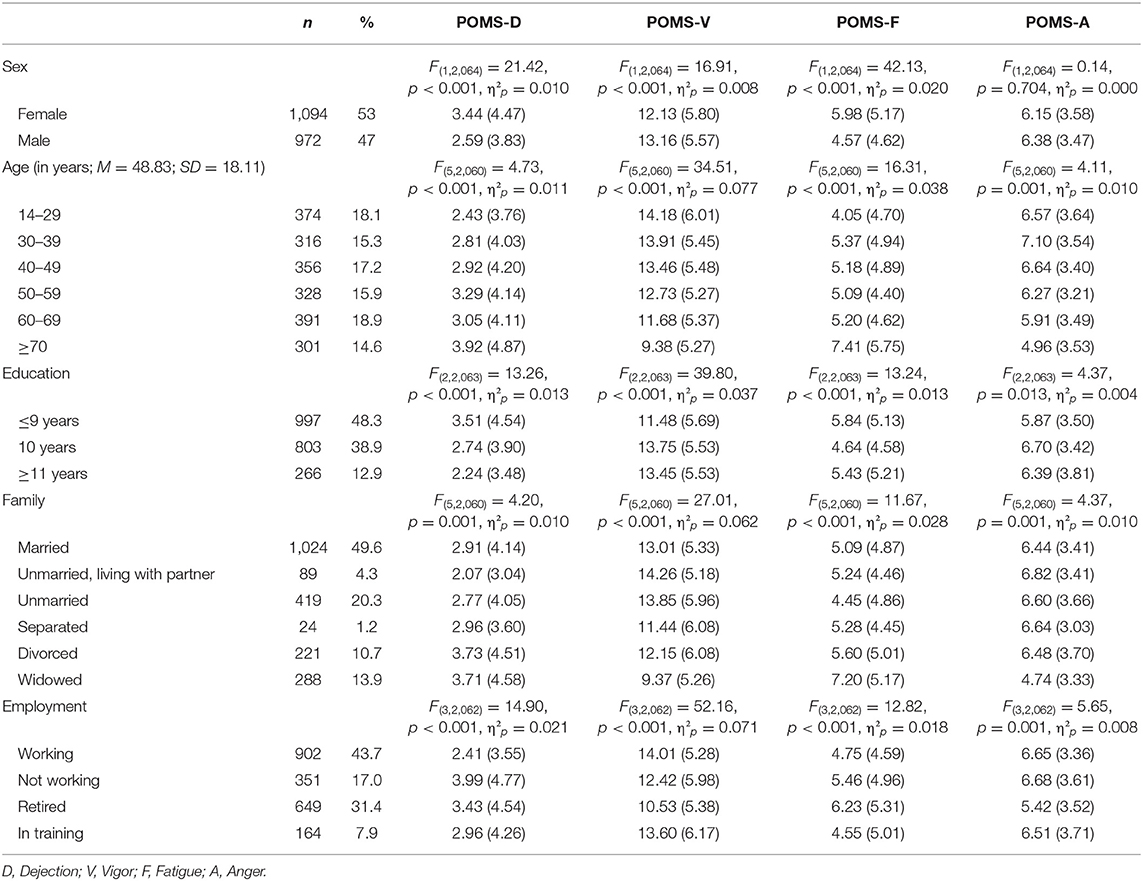
Table 1. Sample description with group comparisons for the POMS-16 subscales.
Instruments
In the present study the German short version of the Profile of Mood States (POMS; McNair et al., 1981) by Biehl et al. (1986) was implemented. The German short version consists of 35 items with four scales: dejection/anxiety (14 items), fatigue (seven items), vigor (seven items), and anger (seven items). Similar to the different English versions the German items were answered on a 5- vs. 7-step response and evaluated for “the last 24 h” (McNair et al., 1981).
Statistical Analysis
All analyses were conducted in R, using the packages EFAutilities, lavaan, moments, multilevel, semTools, and stuart (Rosseel, 2012; Komsta and Novomestky, 2015; Bliese, 2016; Dinno, 2018; Jorgensen et al., 2019; Schultze, 2019; Zhang et al., 2019). Initially, we randomly split our total sample (n = 2,006) into an exploratory (n = 1,029) and a confirmatory (n = 977) one. For the shortening of the scale in the exploratory analyses, we first examined the item descriptive statistics—in addition to running parallel analysis (Horn, 1965). For the parallel analysis, we utilized the full correlation matrix. We report both, a factor analytical and a principal component based approach with unweighted least squares estimation. However, the primary technique we employed to shorten the scale is based on model comparisons of potential item subsets (Schultze, 2019). We decided to look for solutions with four items per factor to balance the contrasting demands of scale brevity and reliability/validity. On the one hand, the aim of this study was to create the shortest possible assessment of mood. On the other hand, excessively short scales can struggle with capturing the entire width of a given construct reliably. That is first, content validity may be compromised, and second, composite reliability suffers exponentially greater losses for each item removed the fewer items remain. In addition, we constrained the algorithm to prefer solutions that are strongly invariant across participant sex. The stuart algorithm uses ant-colony optimization as a search strategy in constructing and testing subsets for the given model parameters. This avoids the necessity of testing all of the many possible combinations.
To affirm the model configuration gained in the exploratory analyses we then computed a confirmatory factor analysis (CFA) using robust maximum likelihood estimation (Yuan and Bentler, 2000). We evaluated model fit using the χ2-test and the common descriptive fit indices: the Comparative Fit Index (CFI), the Tucker-Lewis Index (TLI), the Root Mean Square Error of Approximation (RMSEA), and the Standardized Root Mean Square Residual (SRMR). According to the typical recommendations, CFI and TLI should be at least 0.95 and RMSEA and SRMR should be no >0.08 or preferably 0.05 (Hu and Bentler, 1999; Schermelleh-Engel et al., 2003).
We report omega as a measure of internal consistency. Since the multiple factors in our model are only moderately correlated and no second-order or general construct can be assumed, we utilized McDonald's (1999) basic formula. In addition, we tested the emerging model for measurement invariance across age groups and participant sex. To this end, we employed the common procedure described by Meredith (1993) of successively constraining factor loadings, item intercepts, and item residual variances. As per recommendations found in the literature (Cheung and Rensvold, 2002; Chen, 2007), we utilized between-model cutoffs of 0.010 for CFI and 0.015 for RMSEA. Where applicable, we calculated effect size estimates for group-specific parameter differences. To this end, we refered to the formulas supplied by Pornprasertmanit (2019), but corrected them according to Cohen (1988; see Supplemental Material).
Results
Exploratory Analyses
The parallel analysis using principal components evinced evidence for a four-factorial solution, as the empirical eigenvalues (15.55, 3.73, 1.70, 1.44, 0.97,.) were larger than the randomly generated ones (including a 99% confidence interval: 1.36, 1.32, 1.28, 1.25, 1.23,.) up until the fourth component. On the other hand the parallel analysis using factor analysis indicated five factors with empirical eigenvalues (15.05, 2.97, 1.13, 0.84, 0.47, 0.22,.) exceeding the simulated ones for the first five instances (including a 99% confidence interval: 0.39, 0.33, 0.29, 0.26, 0.24, 0.22,.). Because the POMS-35 was conceptualized as a four-factor instrument, we decided on utilizing four factors moving forward.
We then investigated the loading patterns of the 35 initial POMS items (Table 2), removing those items from consideration that either had no loadings of 0.50 on at least one factor, and those items that exhibited substantial loadings (λ ≥ 0.25) on more than one factor (3, 6, 7, 10, 11, 12, 19, 21, 25). These cutoffs were based on the common recommendation of excluding items with unclear loading patterns. Since r = 0.50 is generally regarded as the threshold for a high association, this was the inclusion criterion on the item's main factor. To our knowledge there are no clearly established rules for the acceptable magnitude of cross-loadings. For this reason we selected half of the previous value, r = 0.25, as the maximum permissible value for cross-loadings. Next, we explored the item response distributions, and removed items with absolute skewness >2 and/or absolute excessive kurtosis >4 (19, 24, 26, 32, 33), as such values indicate non-normal distributions (Kim, 2013). We then checked the corrected item-total correlations (rit) for the remaining items based on the scales that were suggested by the loading patterns in Table 2. This led to no further exclusions based on the rit ≥ 0.50 criterion. Finally, we removed Items 15 (“spiteful”) and 20 (“cheerful”) based on higher intercorrelations and theoretical considerations (high convergence).
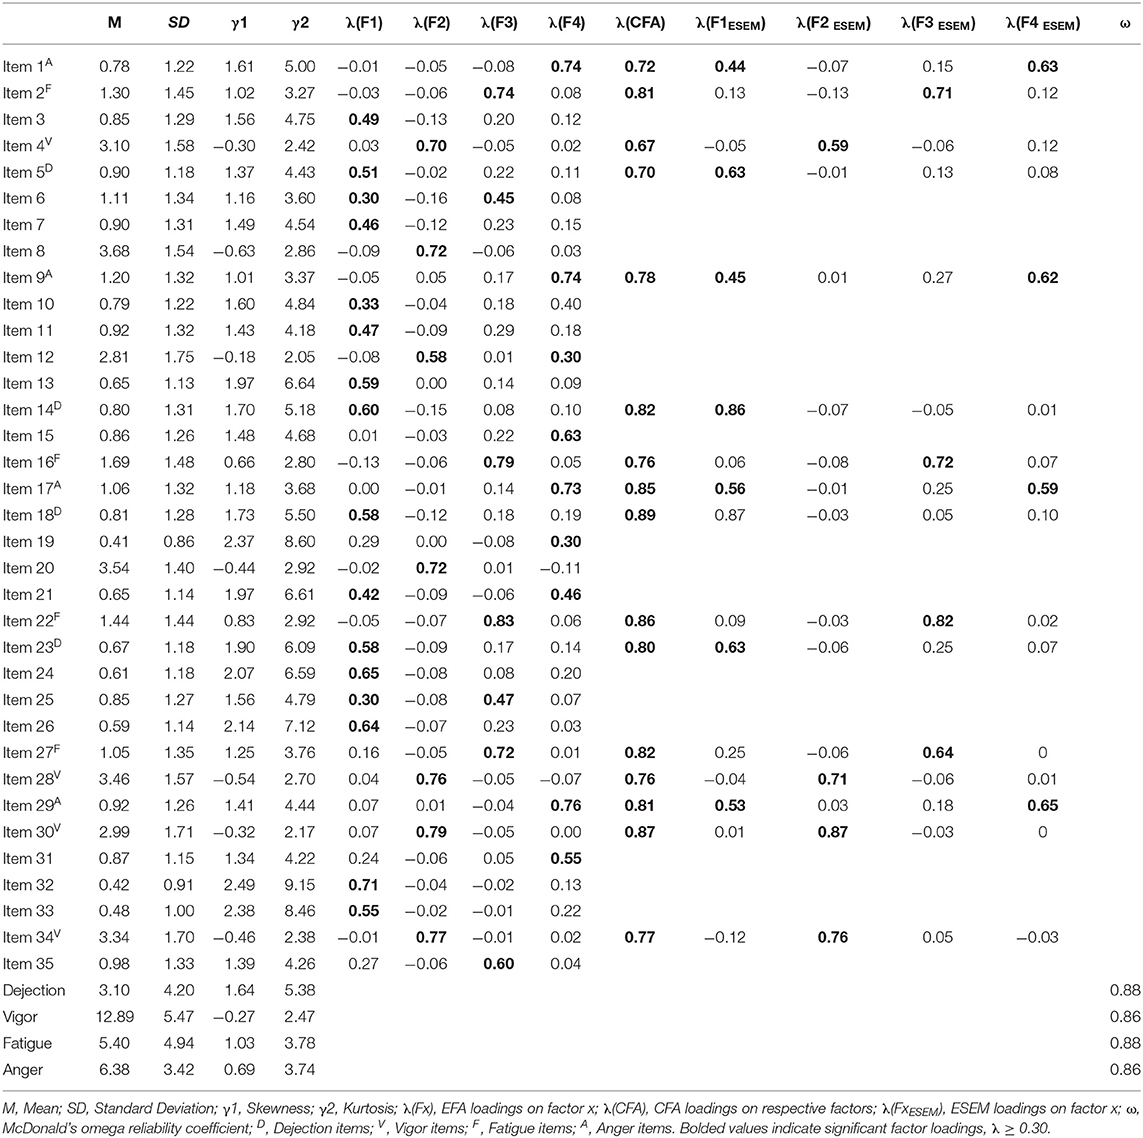
Table 2. Item descriptive statistics and exploratory factor analysis of the POMS-35.
The remaining 20 items were then entered into the exploratory stuart algorithm in order to look for the optimal four-factorial solution with four items per factor. Since there were only 625 possible solutions, we used the bruteforce algorithm—meaning that all solutions were tested. Among those, the items marked in Table 2 were selected. This model evinced good fit, χ2(220) = 360.445, p < 0.001, CFI = 0.979, TLI = 0.977, RMSEA = 0.042, SRMR = 0.039, and very good reliability for the subscales ωDejection = 0.882 [0.863, 0.901], ωVigor = 0.855 [0.836, 0.873], ωFatigue = 0.883 [0.867, 0.900], ωAnger = 0.862 [0.843, 0.882]. Because of its vastly superior factor loading we replaced Item 31 (“bad tempered”) with Item 1 (“angry”).
Factorial Validity
We then computed a CFA with the above-mentioned 16 items in a correlated factors model with four latent constructs. This model exhibited good fit, χ2(98) = 315.394, p < 0.001, CFI = 0.967, TLI = 0.960, RMSEA = 0.056, SRMR = 0.037, and again very good reliability for the subscales (see Table 2). All standardized factor loadings were equal to or >0.671. Following the advice of a reviewer, we also tested an exploratory structural equation model (ESEM; Asparouhov and Muthén, 2009) for the same input data. This analysis presented further evidence for the psychometric quality of the selected items. That is, the items separated nicely onto the four factors for the most part. Some cross-loadings between the anger and dejection items became appearant. As expected, model fit was improved over the CFA, χ2(56) = 123.51, p < 0.001, CFI = 0.988, TLI = 0.975, RMSEA = 0.035, SRMR = 0.014.
We then compared the 16-item version of the POMS to the full 35-item version. All four subscales of the short scale correlated very highly (r > 0.95) with the original. To free the associations from autocorrelations, we then removed those items that were selected for the POMS-16 from the original subscales and recalculated the correlations. The associations were attenuated but still high: rDejection= 0.90, rVigor= 0.79, rFatigue = 0.80, rAnger = 0.79. Additionally, we compared the subscale- and factor-intercorrelations (see Table 3). Here it became obvious that correlations for the shortened POMS-16 are slightly diminished when compared to the POMS-35. Although this comparison yielded significant differences in six of the 12 cases (given α = 0.05, no correction for multiple testing), the average standardized difference between the correlation coefficients was very small = 0.071. This can be considered evidence that the shortened POMS-16 still accurately captures the original constructs and retains their associations.
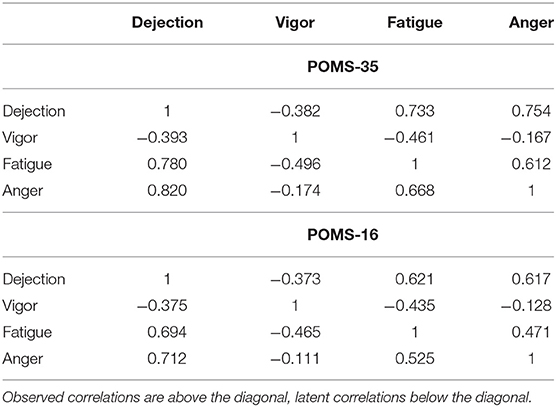
Table 3. Observed and latent correlations for the POMS-35 and−16 subscales.
Next, we tested this model for measurement invariance across participant sex and age groups. Since we had used the exploratory subsample to look for a model configuration that is strongly invariant across sex, we used only the confirmatory subsample to test invariance across sex. For the age groups, we utilized the full sample. We report the results of the step-wise test process in Table 4. The model is strictly invariant across age groups. In terms of participant sex, there is evidence for strong invariance. In addition, we demonstrated partial strict invariance by freeing the intercept of Item 23 (“gloomy”) to vary between groups. The group-specific residuals of this item differed by a moderate effect size, h = 0.442.
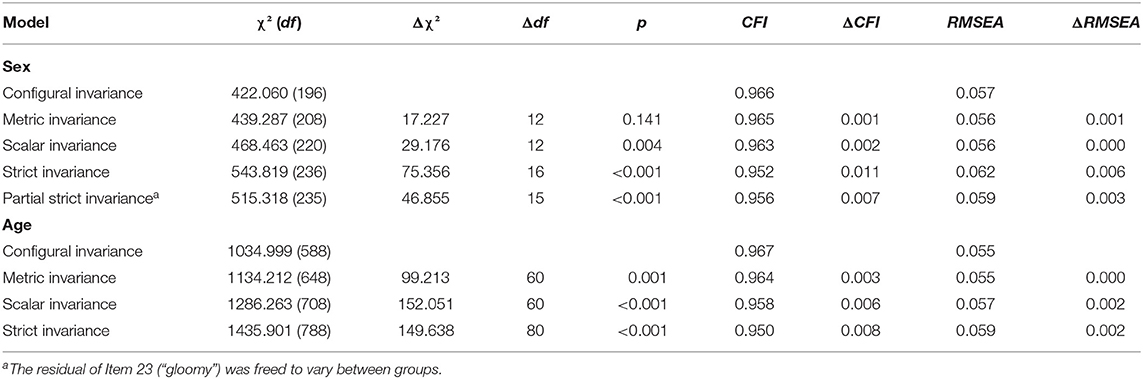
Table 4. Test of measurement invariance across age and sex for the POMS-16.
Socioemographic Differences and Norm Values
Before computing norm values, we examined how the various sociodemographic variables in the data set influenced the POMS-16 scores. It should be noted that most comparisons were (highly) significant, simply due to the large sample size. In order to gain an understanding of the practical relevance of these effects we consulted the effesct size measure η2. For η2, 0.01 indicates small effects, 0.06 indicates moderate effects, and 0.14 indicates large effects (Cohen, 1988). For the Dejection subscale, all effects should be categorized as small, with employment status being the strongest factor. With regard to the Vigor subscale, we found moderate effects for age, employment status, and family status. Education had a small to moderate effect on Vigor. Age and family status also significantly affected the Fatigue subscale, with small to moderate effects. In terms of the Anger subscale, none of the predictors had more than a negligibly small influence on the scale score. Monthly net income had small negatives association with Dejection (r = −0.108, p < 0.001) and Fatigue (r = −0.062, p = 0.006), a small positive association with Vigor (r = 0.122, p < 0.001), and a near-zero correlation with Anger (r = 0.031, p = 0.156).
Subsequently, we calculated norm values for the newly constructed POMS-16 short form in Table 5. Even though, all sociodemographic variables under study had significant effects on one or more of the subscale scores, it was not feasible in terms of space to account for all sources of influence. We thus elected to stratify the norm data by participant sex and age groups. Based on these values, individual scores can be compared to the distributions found in the German general population.
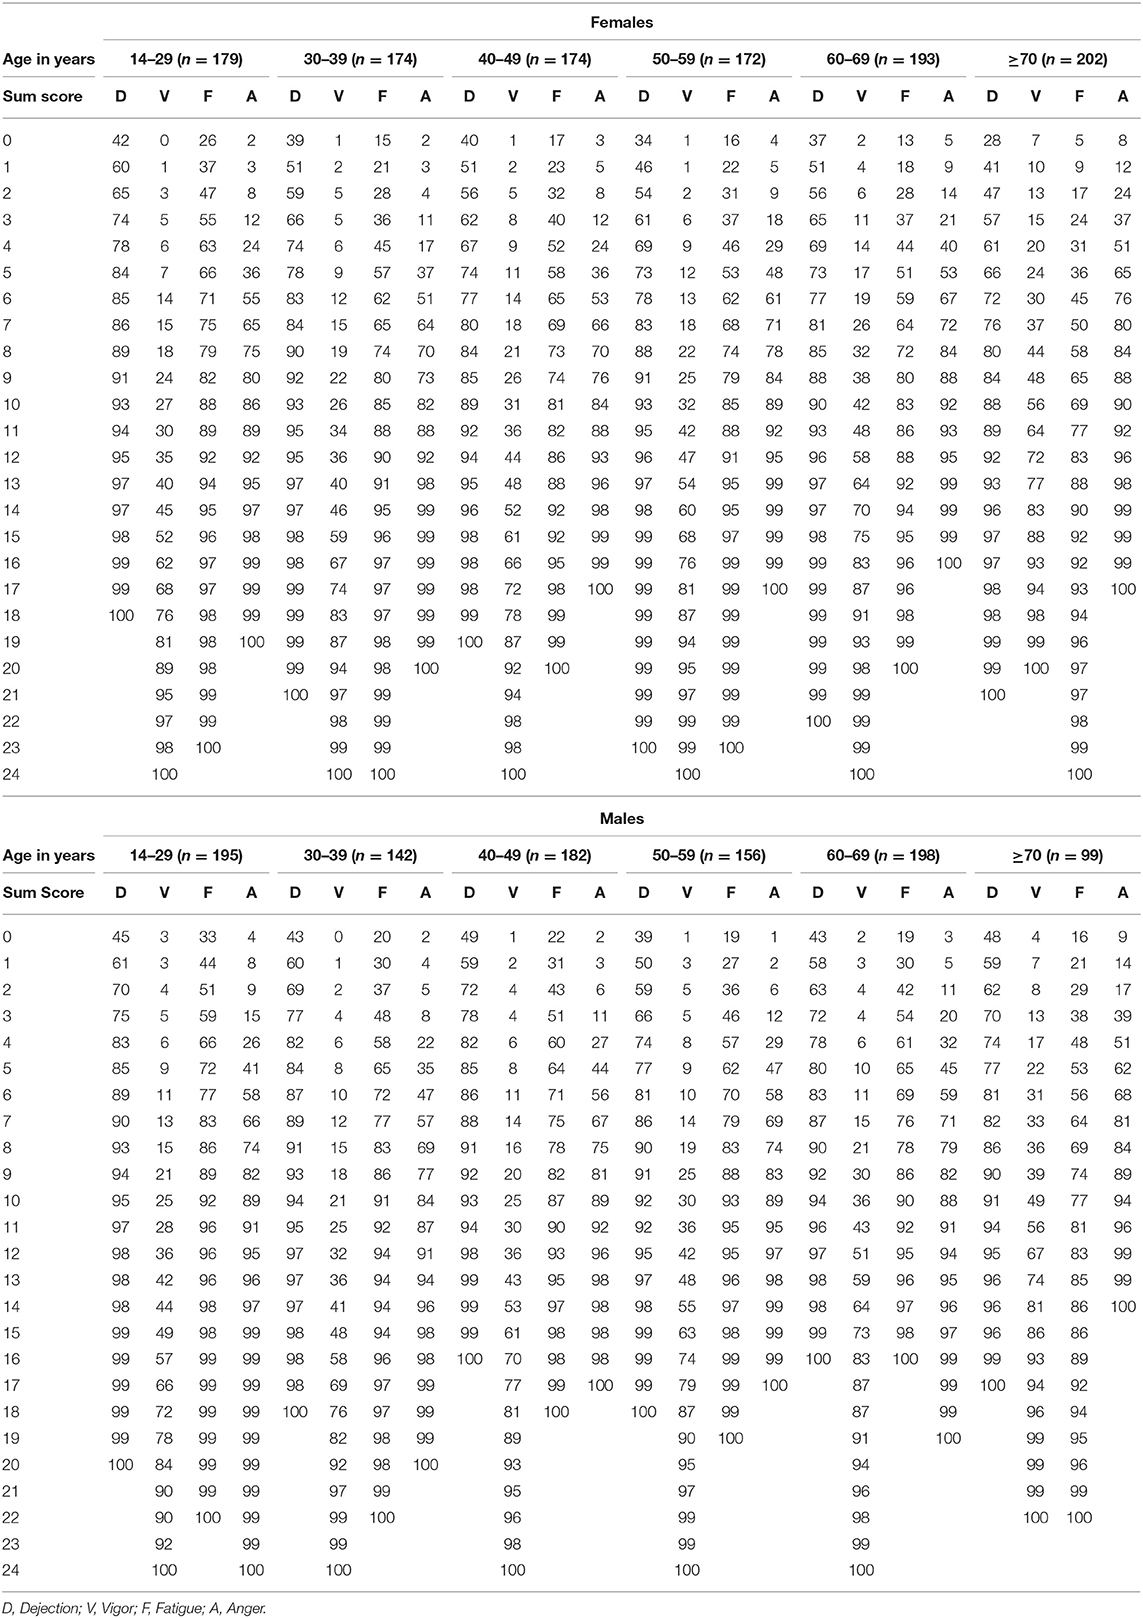
Table 5. Percentile rank normative values for the POMS-16, stratified by sex and age.
Discussion
The questionnaire “Profile of Mood States” (POMS; McNair et al., 1992) is a widely used questionnaire in the clinical field. The German version was developed based on several student samples and tested in one representative population sample. The results of the representative sample showed that the factorial structure was only limited. Due to the limited factorial structure, an item selection for a good factorial structure has to be implemented in order to improve the factorial structure. For epidemiological studies short instruments with good psychometric properties are important, therefore, it would be of interest how many items are necessary in order to evaluate the mood construct with good factorial structure. Therefore, in the present study the German version of the POMS was shortened in order to get the best factorial structure. Herefore, a representative population sample was the basis.
Based on an exploratory factor analysis and an exploaratory stuart algorithm a set of items were identified for a good reliabilty and factoriral structure. When this model was tested by a confirmatory factoranalysis this model exhibited good fit, and again very good reliability for the subscales between 0.86 to 0.91. This version with 16 items with four items for each of the four scales is strictly invariant across age groups. In terms of participant sex, there is evidence for strong invariance and partial strict invariance.
For the English speaking POMS exclusively the version by Cella et al. (1987) has a similar number of items (11 items). However, this version only provides a Total Mood Disturbance without subscales. Therefore, this German version with 16 items is the shortest version of the POMS available. It is highly correlated with the 35-item version, which is evidence of concurrent validity. Furthermore, its reliability is remarkably high, considering the brevity of its subscales.
Besides the strength of a large sample size, namely the wide range of ages and the representativeness for the general population, as a limitation, the results cannot necessarily be applied to samples with changed mood. In turn, the POMS needs to be applied to different groups with different moods as well as to clinical samples in order to further replicate or reprobate the factorial structure. Similarly, the inspection of validity needs to be expanded by calculating correlations with other related measures. In addition, there are already several short versions of the original English questionnaire. Therefore, a simple translation one of these could have been an alternative approach and therefore, a lack of novelty. However, an item reduction based on the German long version leads to better psychometric properties and account better for possible cultural differences. Finally, we did not account for response biases such as acquiescence, careless responding and others. Previous research has shown the impact of such processes and how to deal with them (Podsakoff et al., 2003; Maydeu-Olivares and Coffman, 2006; Schmalbach et al., 2020). Also, we did not exclude outliers in order to retain the representativeness of our sample. Future research should thus take these into account to yield a more differentiated view of mood assessment, which may be particularly susceptible to such ephemeral influences.
Data Availability Statement
The data analyzed in this study is subject to the following licenses/restrictions: the datasets that were analyzed for this article are available from the corresponding author upon reasonable request. Requests to access these datasets should be directed to bjarne.schmalbach@gmail.com.
Ethics Statement
The studies involving human participants were reviewed and approved by University of Leipzig Medical Faculty Ethics Committee Käthe-Kollwitz-Str. 82 04109 Leipzig. Written informed consent to participate in this study was provided by the participants' legal guardian/next of kin.
Author Contributions
All authors listed have made a substantial, direct and intellectual contribution to the work, and approved it for publication.
Funding
This research was supported by the Open Access Fund of the Johannes Gutenberg University.
Conflict of Interest
The authors declare that the research was conducted in the absence of any commercial or financial relationships that could be construed as a potential conflict of interest.
Acknowledgments
The authors wish to thank Scarlett Heiner for support with the formatting of the manuscript.
Supplementary Material
The Supplementary Material for this article can be found online at: https://www.frontiersin.org/articles/10.3389/fpsyg.2021.631668/full#supplementary-material
References
Albani, C., Blaser, G., Geyer, M., Schmutzer, G., Brähler, E., Bailer, H., et al. (2005). Überprüfung der Gütekriterien der deutschen Kurzform des Fragebogens “Profile of Mood States” (POMS) in einer repräsentativen Bevölkerungsstichprobe. Psychother. Psychosom. Medizinische Psychol. 55, 324–330. doi: 10.1055/s-2004-834727
Andrade, E., Arce, C., De Francisco, C., Torrado, J., and Garrido, J. (2013). Abbreviated version in spanish of the POMS questionnaire for adult athletes and general population. Rev. Psicol. Dep. 22, 95–102.
Andrade, E., Arce, C., Torrado, J., Garrido, J., De Francisco, C., and Arce, I. (2010). Factor structure and invariance of the POMS mood state questionnaire in Spanish. Span. J. Psychol. 13, 444–452. doi: 10.1017/S1138741600003991
Andrade, E., and Rodríguez, D. (2018). Factor structure of mood over time frames and circumstances of measurement: two studies on the Profile of Mood States questionnaire. PLoS ONE 13, e0205892. doi: 10.1371/journal.pone.0205892
Aroian, K. J., Kulwicki, A., Kaskiri, E. A., Templin, T. N., and Wells, C. L. (2007). Psychometric evaluation of the Arabic language version of the Profile of Mood States. Res. Nurs. Health 30, 531–541. doi: 10.1002/nur.20211
Asparouhov, T., and Muthén, B. (2009). Exploratory structural equation modeling. Struct. Equat. Model. Multidiscipl. J. 16, 397–438. doi: 10.1080/10705510903008204
Baker, F., Denniston, M., Zabora, J., Polland, A., and Dudley, W. N. (2002). A POMS short form for cancer patients: psychometric and structural evaluation. Psycho-Oncol. J. Psychol. Soc. Behav. Dimensions Cancer 11, 273–281. doi: 10.1002/pon.564
Bardwell, W. A., Moore, P., Ancoli-Israel, S., and Dimsdale, J. E. (2003). Fatigue in obstructive sleep apnea: driven by depressive symptoms instead of apnea severity? Am. J. Psychiatry 160, 350–355. doi: 10.1176/appi.ajp.160.2.350
Biehl, B., Dangel, S., and Reiser, A. (1986). Profile of Mood States. Collegium Internationale Psychiatriae Scalarum. Internationale Skalen f?r Psychiatrie [International Scales for Psychiatry]. Weinheim: Beltz Test.
Bliese, P. (2016). multilevel: Multilevel Functions. R package version 2.6. Available online at: https://CRAN.R-project.org/package=multilevel (accessed November 20, 2020).
Bourgeois, A., LeUnes, A., and Meyers, M. (2012). Full-scale and short-form of the Profile of Mood States: a factor analytic comparison. J. Sport Behav. 33, 355–376.
Bullinger, M., Heinisch, M., Ludwig, M., and Geier, S. (1990). Skalen zur Erfassung des Wohlbefindens: Psychometrische Analysen zum “Profile of Mood States” (POMS) und zum “Psychological General Well-Being Index” (PGWI) [Scales for the assessment of emotional well-being: Psychometric analysis of the Profile of Mood States (POMS) and of the Psychological General Well-Being Index (PGWI)]. Zeitschrift für Differentielle und Diagnostische Psychologie 11, 53–61.
Cella, D. F., Jacobsen, P. B., Orav, E. J., Holland, J. C., Silberfarb, P. M., and Rafla, S. (1987). A brief POMS measure of distress for cancer patients. J. Chronic Dis. 40, 939–942. doi: 10.1016/0021-9681(87)90143-3
Chen, F. F. (2007). Sensitivity of goodness of fit indexes to lack of measurement invariance. Struct. Equat. Model. Multidiscipl. J. 14, 464–504. doi: 10.1080/10705510701301834
Cheung, G. W., and Rensvold, R. B. (2002). Evaluating goodness-of-fit indexes for testing measurement invariance. Struct. Equati. Model. 9, 233–255. doi: 10.1207/S15328007SEM0902_5
Classen, C., Butler, L. D., Koopman, C., Miller, E., DiMiceli, S., Giese-Davis, J., et al. (2001). Supportive-expressive group therapy and distress in patients with metastatic breast cancer: a randomized clinical intervention trial. Archiv. General Psychiatry 58, 494–501. doi: 10.1001/archpsyc.58.5.494
Cohen, J. (1988). Statistical Power Analysis Jbr the Behavioral Sciences. Hillsdale, NJ: Lawrence Erlbaum Associates, 18–74.
Curran, S. L., Andrykowski, M. A., and Studts, J. L. (1995). Short form of the profile of mood states (POMS-SF): psychometric information. Psychol. Assess. 7, 80–83. doi: 10.1037/1040-3590.7.1.80
Dilorenzo, T. A., Bovbjerg, D. H., Montgomery, G. H., Valdimarsdottir, H., and Jacobsen, P. B. (1999). The application of a shortened version of the profile of mood states in a sample of breast cancer chemotherapy patients. Br. J. Health Psychol. 4:3153325. doi: 10.1348/135910799168669
Dinno, A. (2018). paran: Horn's Test of Principal Components/Factors. R package version 1.5.2. Available online at: https://CRAN.R-project.org/package=paran (accessed November 20, 2020).
Gibson, S. J. (1997). The measurement of mood states in older adults. J. Gerontol. Ser. B Psychol. Sci. Soc. Sci. 52, 167–174. doi: 10.1093/geronb/52B.4.P167
Gross, M. (1991). “Psychometrische Eigenschaften zweier Fragebogen zur Erfassung der psychischen Dimension der Lebensqualität. [Psychometric characteristics of two questionnaires to measure the psychological dimension of quality of life.]” in Lebensqualität bei kardiovaskulären Erkrankungen. Grundlagen, Messverfahren und Ergebnisse, eds M. Bullinger, L. Monika, N. Steinbuechel (Göttingen: Hogrefe), 91–109.
Grulke, N., Stähle, S., Juchems, A., Heitz, V., Bailer, H., Henn, W., et al. (2004). “Effekte kunsttherapeutischer Interventionen auf die Befindlichkeit von Krebspatienten. [Effects of art therapeutic interventions on the well-being of cancer patients],” in Kunsttherapie in der Onkologie, eds W. Henn and H. (Köln: Claus Richter Verlag), 129–137.
Horn, J. L. (1965). A rationale and test for the number of factors in factor analysis. Psychometrika 30, 179–185. doi: 10.1007/BF02289447
Hosaka, T., Sugiyama, Y., Hirai, K., and Sugawara, Y. (2001). Factors associated with the effects of a structured psychiatric intervention on breast cancer patients. Tokai J. Exp. Clin. Med. 26, 33–38.
Hu, L. T., and Bentler, P. M. (1999). Cutoff criteria for fit indexes in covariance structure analysis: conventional criteria versus new alternatives. Struct. Equat. Model. Multidiscipl. J. 6, 1–55. doi: 10.1080/10705519909540118
Jorgensen, T. D., Pornprasertmanit, S., Schoemann, A. M., and Rosseel, Y. (2019). semTools: Useful Tools for Structural Equation Modeling. R Package Version 0.5-2. Available online at: https://CRAN.R-project.org/package=semTools (accessed November 20, 2020).
Kim, H. Y. (2013). Statistical notes for clinical researchers: assessing normal distribution (2) using skewness and kurtosis. Restorative Dentistry Endodontics 38, 52–54. doi: 10.5395/rde.2013.38.1.52
Kish, L. (1949). A procedure for objective respondent selection within the household. J. Am. Statist. Assoc. 44, 380–387. doi: 10.1080/01621459.1949.10483314
Komsta, L., and Novomestky, F. (2015). Moments: Moments, Cumulants, Skewness, Kurtosis and Related Tests. R package version 0.14. Available online at: https://CRAN.Rproject.org/package=moments (accessed November 20, 2020).
Lane, A. M., and Terry, P. C. (2000). The nature of mood: Development of a conceptual model with a focus on depression. J. Appl. Sport Psychol. 12, 16–33. doi: 10.1080/10413200008404211
Lane, A. M., Terry, P. C., and Fogarty, G. (2007). Construct validity of the Profile of Mood States-adolescents for use with adults. Psychol. Sport Exerc. 4, 125–139. doi: 10.1016/S1469-0292(01)00035-8
Maydeu-Olivares, A., and Coffman, D. L. (2006). Random intercept item factor analysis. Psychol. Methods 11:344. doi: 10.1037/1082-989X.11.4.344
McNair, D., Lorr, M., and Droppleman, L. (1981). “POMS Profile of Mood States. Ein Verfahren zur Messung von Stimmungszuständen,” in Internationale Skalen für Psychiatrie, ed CIPS (Weinheim: Beltz Test Gesellschaft).
McNair, D., Lorr, M., and Droppleman, L. (1992). Profile of Mood States Manual (rev.). San Diego: Educational and Industrial Testing Service.
McNair, D. M., Lorr, M., and Droppleman, L. F. (1971). Manual for the Profile of Mood States (POMS). San Diego: Educational and Industrial Testing Service.
Meredith, W. (1993). Measurement invariance, factor analysis and factorial invariance. Psychometrika 58, 525–543. doi: 10.1007/BF02294825
Morfeld, M., Petersen, C., Krüger-Bödeker, A., Von Mackensen, S., and Bullinger, M. (2007). The assessment of mood at workplace-psychometric analyses of the revised Profile of Mood States (POMS) questionnaire. GMS Psycho Soc. Med. 4, Doc06.
Netz, Y., Zeav, A., Arnon, M., and Daniel, S. (2005). Translating a single-word items scale with multiple subcomponents-a Hebrew translation of the Profile of Mood States. Israel J. Psychiatry Relat. Sci. 42, 263–270.
Pesudovs, K., Weisinger, H. S., and Coster, D. J. (2003). Cataract surgery and changes in quality of life measures. Clin. Exp. Optometry 86, 34–41. doi: 10.1111/j.1444-0938.2003.tb03055.x
Podsakoff, P. M., MacKenzie, S. B., Lee, J. Y., and Podsakoff, N. P. (2003). Common method biases in behavioral research: a critical review of the literature and recommended remedies. J. Appl. Psychol. 88:879. doi: 10.1037/0021-9010.88.5.879
Pornprasertmanit, S. (2019). A Note on Effect Size for Measurement Invariance. Available online at: https://cran.r-project.org/web/packages/semTools/vignettes/partialInvariance.pdf (accessed November 20, 2020).
Rosseel, Y. (2012). lavaan: an R package for structural equation modeling. J. Statist. Softw. 48, 1–36. doi: 10.18637/jss.v048.i02
Schaeffer, N. C., and Presser, S. (2003). The science of asking questions. Ann. Rev. Sociol. 29:110112. doi: 10.1146/annurev.soc.29.110702.110112
Schermelleh-Engel, K., Moosbrugger, H., and Müller, H. (2003). Evaluating the fit of structural equation models: tests of significance and descriptive goodness-of-fit measures. Methods Psychol. Res. Online 8, 23–74. https://psycnet.apa.org/record/2003-08119-003
Schmalbach, B., Zenger, M., Michaelides, M. P., Schermelleh-Engel, K., Hinz, A., Körner, A., et al. (2020). From bi-dimensionality to uni-dimensionality in self-report questionnaires - applying the random intercept factor analysis model to six psychological tests. Eur. J. Psychol. Assess. 5759:a000583. doi: 10.1027/1015-5759/a000583
Schultze, M. (2019). stuart: Subtests Using Algorithmic Rummaging Techniques. R Package Version 0.8.0. Available online at: https://CRAN.R-project.org/package=stuart (accessed November 20, 2020).
Selvi, Y., Gulec, M., Aydin, A., and Besiroglu, L. (2011). Psychometric evaluation of the Turkish language version of the Profile of Mood States (POMS). Psychiatry Behav. Sci. 1:152. doi: 10.5455/jmood.20110902072033
Shacham, S. (1983). A shortened version of the Profile of Mood States. J. Personal. Assess. 47, 305–306. doi: 10.1207/s15327752jpa4703_14
Szaflarski, J. P., Hughes, C., Szaflarski, M., Ficker, D. M., Cahill, W. T., Li, M., et al. (2003). Quality of life in psychogenic nonepileptic seizures. Epilepsia 44, 236–242. doi: 10.1046/j.1528-1157.2003.35302.x
Terry, P. C., Lane, A. M., Lane, H. J., and Keohane, L. (1999). Development and validation of a mood measure for adolescents. J. Sports Sci. 17, 861–872. doi: 10.1080/026404199365425
Terry, P. C., Potgieter, J. R., and Fogarty, G. J. (2003). The Stellenbosch Mood Scale: A dual-language measure of mood. Int. J. Sport Exerc. Psychol. 1, 231–245. doi: 10.1080/1612197X.2003.9671716
Terry, P. C., Stevens, M. J., and Lane, A. M. (2005). Influence of response time frame on mood assessment. Anxiety Stress Cop. 18, 279–285. doi: 10.1080/10615800500134688
von Steinbüchel, N., Kirchenberger, I., Bullinge, M., Hiltbrunner, B., Pöppel, E., Zander, K., et al. (1994). Erfassung der Lebensqualität von Patienten mit Epilepsie: Psychometrische Überprüfung von Fragebogen im Rahmen einer Querschnittstudie. [Assessment of the quality of life of patients with epilepsy: Psychometric testing of questionnaires in a cross-sectional study]. Zeitschrift für Medizinische Psychologie 2, 72–81.
Watson, D. (1988). The vicissitudes of mood measurement: effects of varying descriptors, time frames, and response formats on measures of positive and negative affect. J. Pers. Soc. Psychol. 55, 128. doi: 10.1037/0022-3514.55.1.128
Winkielman, P., Knäuper, B., and Schwarz, N. (1998). Looking back at anger: Reference periods change the interpretation of emotion frequency questions. J. Pers. Soc. Psychol. 75, 719. doi: 10.1037/0022-3514.75.3.719
Yeun, E. J., and Shin-Park, K. K. (2006). Verification of the profile of mood states-brief: Cross-cultural analysis. J. Clin. Psychol. 62, 1173–1180. doi: 10.1002/jclp.20269
Yuan, K. H., and Bentler, P. M. (2000). Three likelihood-based methods for mean and covariance structure analysis with nonnormal missing data. Sociol. Ethodol. 30, 165–200. doi: 10.1111/0081-1750.00078
Zhang, G., Jiang, G., Hattori, M., and Trichtinger, L. (2019). EFAutilities: Utility Functions for Exploratory Factor Analysis. R package version 2.0.0. Available online at: https://CRAN.R-project.org/package=EFAutilities (accessed November 20, 2020).
Keywords: mood, assessment, scale development, screening instrument, factor analysis
Citation: Petrowski K, Albani C, Zenger M, Brähler E and Schmalbach B (2021) Revised Short Screening Version of the Profile of Mood States (POMS) From the German General Population. Front. Psychol. 12:631668. doi: 10.3389/fpsyg.2021.631668
Received: 20 November 2020; Accepted: 30 April 2021;
Published: 31 May 2021.
Edited by:
Laura Badenes-Ribera, University of Valencia, SpainReviewed by:
Claudio Barbaranelli, Sapienza University of Rome, ItalyReza Pishghadam, Ferdowsi University of Mashhad, Iran
Cesar Merino-Soto, University of San Martín de Porres, Peru
Copyright © 2021 Petrowski, Albani, Zenger, Brähler and Schmalbach. This is an open-access article distributed under the terms of the Creative Commons Attribution License (CC BY). The use, distribution or reproduction in other forums is permitted, provided the original author(s) and the copyright owner(s) are credited and that the original publication in this journal is cited, in accordance with accepted academic practice. No use, distribution or reproduction is permitted which does not comply with these terms.
*Correspondence: Bjarne Schmalbach, bjarne.schmalbach@gmail.com
†These authors have contributed equally to this work