 Krithica Srinivasan
 James M. Gilchrist
 Gopee Krishnan
 Arnold Wilkins
 Peter M. Allen
- 1Department of Optometry, Manipal College of Health Professions, Manipal Academy of Higher Education, Manipal, India
- 2Independent Researcher in Optometry and Vision Science, North Yorkshire, United Kingdom
- 3Department of Speech and Hearing, Manipal College of Health Professions, Manipal Academy of Higher Education, Manipal, India
- 4Department of Psychology, University of Essex, Colchester, United Kingdom
- 5Department of Vision and Hearing Sciences, Anglia Ruskin University, Cambridge, United Kingdom
- 6Vision and Eye Research Unit, Anglia Ruskin University, Cambridge, United Kingdom
The rate of reading test in which randomly ordered common words are read aloud has found use in optometric and educational practice as a means of assessing visual aspects of reading largely independently of comprehension. English and Kannada versions of the rate of reading test were administered to 761 children aged between 9 and 15 years. These children were recruited from four private and five state schools in Udupi Taluk that had English and Kannada, respectively, as the principal medium of instruction. The results showed that the reading rate increased with age, as expected, but depended on the language of the test and the medium of instruction. The study emphasizes the importance of using normative data based on age and the language of instruction used in school. It also suggests age-specific criteria to measure the efficacy of any visual intervention aimed at improving reading speed. The test can be used to assess (1) educational under-performance in reading and (2) the effects of optometric and educational intervention, and separate norms appropriate for each use are presented.
Introduction
The Wilkins rate of reading test (WRRT) provides an estimate of the rate at which randomly ordered common words can be read aloud. The test is designed to measure visual aspects of reading independently of comprehension. It has proved useful in optometric practice for assessing the effects of interventions such as correction of refractive error (O’Leary et al., 2014), prisms to improve reading speed (O’Leary and Evans, 2006), and colored overlays to reduce visual stress (Wilkins et al., 1996). Versions of the test have been created in various languages, including Kannada (Srinivasan et al., 2018). The Kannada version has been shown to have good reliability and validity (Srinivasan et al., 2018), similar to the English version (Wilkins et al., 1996). The Kannada version shows the expected effects of age on reading rate. However, in order to be useful for clinicians a set of recommended reference or criterion values are necessary, and it is the purpose of this paper to provide such values based on statistical analysis of data from a large sample of school children.
Tests of reading rate (and other measures of performance) may be used in one of two ways. One is to assess differences between individuals, in order to make decisions on whether specific individuals are achieving typical “normal” levels of performance. In particular, individuals whose performance falls significantly short of typical levels may need further investigation to see whether they have difficulties that require specific intervention or support. The second use of a test is then to measure an individual’s response to intervention; that is, whether a significant change in performance over time occurs in that individual following introduction of an intervention.
For assessment of differences between individuals, what matters is the statistical reliability of the test – which indicates its ability to discriminate between individuals – and estimates of average performance of and variation between individuals in the population. The Kannada and English versions of RRT have shown high reliability. Analysis of data obtained from 799 children aged 7 to 16 years (Srinivasan et al., 2018) yielded test-retest correlations of 0.91 and 0.95 for English and Kannada versions of the RRT, respectively. This article extends the analysis of the same dataset to provide estimates of the lower limits of reading rate that might be expected using the English and Kannada versions of the RRT in children of different ages. These values will inform recommendations on criteria that may be used in practice to identify slow readers whose poor performance may justify further investigation.
For assessment of response to intervention, what matters is the precision of the test – that is, its repeatability over time – because a change in reading rate in response to intervention can only be regarded as significant if it exceeds the typical level of test-retest repeatability. We will present statistical analysis of test-retest differences in the data set described previously (Srinivasan et al., 2018) as a basis for setting criteria for change on English and Kannada versions of the RRT.
Materials and Methods
Ethics Statement
The investigations done in the study adhered to the principles of the Declaration of Helsinki. The research protocol was approved by the Research Committee of Manipal College of Health Professions and Ethics Committee of Kasturba Hospital, Manipal. The data were collected in schools that belonged to the same district where the institute was located (Udupi district). Parents of all children provided written informed consent and assent was obtained from children after a verbal and a written explanation of the procedures.
Participants
The participants included children from 9 schools located in Udupi Taluk (in Udupi district of the Karnataka state in India). The medium of instruction was English in four schools and in the remaining five, it was Kannada. The participants belonged to the 2nd to 9th grades from 4 private and 5 state schools that had English and Kannada, respectively, as the principal medium of instruction. Both males and females from each grade who were present on the day of the assessment were considered for the study. Based on the following inclusion and exclusion criteria, a total of 799 (430 male and 369 female) children were recruited in the age range of 7–16 years.
The inclusion criteria were: (1) the ability to correctly read the words present in both the Kannada and English RRTs and (2) visual acuity of better than or equal to 6/6 and N6. We excluded those children with strabismus, ocular abnormalities (observed on external examination), and those with a known ocular anomaly. The testing rooms were naturally illuminated with daylight that ranged from 600 to 900 lux.
Procedure
Rate of Reading
Participants completed the Kannada and English versions of the RRT twice as part of a study that investigated the effects of colored overlay on reading. The results of the overlay will be reported separately in a subsequent paper. The rate of reading was measured without the overlay twice in each language using different versions of the tests that differed only in word sequence (Figure 1). The test RRT was administered to all participants at a viewing distance between 0.4 and 0.5 m.
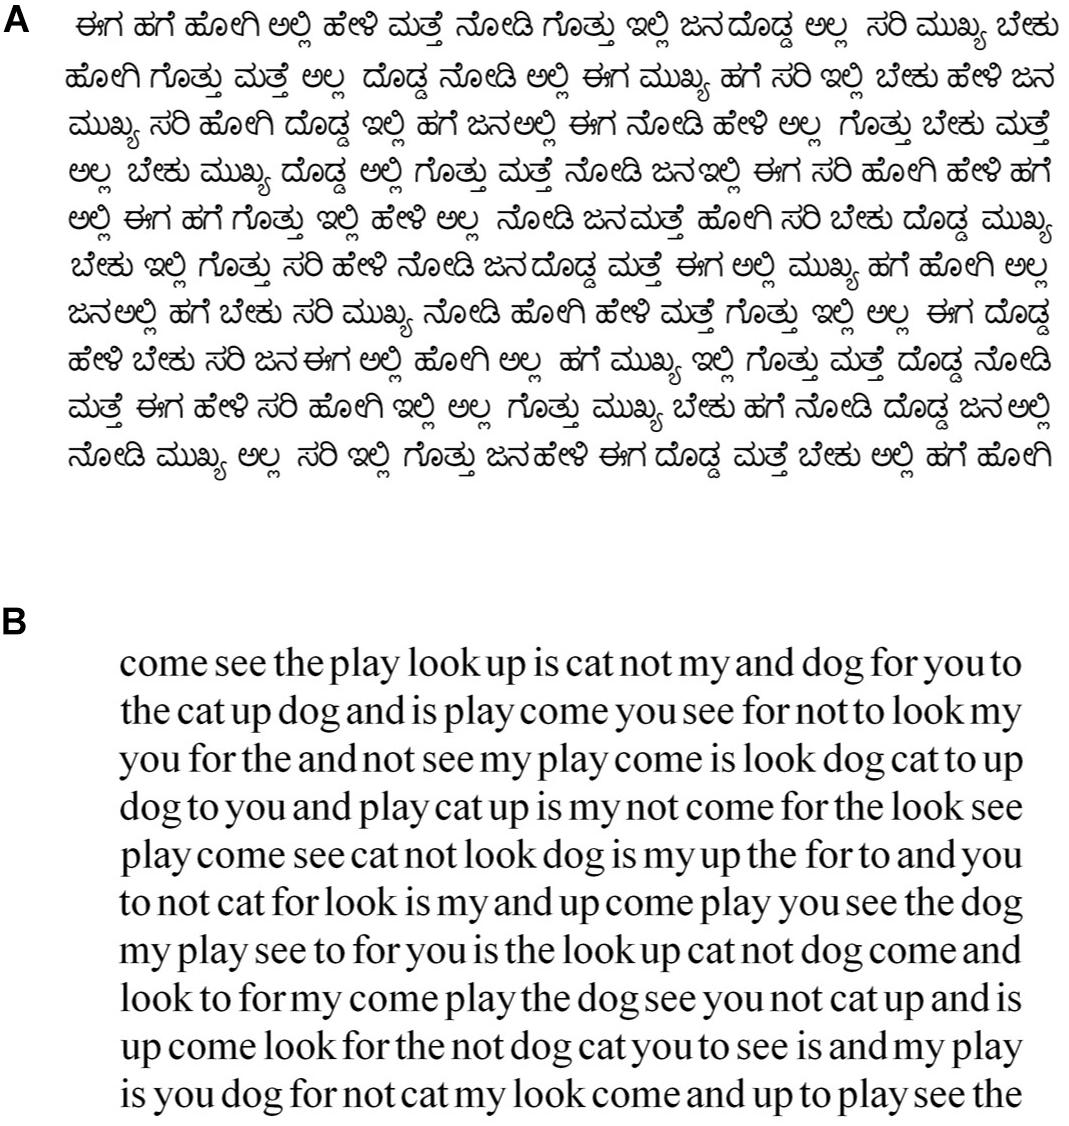
Figure 1. Examples of a Kannada (A) and an English (B) rate of reading test.
The order of administration of the English and Kannada RRT versions was alternated across participants with a time interval of approximately 10 min between languages. Each passage was read aloud for 1 min and the number of words correct per minute (wcpm) was recorded. The interval between the two measurements in each language taken on each participant was typically around 5 min. The rate of reading improves with practice (Wilkins and Lewis, 1999), but the practice effects are small, and unaffected by motivational instructions (Wilkins et al., 2001). Any difference between measurements could then be attributed to random variation.
Statistical Analyses
All analyses were conducted using the free and open statistical platform jamovi1.
Results
Use of RRT to Identify Atypically Slow Readers
In this section, we examine factors affecting the mean and variability of reading rates among individuals to determine reasonable criteria for identifying slow readers. Reading rate values of individual participants, in the following analysis, were the means of the two measurements taken with each version of the RRT.
A previous article (Srinivasan et al., 2018) presented data obtained using both Kannada and English versions of the RRT, and showed that reading rates of children aged 9–15 years increased with age, as could be expected. However, there were differences between the two versions of the test as well as the medium of instruction (i.e., English vs. Kannada). Prior to analysis, we filtered the original dataset of 761 participants to remove the data that were more than 3 standard deviations from the overall sample mean. This resulted in removal of two individuals, yielding a sample of 759 participants’ data for analysis.
Table 1 presents a statistical analysis of these data – repeated measures (within-subjects) ANOVA for Test version, English or Kannada, with medium of Instruction as a between-subjects factor, and Age as a covariate.
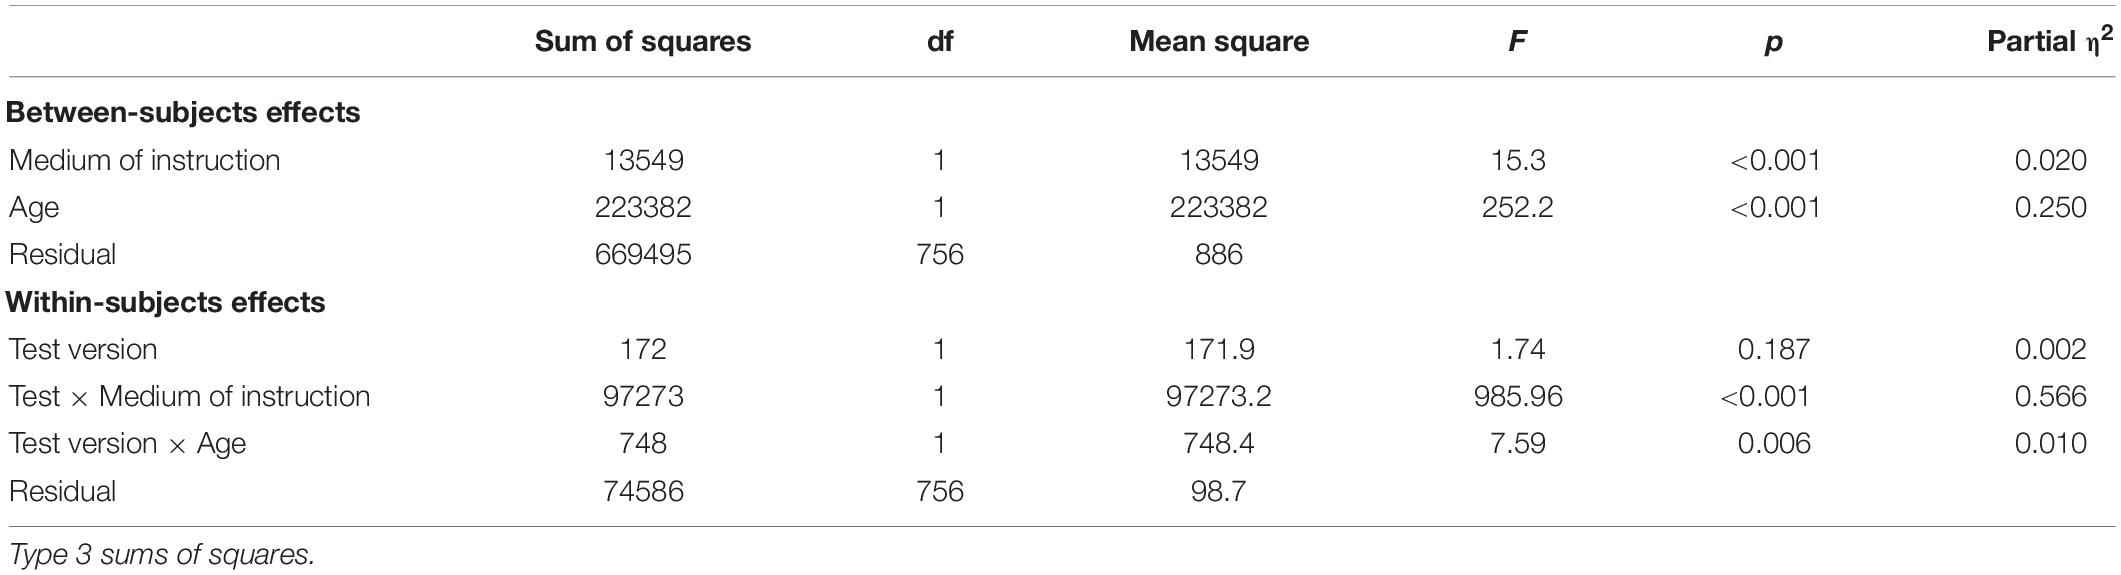
Table 1. Repeated measures ANOVA: Rate of reading.
The summary of between-subjects’ effects in Table 1 indicates that both Age and Instruction have a highly significant influence on rate of reading scores (p < 0.001). As shown in the within-subjects summary, differences between versions of the Test itself were not significant once the factors of Age and Instruction were considered (pTest = 0.163), but a significant interaction between the Test version and the medium of Instruction (pTest * Instruction < 0.001). Therefore, it will be helpful to examine the data further, separating the results according to the medium of instruction. This reveals two distinctly different patterns of performance, as shown in Figures 2A,B.
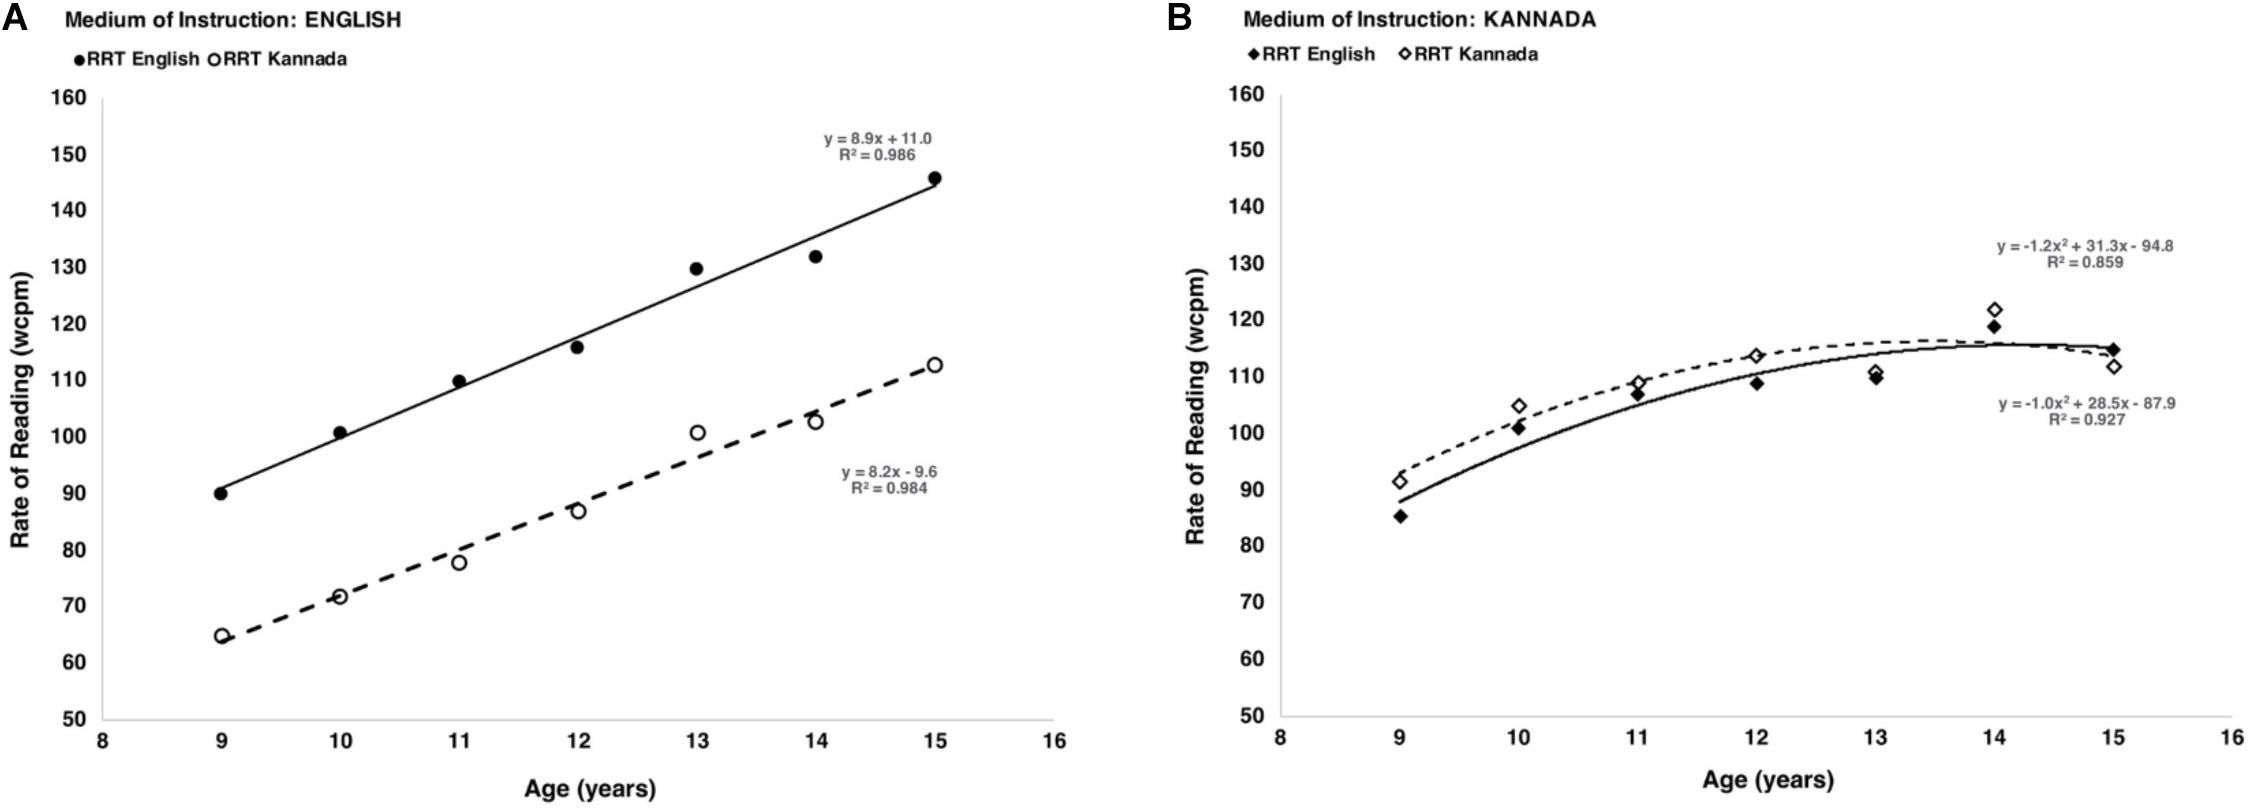
Figure 2. Effect of age and medium of instruction (A – English, B – Kannada) on rate of reading.
Figure 2A shows that, for children who are instructed in English, the mean reading rate increases linearly from age 9 to 15 years at a rate of approximately 8 wcpm per year, whether measured by the English version of the RRT or the Kannada version. However, children of every age read approximately 30 wcpm more slowly on the Kannada RRT. For children instructed in English, therefore, judgments of whether they are typical or slow readers will depend upon which language version of the test is used to measure their reading rate.
On the other hand, for children who are instructed in Kannada, Figure 2B shows that there is very little difference in reading rate between English and Kannada versions of the RRT, at any age. Furthermore, the plots for children instructed in Kannada show a ceiling effect, in that reading rates do not increase linearly with age but reach a maximum around age 12, and remain more or less constant thereafter.
The differences seen in Figure 2 suggest that if the RRT is to be used to assess differences between children, and identify those who are atypically slow readers, then criteria may need to be different according to which language version of the test is used and in which language children have been taught. To further inform this possibility, therefore, we have examined the distributions of reading rates in the four categories presented in Figure 1, that is Test: English and Kannada, and Instruction: English and Kannada. Representations of these distributions are in Figures 3A–D.
Figure 3. Mean rate of reading measures ±2 standard deviations as a function of age for the groups categorized based on reading test and medium of instruction. (A) English test-English instruction, (B) Kannada test-English instruction, (C) English test-Kannada instruction, (D) Kannada test-Kannada instruction.
Data points in Figures 4A–D show test-retest means for the individuals in each age group, with horizontal bold lines indicating group means, with shaded areas extending ±2 standard deviations either side of the mean. Detailed summary statistics are given in Table 2, including Shapiro-Wilk statistics for normality. Values in Table 2 include the lower 95% limits of variation, which may be used to guide the choice of pass/fail criteria to identify atypically slow readers.
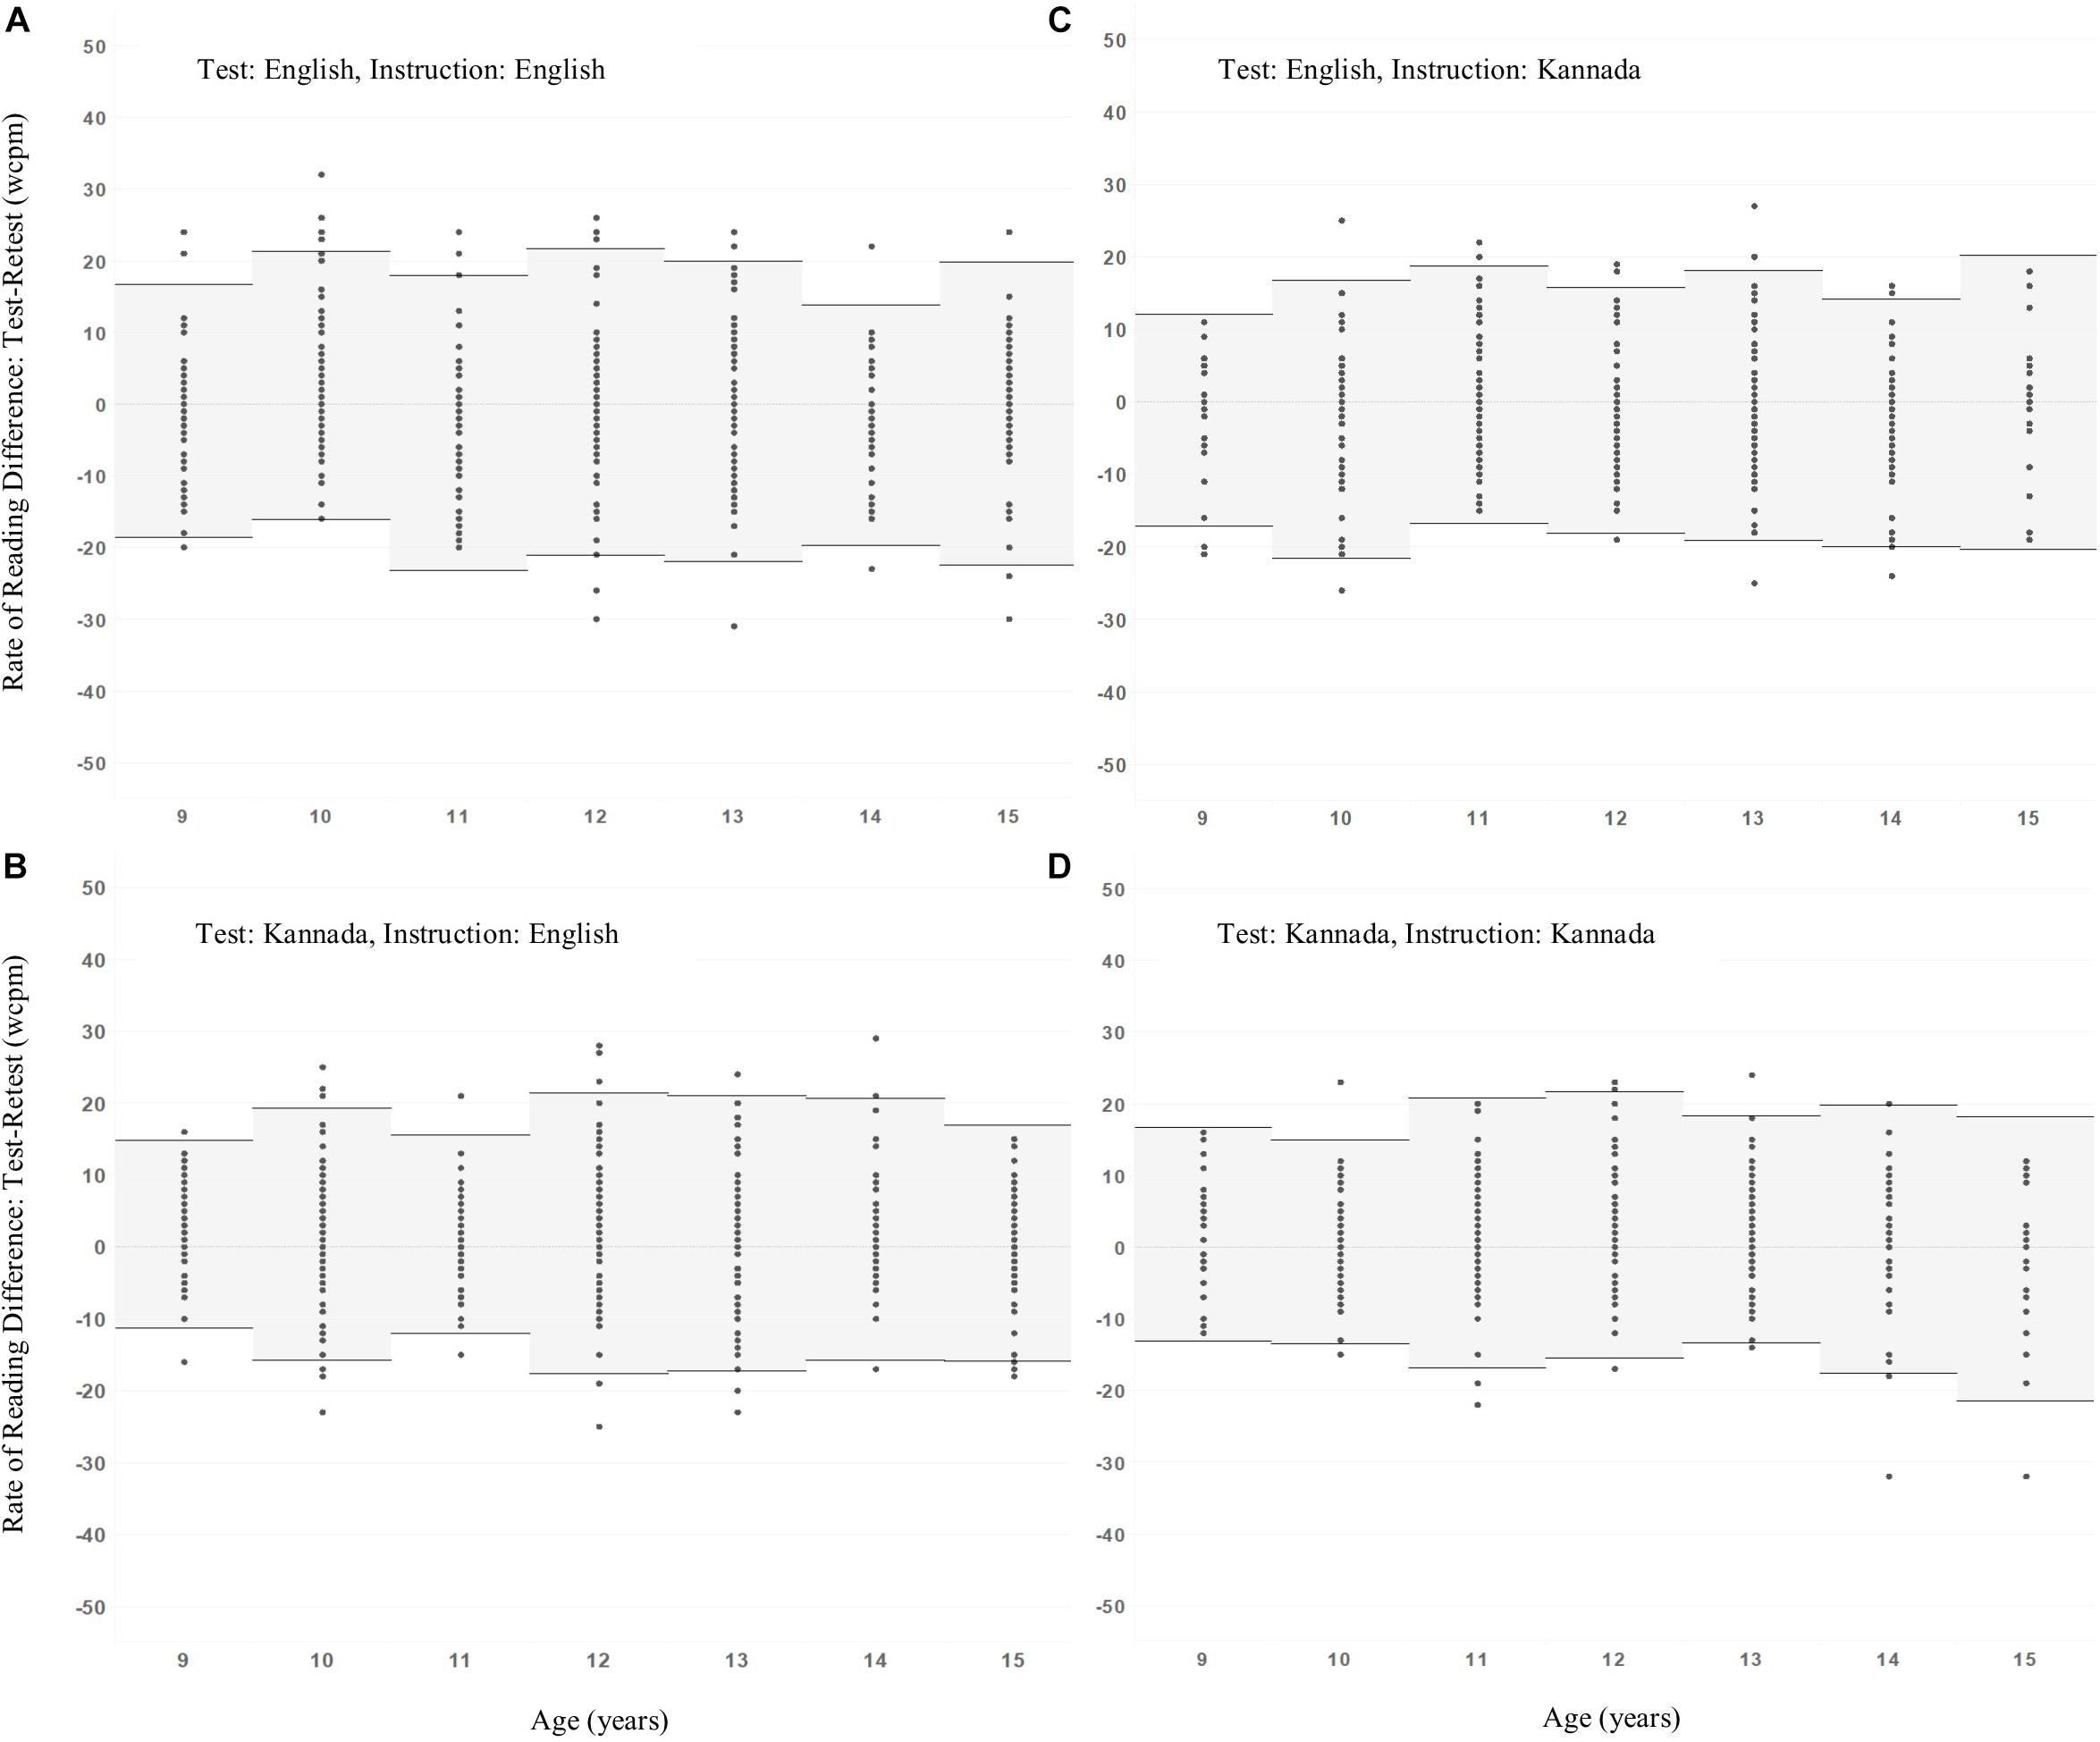
Figure 4. Mean test-retest rate of reading differences ±2 standard deviations as a function of age for the groups categorized based on reading test and medium of instruction. (A) English test-English instruction, (B) Kannada test-English instruction, (C) English test-Kannada instruction, (D) Kannada test-Kannada instruction.
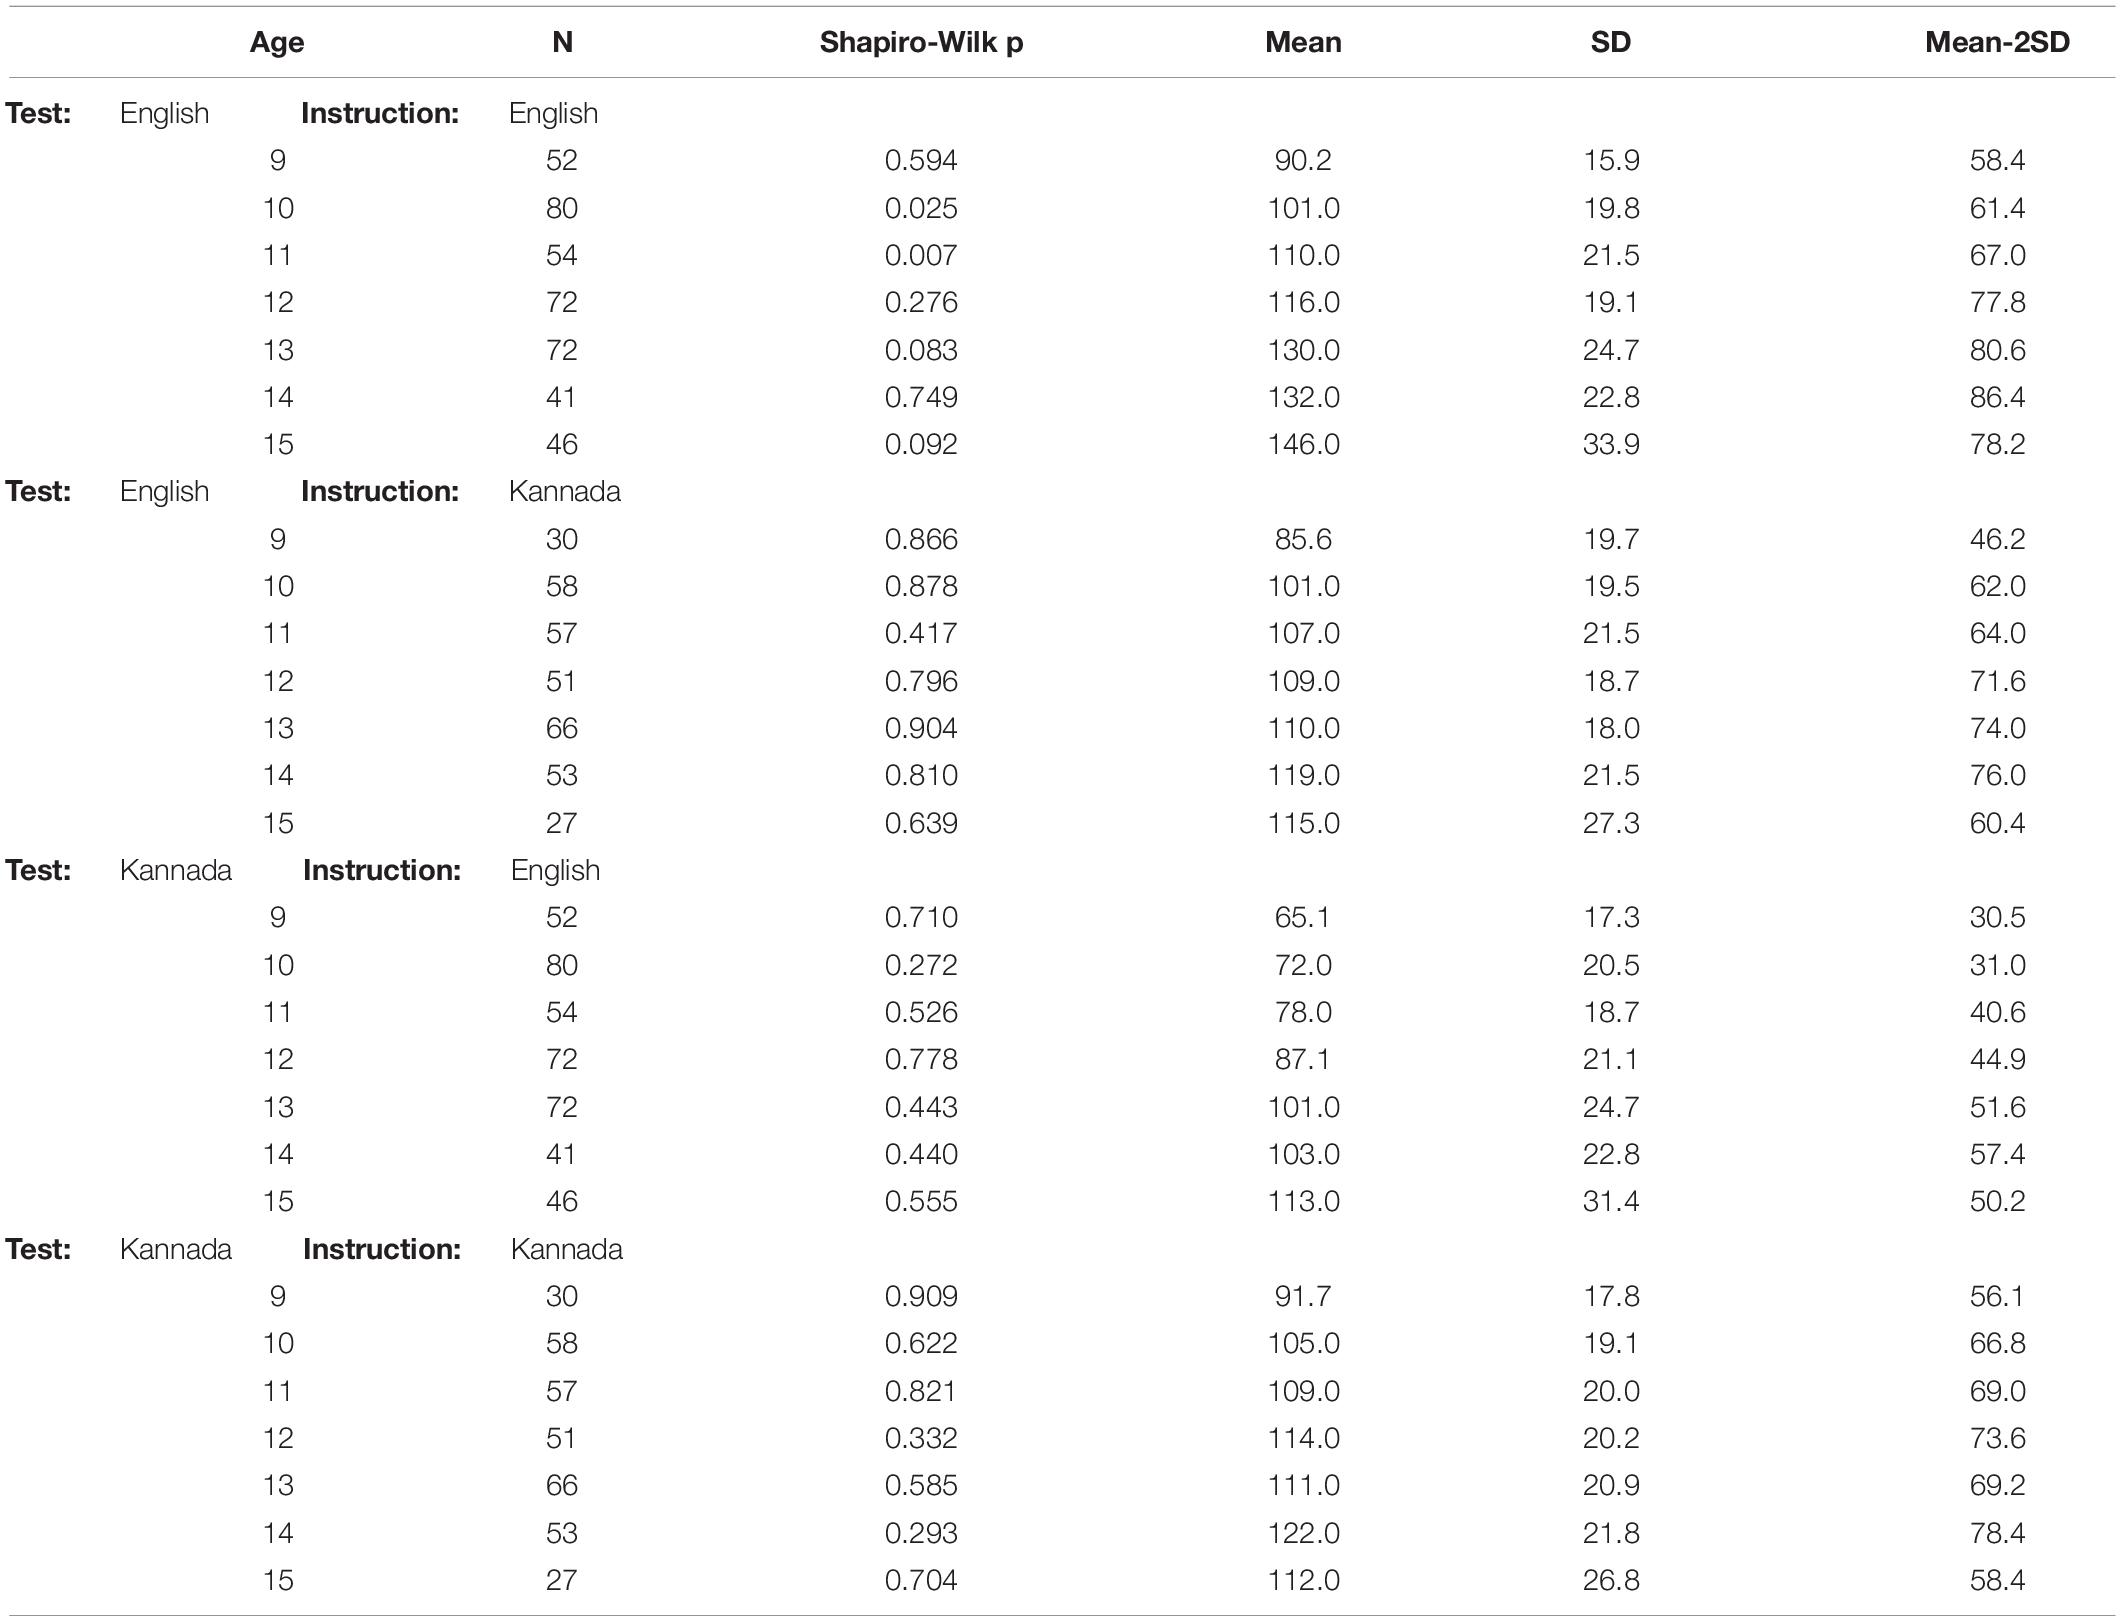
Table 2. Reading rate summary statistics, by test, medium of instruction, and age.
We note that the standard deviations are broadly consistent across ages and conditions, and so the lower 95% range limits follow a pattern similar to that of the sample means as illustrated in Figure 2 above. Therefore, we make the following suggestions for using the RRT to assess differences between children:
1. Children taught in English should be assessed using the English version of the RRT. This is justified by the fact that reading vs. age profiles of these children for English and Kannada RRT versions are almost identical, with the only difference being that children at every age read the Kannada version approximately 30 wcpm more slowly, so there is no advantage in assessing children with more than one test.
2. Children taught in Kannada should be assessed using the Kannada version of the RRT. This is justified by the fact that reading vs. age profiles for English and Kannada RRT versions are almost identical in both form and rates of reading, so there is no advantage in assessing children with more than one test.
3. If a single criterion value to identify atypically slow readers is sought (for simplicity), then a pragmatic approach would be to adopt a criterion of 70 wcpm for all children, regardless of age or which test is used. Noting that the penalties for adopting a single criterion for all are that: (a) younger children (age 9–10) may have typical lower-limit reading rates of 60–70 wcpm, so a criterion of 70 wcpm would be too high and would result in some/many being incorrectly identified as slow readers; i.e., false-positives, and conversely, (b) older children (age 13–15), especially those taught and assessed in English, may have typical lower-limit reading rates of around 80 wcpm, so a criterion of 70 wcpm would be too low and would result in some/many slow readers being missed; i.e., false-negatives.
4. A more precise proposal, based on the analysis illustrated above (Figures 2A,B) is to relate the reading rate criterion to age. Taking this approach, regression analysis leads to the following suggested criteria (Table 3) for identifying children with atypically low reading rate.
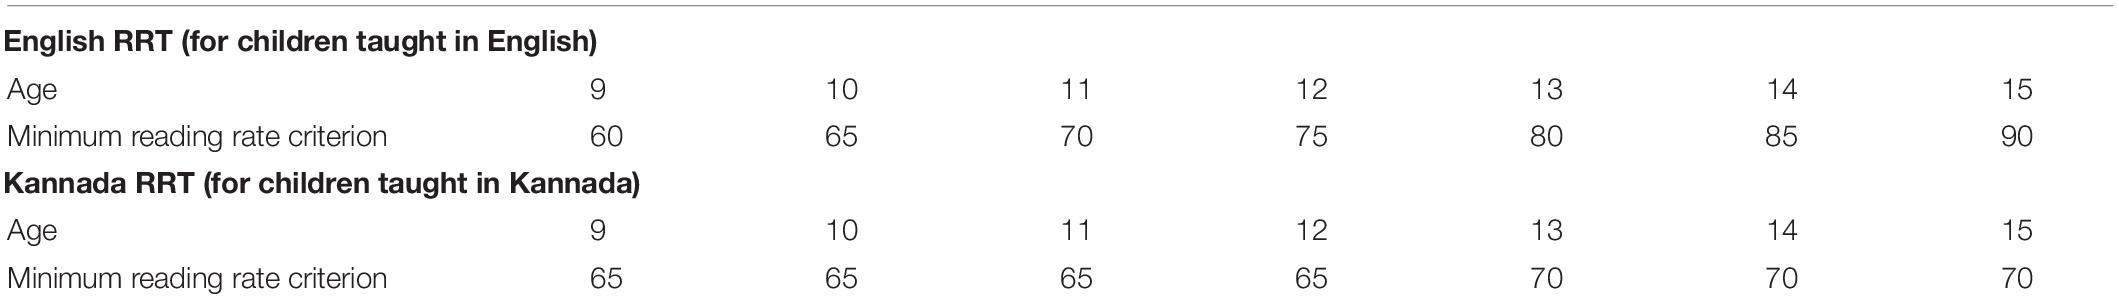
Table 3. Suggested criteria for minimum typical reading rates, by test and age.
Use of RRT to Assess Individual Reading Rate Change Over Time
Whereas the criteria for assessing differences between children must be based upon the statistics of variation between individuals in the population, those for assessing change in individual children over time must be based upon the repeatability of measurements. If an individual provides two measurements on the RRT with just a short time interval between them then as long as there has been no change in the true reading rate of the individual during that interval, for example due to practice or fatigue effects, then any difference between the measurements may be assumed to be due to natural, random variation in test results. Consequently, in order to be considered statistically significant, any true change in reading rate over time must exceed the level of random variation. We may use the values of test-retest differences in a sample of individuals to estimate the range of random variation in the population, and thus set criteria for significant change in reading rate.
Having previously recognized the occurrence of four different profiles for test-retest mean reading rate vs. age, according to Test version and medium of Instruction, we now analyze the test-retest differences in the same manner, to establish whether this distinction is of consequence for the setting of criteria for change.
Inspection of the data showed that some individuals gave unexpectedly large test-retest differences in reading rate. Therefore, prior to analysis, we filtered the original dataset of 761 participants to remove any whose test-retest difference fell more than 3 standard deviations from the overall sample mean difference. This resulted in removal of fifteen individuals, giving a sample size of 746 for analysis.
Table 4 presents a statistical analysis of test-retest differences, using repeated measures (within-subjects) ANOVA for Test version, English or Kannada, with medium of Instruction as a between-subjects factor, and Age as a covariate.
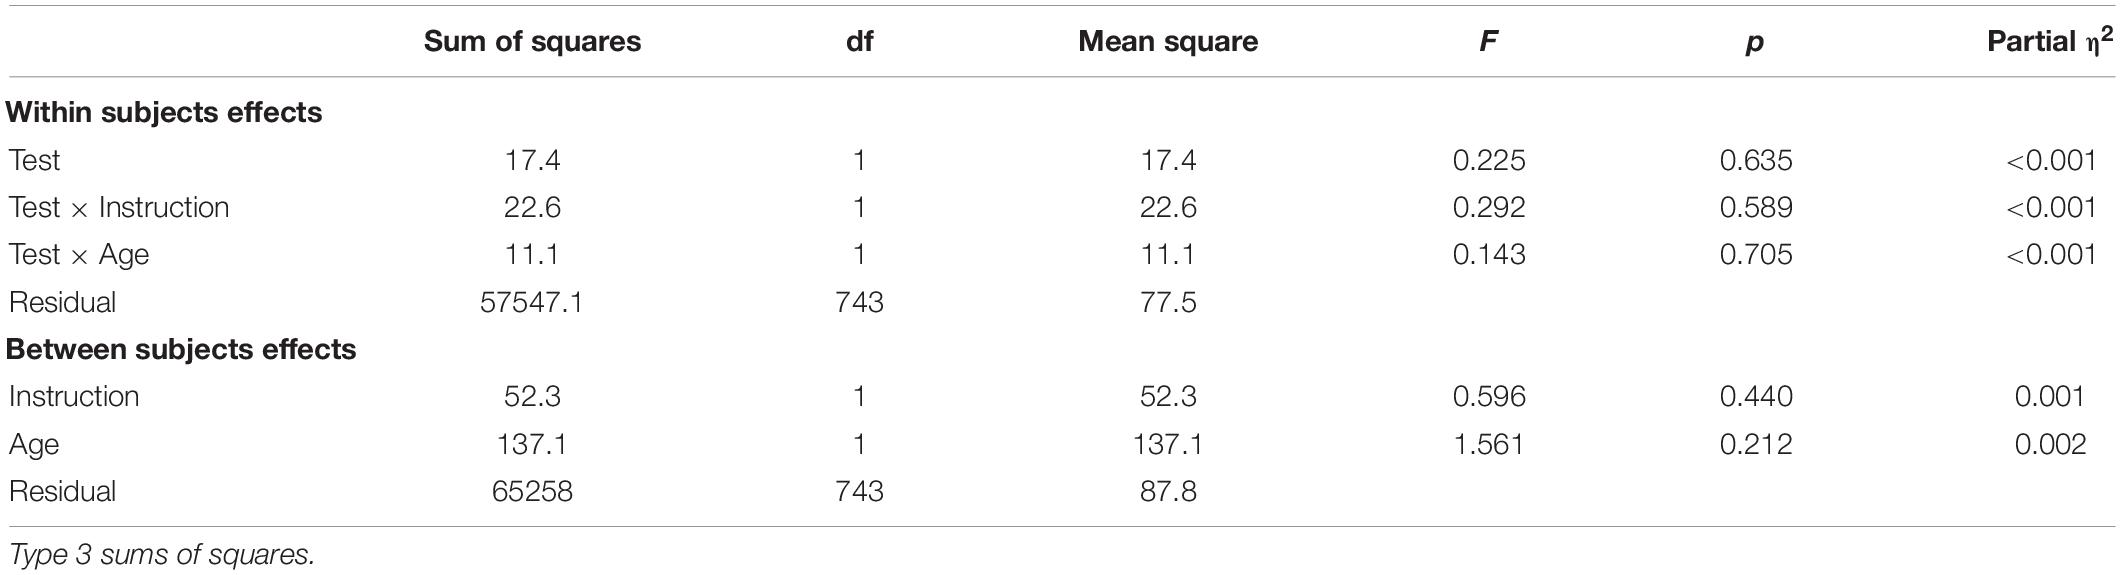
Table 4. Repeated measures ANOVA: Rate of reading (test-retest differences).
Results in Table 4 show that there is no significant effect on difference scores of any individual factor, nor is there any significant interaction between factors – see also Figure 4.
Data points in Figure 4 show test-retest differences for the individuals in each age group, with horizontal bold lines indicating group means, with shaded areas extending ±2 standard deviations either side of the mean. Detailed summary statistics are given in Table 5, including Shapiro-Wilk statistics for normality. Values in Table 5 include values for 2 × standard deviation of differences, which may be used to guide the choice of pass/fail criteria to identify statistically significant change in reading rate.
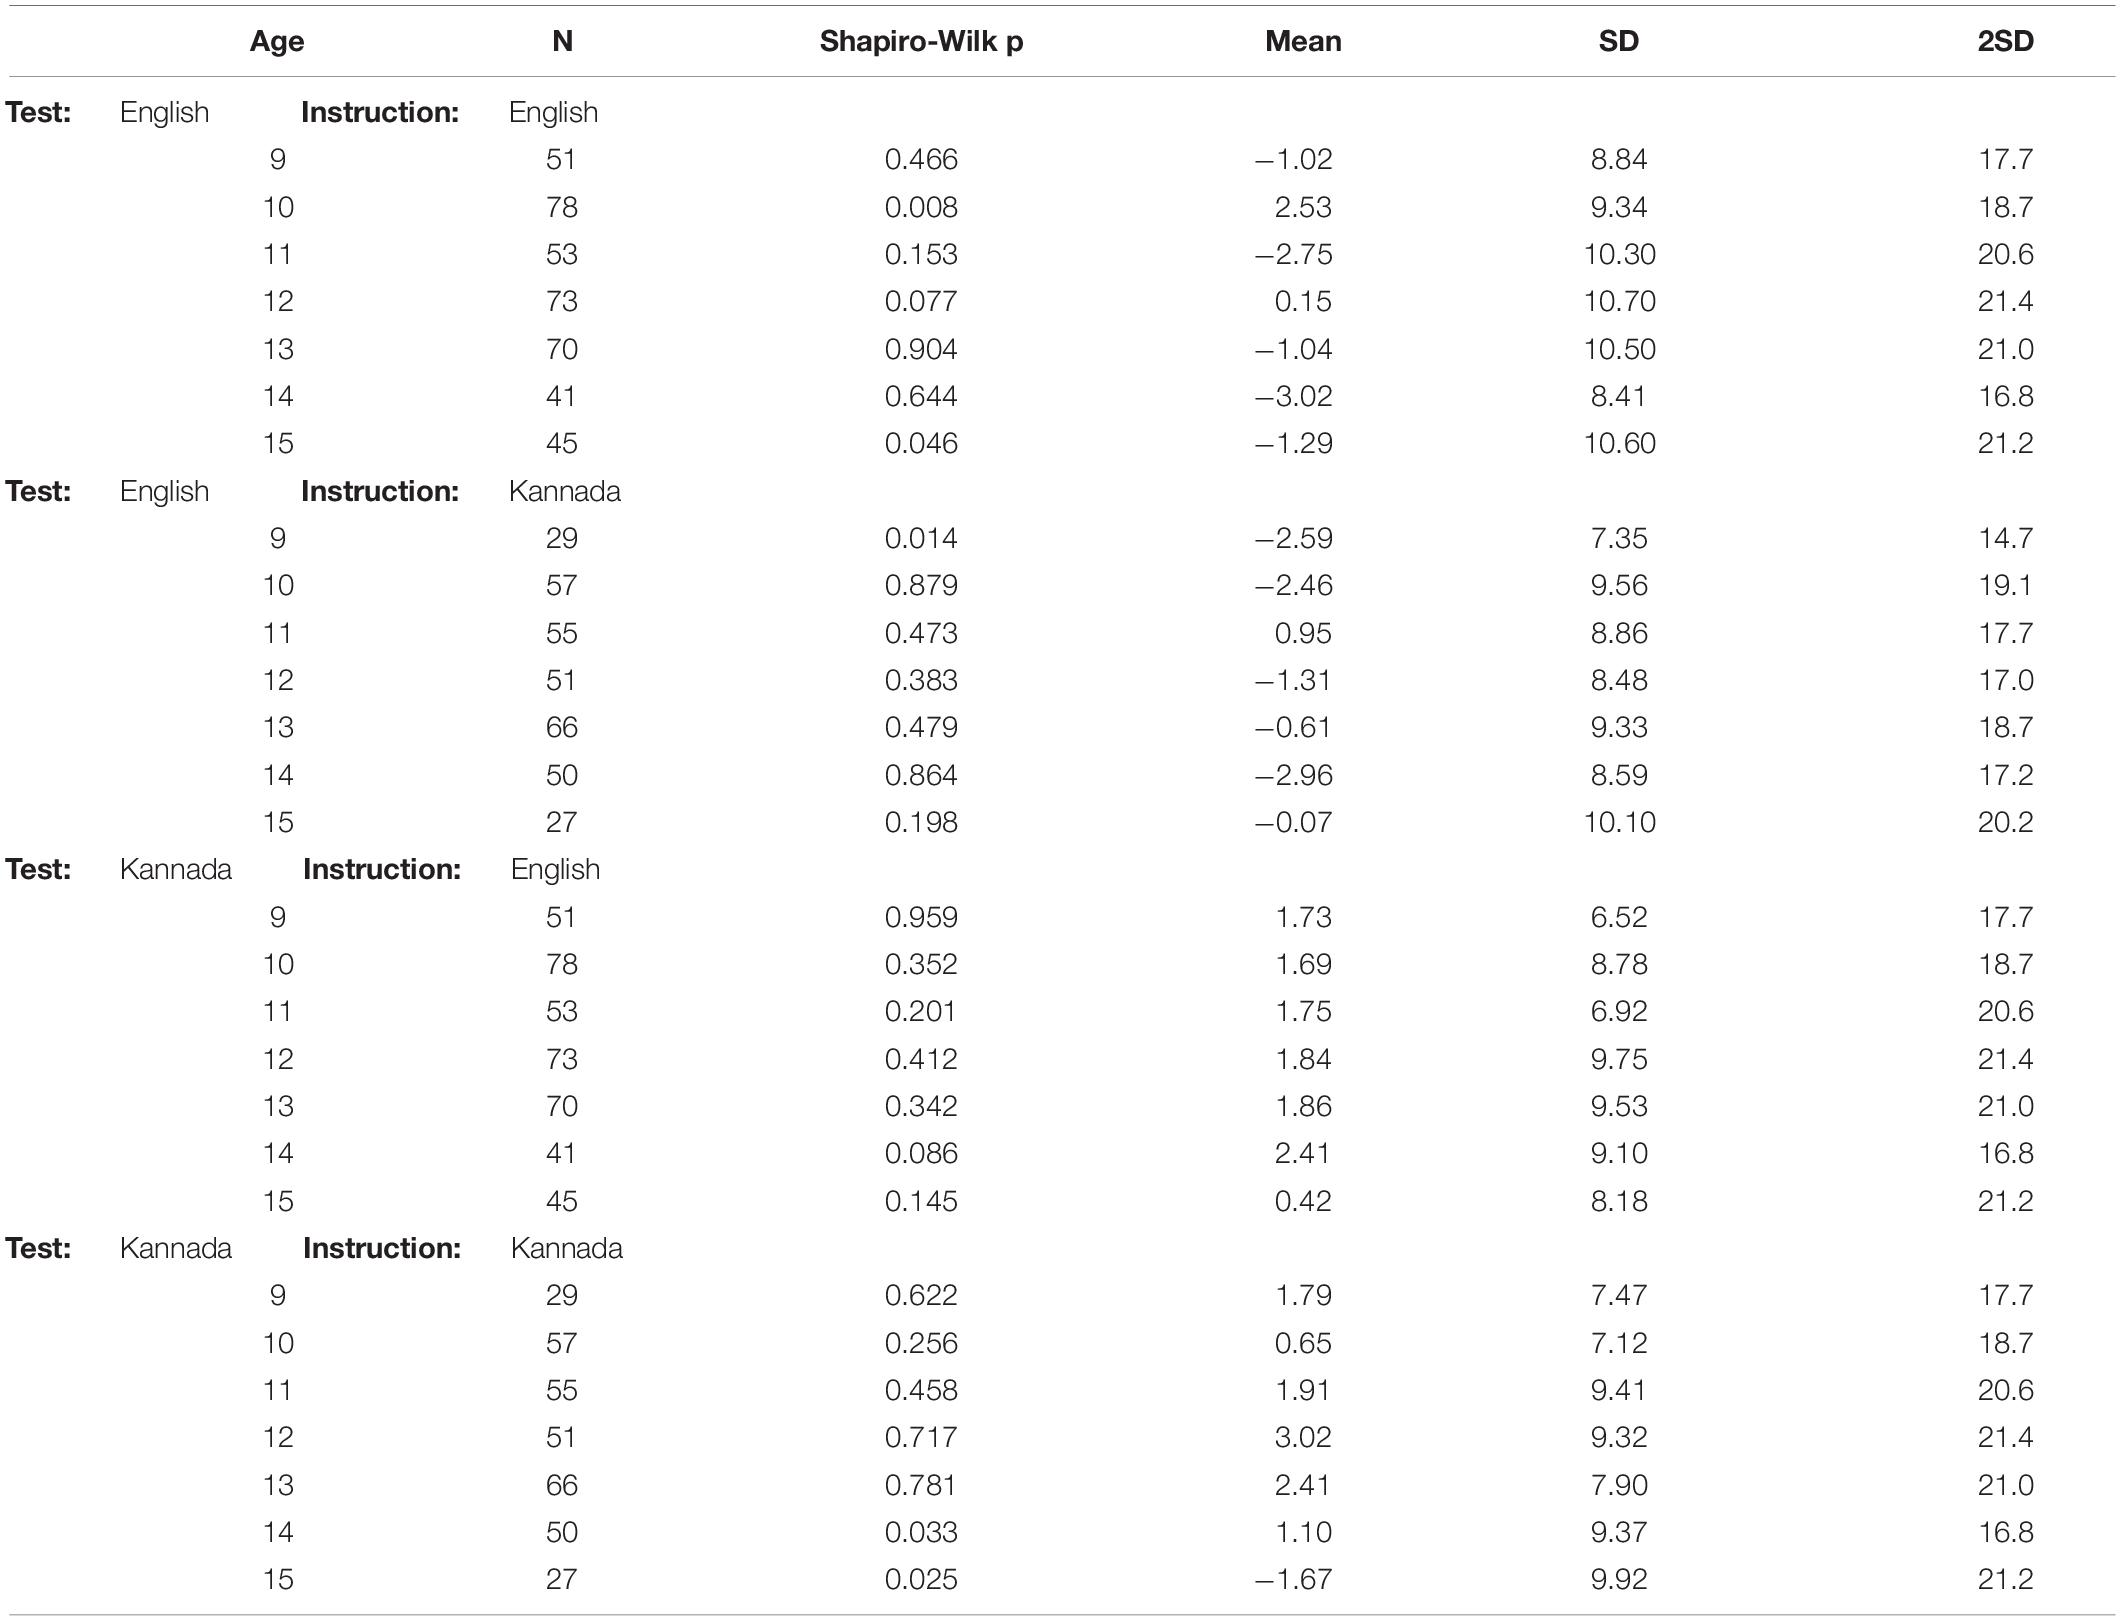
Table 5. Reading rate differences: Summary statistics, by test, medium of instruction, and age.
Using the principle that a criterion value for statistically significant change estimated from a sample of individuals should be at least 2 × standard deviation of test-retest differences (2 × SDD), we see from Table 5 that these values are very similar under all conditions and do not vary with age (see also Table 4 ANOVA). Indeed, pooling these values across ages and conditions justifies use of a single change criterion value of 20 wcpm in all circumstances.
For consistency with previous applications of the RRT, in which reading rate differences and criteria for change have been expressed as percentages of initial rates, we note here that the observed variation in reading rate with age would imply that change criteria expressed as percentages should also vary with age. Thus, by scaling the suggested fixed criterion of 20 wcpm by the reading rate means for different ages (Table 2) we propose the change criteria shown in Table 6.
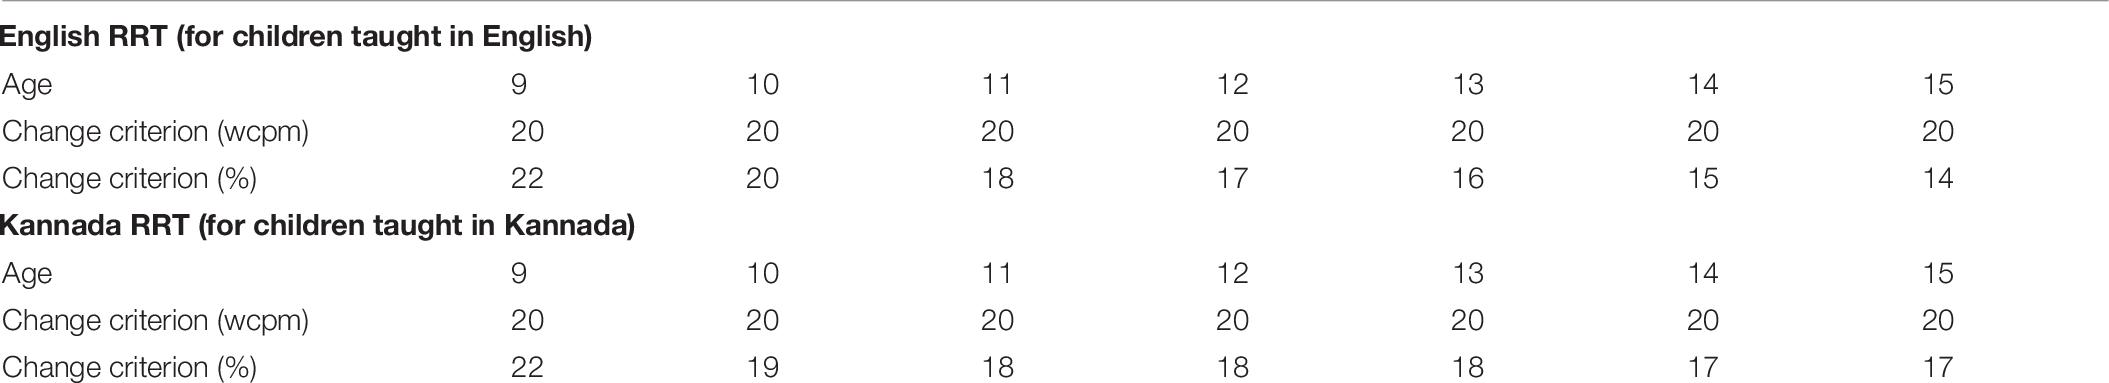
Table 6. Suggested criteria for change in reading rate, by test and age.
Discussion
We have presented a clinical test for use in southwest India with children who are taught in Kannada and English. We have provided age-related norms that will determine whether a child is reading more slowly than would be expected for their age. We have also provided norms for test-retest variability essential when the test is used to gauge the effects of an intervention aimed at improving reading speed. “Lack of reading fluency in the early grades creates inefficiencies that affect the entire educational system” (Abadzi, 2008). Therefore, it is important to choose the test appropriate for the medium of instruction and use the age-appropriate norms.
Although reading rate increases with age (Wagner et al., 1993), as might be expected, the rate of increase is different for children taught in Kannada compared to those taught in English. When children are taught primarily in Kannada, the reading speed is similar in both English and Kannada, possibly because of the slower reading of bi-syllabic words at a constant speech rhythm masking the expected faster reading in the familiar language (Verhoeven et al., 2004). When the children are taught primarily in English the rate of reading is consistently slower in the Kannada version at all ages. The reasons for this striking difference in reading rate performance between versions of the test and medium of instruction are not obvious. It is possible that children instructed in English (Figure 2A) may find the script in the Kannada RRT to be more visually demanding in terms of attending to and isolating individual words, which would result in a lower rate of reading at every age as more time is needed to process the visual information. It is also possible that there is a significant verbal effect because there are more syllables in the words of the Kannada RRT than in those of the English version. Thus, it is possible that the lower rate of reading on the Kannada RRT may reflect time taken to say the words rather than to see them, but when interpreting these data it is important to bear in mind the socioeconomic differences between children attending schools with Kannada as a primary language of instruction and children taught in English (Dreze and Kingdon, 2001; Baker et al., 2002; Borooah and Sriya, 2005). Children attending the private schools were taught primarily in English and children attending the public schools were taught primarily in Kannada.
The design principles of both the English and the Kannada rate of reading tests are such that rate of reading is not affected by vocabulary skills or language proficiency. Both the tests were designed using words common in each language (high frequency of occurrence) and the words are arranged in a random order in the test. It was designed to assess the visual aspects of reading irrespective of the semantic and syntactic knowledge. Also, one of the inclusion criteria was the ability to read correctly all the words present in both the English and Kannada tests. Therefore, a language proficiency test was not included in this study.
The “rhythm” of a typeface can be assessed using horizontal autocorrelation, the correlation of an image with a second version of itself, displaced horizontally by a small amount (lag). The mathematical technique can be understood by imagining text printed on the transparency of an overhead projector. When two identical transparencies are superimposed and in register the light transmitted through them is at its maximum (the correlation is 1.0). When the top transparency is moved horizontally across the lower one the lag increases and the transmitted light decreases (the correlation decreases), reaching a minimum when a majority of letter strokes on the top transparency are in the spaces between letters on the lower transparency. As the top transparency is moved further, and the lag increases further, the transmitted light increases (and the correlation increases), reaching a maximum when the majority of letter strokes on one transparency lie on the neighboring letter strokes on the other.
The similarity in the spatial periodicity of adjacent strokes results in high auto-correlation. The first peak in an autocorrelation analysis represents the similarity between adjacent strokes within a letter or neighboring letters. The second peak represents the similarity between neighboring letters. The speed with which words are read has been shown to depend upon the similarity between neighboring strokes of letters. Wilkins et al. (2007) showed that the height of the peak predicted the speed with which the word could be read aloud. Words with high peak were read about 10% more slowly than those with low. The peak also predicted the speed of silent visual search through a paragraph of text. Reducing the autocorrelation by compressing words near the middle and expanding them at the edges (leaving their length unchanged) increased reading speed (at least in poor readers), even though the readers preferred to read an undistorted version of the text (Wilkins et al., 2007). One of the reasons for the effects of spatial periodicity on reading speed concerned the ways in which the eyes move across text when reading.
During a rapid eye movement (saccade), one eye generally leads and the other follows, resulting in a misalignment of the eyes that requires correction when the eyes come to rest (Liversedge et al., 2006a, b). Jainta et al. (2010) measured saccades and vergence movements when their participants read German sentences. When the words had a high first peak in the horizontal autocorrelation the reading of sentences was slower because the eyes rested on each word for longer during the vergence eye movements that corrected the misalignment (vergence error). The realignment took longer with a spatially periodic word because the alignment was then more precise.
Figure 5 shows that the autocorrelation of the English version (in Times font) is considerably greater than for the Kannada (in Tunga font). Clearly the differences in the spatial rhythmicity of the orthographies and fonts are not sufficient to explain the differences in the absolute reading speed obtained using the English and the Kannada RRTs; they are not matched for factors such as word length, syllable length, and orthographic consistency.
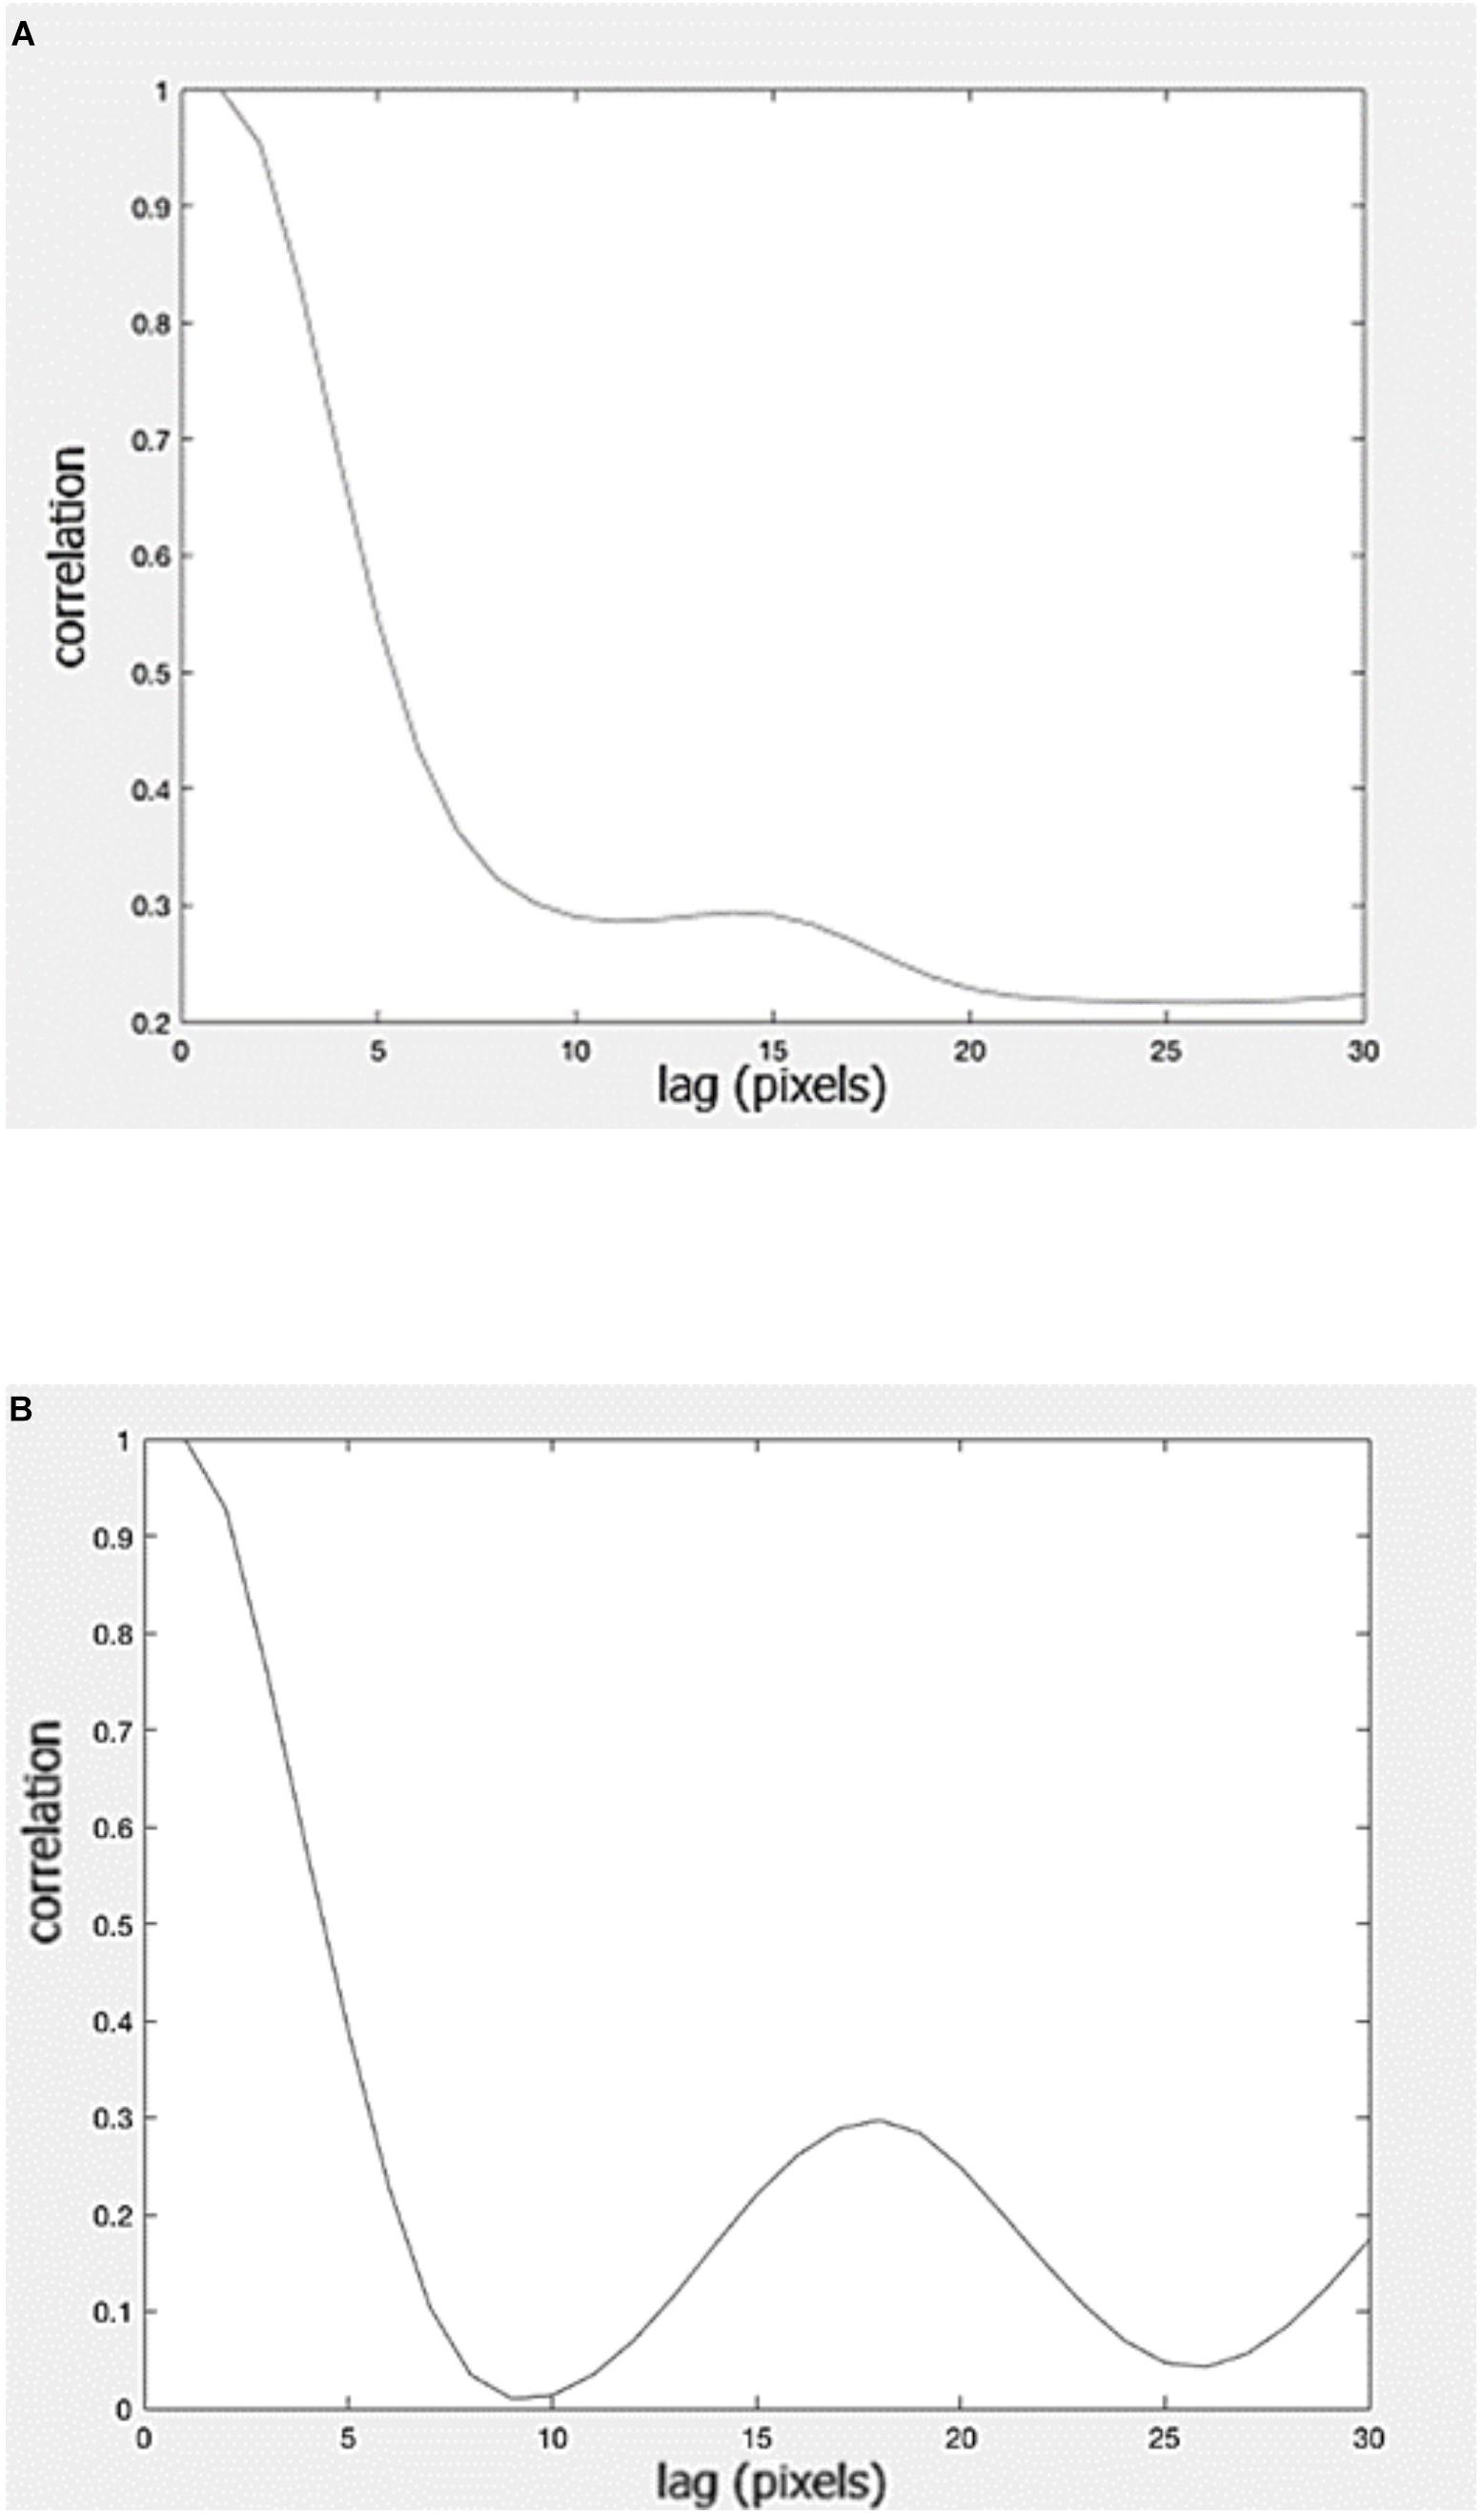
Figure 5. Autocorrelation for the entire (A) Kannada and (B) English versions of the rate of reading test.
The age-related norms we have presented here will find use in identifying children who are behind in reading speed, with the implication that vision may be a possible contributing factor. If any child has a reading score below the normal values listed herein it is clearly advisable that their vision is thoroughly assessed. The authors would recommend a comprehensive eye examination including objective and subjective refraction and a full binocular vision work-up, with a correction of any significant refractive error, or binocular vision anomaly. The norms for changes in reading speed will provide a measure of the efficacy of any visual intervention aimed at improving reading. It is important to consider the suggested age-wise criteria for defining a change with intervention that is not due to random variation. This study investigated a Kannada RRT based on the original English Wilkins RRT. When the Wilkins RRT is adapted into new languages then a similar study should be conducted in order to produce meaningful clinical norms for that test. One limitation of the study is that the illumination level was not standardized across schools as we aimed to conduct the reading tests under the existing illumination.
Data Availability
All datasets generated for this study are included in the manuscript and/or the supplementary files.
Ethics Statement
The investigations done in the study adhered to the principles of the Declaration of Helsinki. The research protocol was approved by the Research Committee of Manipal College of Health Professions and Ethics Committee of Kasturba Hospital, Manipal. Parents of all children provided written informed consent and assent was obtained from children after a verbal and a written explanation of the procedures.
Author Contributions
KS, GK, and PA conceptualized the research idea and devised the research. KS collected the data and implemented the research idea under the supervision of GK and PA. KS, JG, AW, and PA contributed to the data analysis and interpretation. PA, JG, and AW were involved in the manuscript preparation. All authors contributed to the final review of the manuscript.
Funding
This study was a non-funded research work conducted as a part of doctoral work. PA’s participation was supported by a Collaborative Research Grant from the College of Optometrists.
Conflict of Interest Statement
AW receives emoluments based on sales of the Wilkins rate of reading test.
The remaining authors declare that the research was conducted in the absence of any commercial or financial relationships that could be construed as a potential conflict of interest.
Acknowledgments
We would like to thank all the school authorities, parents, and participants for their support in this research work.
Footnotes
References
Abadzi, H. (2008). Efficient learning for the poor: new insights into literacy acquisition for children. Int. Rev. Educ. 54, 581–604. doi: 10.1007/s11159-008-9102-3
Baker, D. P., Goesling, B., and Letendre, G. K. (2002). Socioeconomic status, school quality, and national economic development. Comp. Educ. Rev. 46, 291–312. doi: 10.1086/341159
Borooah, V. K., and Sriya, I. (2005). Vidya, Veda and Varna: the influence of religion and caste on education in rural India. J. Dev. Stud. 81, 1369–1404. doi: 10.1080/00220380500186960
Dreze, J., and Kingdon, G. G. (2001). School participation in rural India. Rev. Dev. Econ. 5, 1–24. doi: 10.1111/1467-9361.00103
Jainta, S., Jaschinski, W., and Wilkins, A. J. (2010). Periodic letter strokes within a word affect fixation disparity during reading. J. Vis. 10:2. doi: 10.1167/10.13.2
Liversedge, S. P., Rayner, K., White, S. J., Findlay, J. M., and McSorley, E. (2006a). Binocular coordination of the eyes during reading. Curr. Biol. 16, 1726–1729. doi: 10.1016/j.cub.2006.07.051
Liversedge, S. P., White, S. J., Findlay, J. M., and Rayner, K. (2006b). Binocular coordination of eye movements during reading. Vis. Res. 46, 2363–2374. doi: 10.1016/j.visres.2006.01.013
O’Leary, C. I., and Evans, B. J. W. (2006). Double-masked randomised placebo-controlled trial of the effect of prismatic corrections on rate of reading and the relationship with symptoms. Ophthalmic Physiol. Opt. 26, 555–565. doi: 10.1111/j.1475-1313.2006.00400.x
O’Leary, C. I., Evans, B. J. W., and Edgar, D. F. (2014). The effect of low refractive corrections on rate of reading. Optom. Pract. 15, 87–100.
Srinivasan, K., Krishnan, G., Wilkins, A. J., and Allen, P. M. (2018). Reliability and validity of a Kannada rate of reading test. Indian J. Ophthalmol. 66, 630–633. doi: 10.4103/ijo.IJO_807_17
Verhoeven, J., De Pauw, G., and Kloots, H. (2004). Speech rate in a pluricentric language: a comparison between Dutch in Belgium and the Netherlands. Lang. Speech 47, 297–308. doi: 10.1177/00238309040470030401
Wagner, R. K., Torgesen, J. K., Laughon, P. L., Simmons, K., and Rashotte, C. (1993). Development of young readers’ phonological processing abilities. J. Educ. Psychol. 85, 85–103.
Wilkins, A. J., Jeanes, R. J., Pumfrey, P. D., and Laskier, M. (1996). Rate of reading test: its reliability, and its validity in the assessment of the effects of coloured overlays. Ophthalmic Physiol. Opt. 16, 491–497. doi: 10.1016/0275-5408(96)00028-2
Wilkins, A. J., and Lewis, E. (1999). Coloured overlays, text and texture. Perception 28, 641–650. doi: 10.1068/p2761
Wilkins, A. J., Lewis, E., Smith, F., and Rowland, E. (2001). Coloured overlays and their benefit for reading. J. Res. Read. 24, 41–64. doi: 10.1111/1467-9817.00132
Keywords: Kannada reading, clinical reference for reading, language development (source: MeSH NLM), language of instruction, reading rate progression, habitual language
Citation: Srinivasan K, Gilchrist JM, Krishnan G, Wilkins A and Allen PM (2019) Clinical Use of the Kannada and English Rate of Reading Tests. Front. Psychol. 10:2116. doi: 10.3389/fpsyg.2019.02116
Received: 27 April 2019; Accepted: 02 September 2019;
Published: 20 September 2019.
Edited by:
Sidarta Ribeiro, Federal University of Rio Grande do Norte, BrazilReviewed by:
Rupal Lovell-Patel, University of Central Lancashire, United KingdomStephen John Loew, University of New England, Australia
Copyright © 2019 Srinivasan, Gilchrist, Krishnan, Wilkins and Allen. This is an open-access article distributed under the terms of the Creative Commons Attribution License (CC BY). The use, distribution or reproduction in other forums is permitted, provided the original author(s) and the copyright owner(s) are credited and that the original publication in this journal is cited, in accordance with accepted academic practice. No use, distribution or reproduction is permitted which does not comply with these terms.
*Correspondence: Krithica Srinivasan, skrithica@yahoo.com