 N. Florence Tadi
 Kaylene Pillay1
 Ufuoma P. Ejoke
 Itumeleng P. Khumalo
- 1Department of Psychology, University of the Free State, Bloemfontein, South Africa
- 2Department of Psychology, University of Johannesburg, Johannesburg, South Africa
Adequate measurement is an essential component of the assessment of mental health disorders and symptoms such as depression and anxiety. The present study investigated sex-specific differences in the Patient Health Questionnaire-9 (PHQ-9) and Generalized Anxiety Disorder-7 (GAD-7). This comprehensive cross-sectional design study pursued four objectives: measurement invariance of PHQ-9 and GAD-7 between male and female; depression and anxiety prevalence differences; cross-sex differences in the relationship between depression and anxiety; and a comparison of symptom heterogeneity. A sample of 1966 (male = 592; female = 1374; mean age = 21 years) students from South Africa completed the PHQ-9 and the GAD-7. Data analyses for measurement invariance, latent class analysis, inter-variable correlations and group comparisons were conducted in Mplus. The two-dimensional PHQ-9 achieved scalar invariance, while the GAD-7 yielded metric invariance. The somatic and non-somatic latent dimensions of depression were compared and showed no significant difference between male and female groups. The positive relationship between depression and anxiety was also not significantly different between the two groups. While the PHQ-9 symptoms formed three classes in the male group, and four classes in the female group, the GAD-7 had the same number of classes (three) and a similar pattern between the two groups. These findings hold implications for the measurement, assessment and understanding of symptom manifestation and distribution, as well as the treatment of depression and anxiety in South Africa.
Introduction
The high prevalence of depression and anxiety is a known and generally accepted reality worldwide, affecting countries ranging from the African region to Euro-American settings, and across degrees of wealth capital (Chisholm et al., 2016; Alonso et al., 2018; Charlson et al., 2019). This is such a universal phenomenon that Scorza et al.’s (2018) study concluded that there were fewer differences in cross-national prevalence than previously thought. Not only is the experience of depression and/or anxiety responsible for major disability in the affected individuals (Whiteford et al., 2013), but it is also detrimental to the economies of the world, and poses a significant disease burden on national healthcare systems (Chisholm et al., 2016). The high disease burden accounted for by mental disorders and other neurological and substance-use disorders bears consequences for government budgets and would overwhelm the systems of mental healthcare (Whiteford et al., 2015; Chisholm et al., 2016).
More specifically, depression is the second largest contributor to the non-fatal disease burden globally (Scorza et al., 2018), while generalized anxiety is the most commonly presenting form of anxiety pathology in the general population (Spitzer et al., 2006). Most research and intervention efforts toward understanding, preventing and treating depression and anxiety rely on accurate and dependable assessment and measurement procedures. Thus, the present study makes the case for the acute need for adequate sex-specific measurement properties of depression and anxiety in a South African context (see Makhubela, 2021).
Mental disorders, especially depression and anxiety, affect a significant proportion of the South African population, forming an upward trend that is expected to increase (Van der Walt et al., 2020; Rousseau et al., 2021). South Africa is categorized as an upper-middle income country (Evans-Lacko et al., 2018; Scorza et al., 2018), characterized by many social ills, including poverty, income inequality and high unemployment, which affect the mental health of its citizens. Except for a limited number of studies, not the least being those of Makhubela (2016, 2021), Makhubela and Debusho (2016), Schneider et al. (2015) and Makhubela and Khumalo (2022), there is insufficient research on the dynamics of depression and anxiety assessment in South Africa. Nonetheless, the contribution of these studies is worth noting. Makhubela (2021) used network analysis to investigate the interaction of depressive and anxiety symptoms, and their gender differences, finding no significant gender differences in the depression networks. Mosotho et al.’s (2008) inquiry into depression among Sesotho-speaking people in South Africa found that depression mainly presents in the form of somatic symptoms, perceptual disturbances and disturbances of the thought processes. As it is clear from the reviewed literature, the question of how sex accounts for depression and anxiety assessment, using the Patient Health Questionnaire-9 (PHQ-9) and the Generalized Anxiety Disorder-7 (GAD-7) in South Africa, remains to be explored.
Based on the socio-environmental factors, such as poverty, civil unrest, cultural diversity and sex inequality, which characterize the landscape of developing countries, it may be plausible to ascribe higher rates of mental disorders and their disease burden to female rather than male persons (Patel et al., 2001). Both gender and sex disproportionately place women at greater exposure to mental disorders (Riecher-Rössler, 2017; Keng et al., 2019). International literature on psychiatric epidemiology has been consistent in reporting sex and gender differences in mental disorders (McLean et al., 2011; Riecher-Rössler, 2017). The gender gap in mental disorders, specifically depression (Kuehner, 2017) and anxiety (Li and Graham, 2017), shows that women are more likely to develop depression and/or anxiety than men. As much as there may be some international data (e.g., Kuehner, 2017; Li and Graham, 2017) indicating the causes of gender and sex differences, such determinations are not so clear in certain contexts like South Africa. In this regard, Makhubela (2016) has opined that the reasons for gender differences are not yet understood. However, in addition to the biological, cultural, environmental and regional/national factors, an often neglected potential reason for group differences in the performance of measuring instruments is non-invariance (Scorza et al., 2018). Although the overlap between biologically assigned/identifying sex and the socially constructed gender is recognized, the present study is concerned with the variable of sex as male and female. Thus, gender and sex are not to be used nor interpreted in an interchangeable fashion.
For this study, we chose, for several reasons, the PHQ-9; (Kroenke et al., 2001; Kroenke and Spitzer, 2002) and the Generalized Anxiety Disorder-7 (GAD-7; Spitzer et al., 2006) as measures for depression and anxiety, respectively. The PHQ-9 and GAD-7 are widely used measures for screening (Teymoori et al., 2020a,b; Borgogna et al., 2021). Their items correspond with the DSM assigned symptoms for depression and generalized anxiety, respectively (Kroenke et al., 2001; Kroenke and Spitzer, 2002; Spitzer et al., 2006; Baas et al., 2011). They were developed as brief self-report screening tools which could be applied in both the general population and clinical settings. Many studies across the world have demonstrated the psychometric properties of the PHQ-9, and have either confirmed a unidimensional structure (e.g., Baas et al., 2011; Bhana et al., 2015; Galenkamp et al., 2017) or a two-dimensional structure of depression categorized into somatic symptoms and non-somatic symptoms (Kendel et al., 2010; Elhai et al., 2012; Forkmann et al., 2013; Beard et al., 2016; Makhubela and Khumalo, 2022). The present study operationalizes depression as comprising somatic and non-somatic depression components. On the other hand, based on the DSM stipulated symptoms of generalized anxiety, the GAD-7 was designed and developed as a brief self-report scale to identify probable cases of GAD (Spitzer et al., 2006). The unidimensional model of the anxiety measure, also used in the present study, has been found to be psychometrically sound (Teymoori et al., 2020b).
Beyond intragroup variations in the determinants and outcomes of depression and anxiety, it is also important to evaluate the intergroup mean comparisons. Such evaluations require measurement invariance, without which the claimed group differences in the scores of measured latent constructs become misleading and without meaning (Cheung and Rensvold, 2002; Chen, 2008; Baas et al., 2011). Measurement invariance, which refers to “the equivalence of a measured construct in two or more groups” (Chen, 2008, p. 1005), assumes that when scale scores are compared, the measuring instrument used measures the same construct across the groups of interest (Chen, 2008). When referring to cross-national comparisons, Scorza et al. (2018) have warned that some of the differences may be a function of non-invariance. To ascertain whether scores on the PHQ-9 and GAD-7 were a function of gender-dependent responding, Borgogna et al. (2021) tested their measurement invariance across 16 gender and sexual minority groups. They found that only cisgender men and women evidenced residual invariance on the PHQ-9; while for the GAD-7, scalar or partial scalar invariance was achieved for most groups (Borgogna et al., 2021). In South Africa, Makhubela (2016) found the Beck Depression Inventory to have scalar invariance, except for two non-invariant items, across race.
The group-specific distribution of symptoms, especially the natural clustering, is a relatively neglected area in the measurement and assessment of mental health. Latent class analysis (LCA) is a person-centered multivariate analysis approach used to elicit naturally occurring unobserved (latent) groupings of participants based on their similarity of categorical endorsement of indicator variables (Rosato and Baer, 2012; Skidmore et al., 2018). Thus, it “uses indicator variables to identify underlying classes of persons in a population” (Skidmore et al., 2018, p. 1246). One of the reasons advanced for the value and importance of performing person-centered analyses such as LCA is their ability to explore atypical presentations and clustering of symptoms as indicator variables (Sullivan et al., 1998; Moreno and Andrade, 2010). Applied to research questions relating to sex differences, LCA has shown significant utility. Whalen et al. (2016) used LCA to study the longitudinal trajectories of depressive symptoms in boys and girls, and found different patterns between the groups. While in girls, high depressive severity remained stable over time, in boys it showed a pattern of fluctuation. In another study, Ploubidis et al. (2007) used LCA to study responses to the General Health Questionnaire (GHQ) and arrived at three latent classes for men and women. While the GHQ indicator variables of self-confidence, perception of work-life, and opportunities to share feelings distinguished the latent groups among women; among the men the variables of work satisfaction and opportunities to share feelings highlighted the differences across groups (Ploubidis et al., 2007).
A vast array of literature across many fields concerned with mental health has continued to be concerned with the issue of the prevalence and nature of the presentation of depression and anxiety symptoms between the sexes. Thus, it is important to explicate the concepts of gender and sex, as well as their difference, overlap and interaction (Phillips, 2005; Afifi, 2007; Regitz-Zagrosek, 2012). While sex refers to biological indicators, gender is an expression of social factors such as powerlessness, access to resources and constrained roles, thus making gender a social rather than a biological construct (Phillips, 2005). The question of whether differences in the measurement of depression and anxiety are a function of gender and sex is important because it may inform decisions regarding measurement in gender-specific (mental) healthcare (Regitz-Zagrosek, 2012). Research has observed the gender gap in a number of psychological phenomena and circumstances of psychological adjustment. Examples include school engagement and teacher support for autonomy between boys and girls in Belgium (Lietaert et al., 2015); acculturation and the contribution of acculturative stress to depression among Latino college students in universities in the United States (Castillo et al., 2015); and in India, Sharma and Kirmani (2013) found reports of more depression and anxiety symptoms among female than male college students.
The present study applied assessment, measurement and statistical data analysis to explore the psychometric functioning of the measures of depression (PHQ-9) and anxiety (GAD-7) to understand sex differences in the symptom manifestation of the two disorders. In other words, we employed a comprehensive psychometric measurement approach to evaluate how, if at all, sex show differences in the measurement of depression and anxiety symptoms in a group of university students in South Africa. The study focused on equivalence, symptom heterogeneity, the relationship between the two conditions, and a comparison of symptom prevalence between male and female individuals. This aim and focus were underpinned by four specific objectives. The first objective was to investigate the measurement invariance of the PHQ-9 and the GAD-7 separately between the two groups. Following a result of measurement invariance, the second objective was to investigate the depression and anxiety mean score differences between males and females. In the third objective, the strength and direction of the association between depression and anxiety were compared for males and females. The fourth objective was concerned with investigating the homogeneous grouping of symptoms, using LCA, for each group and then comparing emergent profiles between them. Achievement of these objectives presents several contributions to the body of knowledge and practice. Sex-specific measurement, symptom presentation and distribution, and the correct recognition and identification of symptoms (Thai Quynh-Chi et al., 2021) are some of the areas of benefit. The inquiry findings could be useful to policymakers in informing their decisions regarding investment in mental health interventions (see Scorza et al., 2018) in South Africa.
Materials and Methods
Participants and Setting
An online cross-sectional survey was conducted among university students, through convenience sampling at a university in South Africa. The online data collection exercise ran for 2 days, and was stopped when the response rate had significantly slowed down. Although 2070 students returned the online questionnaires, only 1988 completed the PHQ-9 and GAD-7 responses in full and were included in this study. Based on frequency analysis, no specific response pattern was observed between the complete and included, and the incomplete and excluded, cases. A further 22 participants who did not indicate their gender/sex were excluded, thus resulting in a sample of 1966 participants. Of these, 592 were male (29.8%; average age 21.67, SD = 2.986; ranging from 17 to 44) and 1374 were female (69.1%; average age 21.34, SD = 3.150; ranging from 17 to 64).
Measuring Instruments
The Patient Health Questionnaire-9
The Patient Health Questionnaire-9 (Kroenke et al., 2001; Kroenke and Spitzer, 2002). The PHQ-9 was designed as an individual level screening tool to determine the presence and severity of depressive symptoms through the frequency of occurrence in the preceding two-week period. We used the self-report computer-based version. As a unidimensional measure, the PHQ-9 has been found to have good construct validity and reliability (e.g., Kroenke et al., 2001; Monahan et al., 2009; Baas et al., 2011; Bhana et al., 2015). In the original study, Kroenke et al. (2001) reported Cronbach’s alpha coefficients of between 0.86 and 0.89. In Kenya, Monahan et al. (2009) found reliability alpha coefficient of 0.78. In a South African sample of chronic care patients, Bhana et al. (2015) found a Cronbach’s alpha of 0.76 for the PHQ-9. Some studies have explored the construct validity of the PHQ-9 without assuming unidimensionality. For example, Elhai et al. (2012) found somatic and non-somatic factors. Galenkamp et al. (2017) also found good fit regarding this two-factor model. In a recent sub-Saharan study, Makhubela and Khumalo (2022) found the PHQ-9 to be reliable, valid, and invariant in and across three countries, namely South Africa, Kenya, and Ghana. In the present study, the measurement model consisting of two factors yielded a better fit (CFI = 0.968; TLI = 0.958). As seen in Figure 1, this model was improved by correlating the residual errors of items 6 (thoughts of self as failure) and 9 (suicide thoughts), resulting in a modification index (MI) of 63.081, and an expected parameter change (EPC) of 0.168. The somatic factor (3 items) had an omega reliability index of 0.730, while the non-somatic factor (6 items) had one of 0.800.
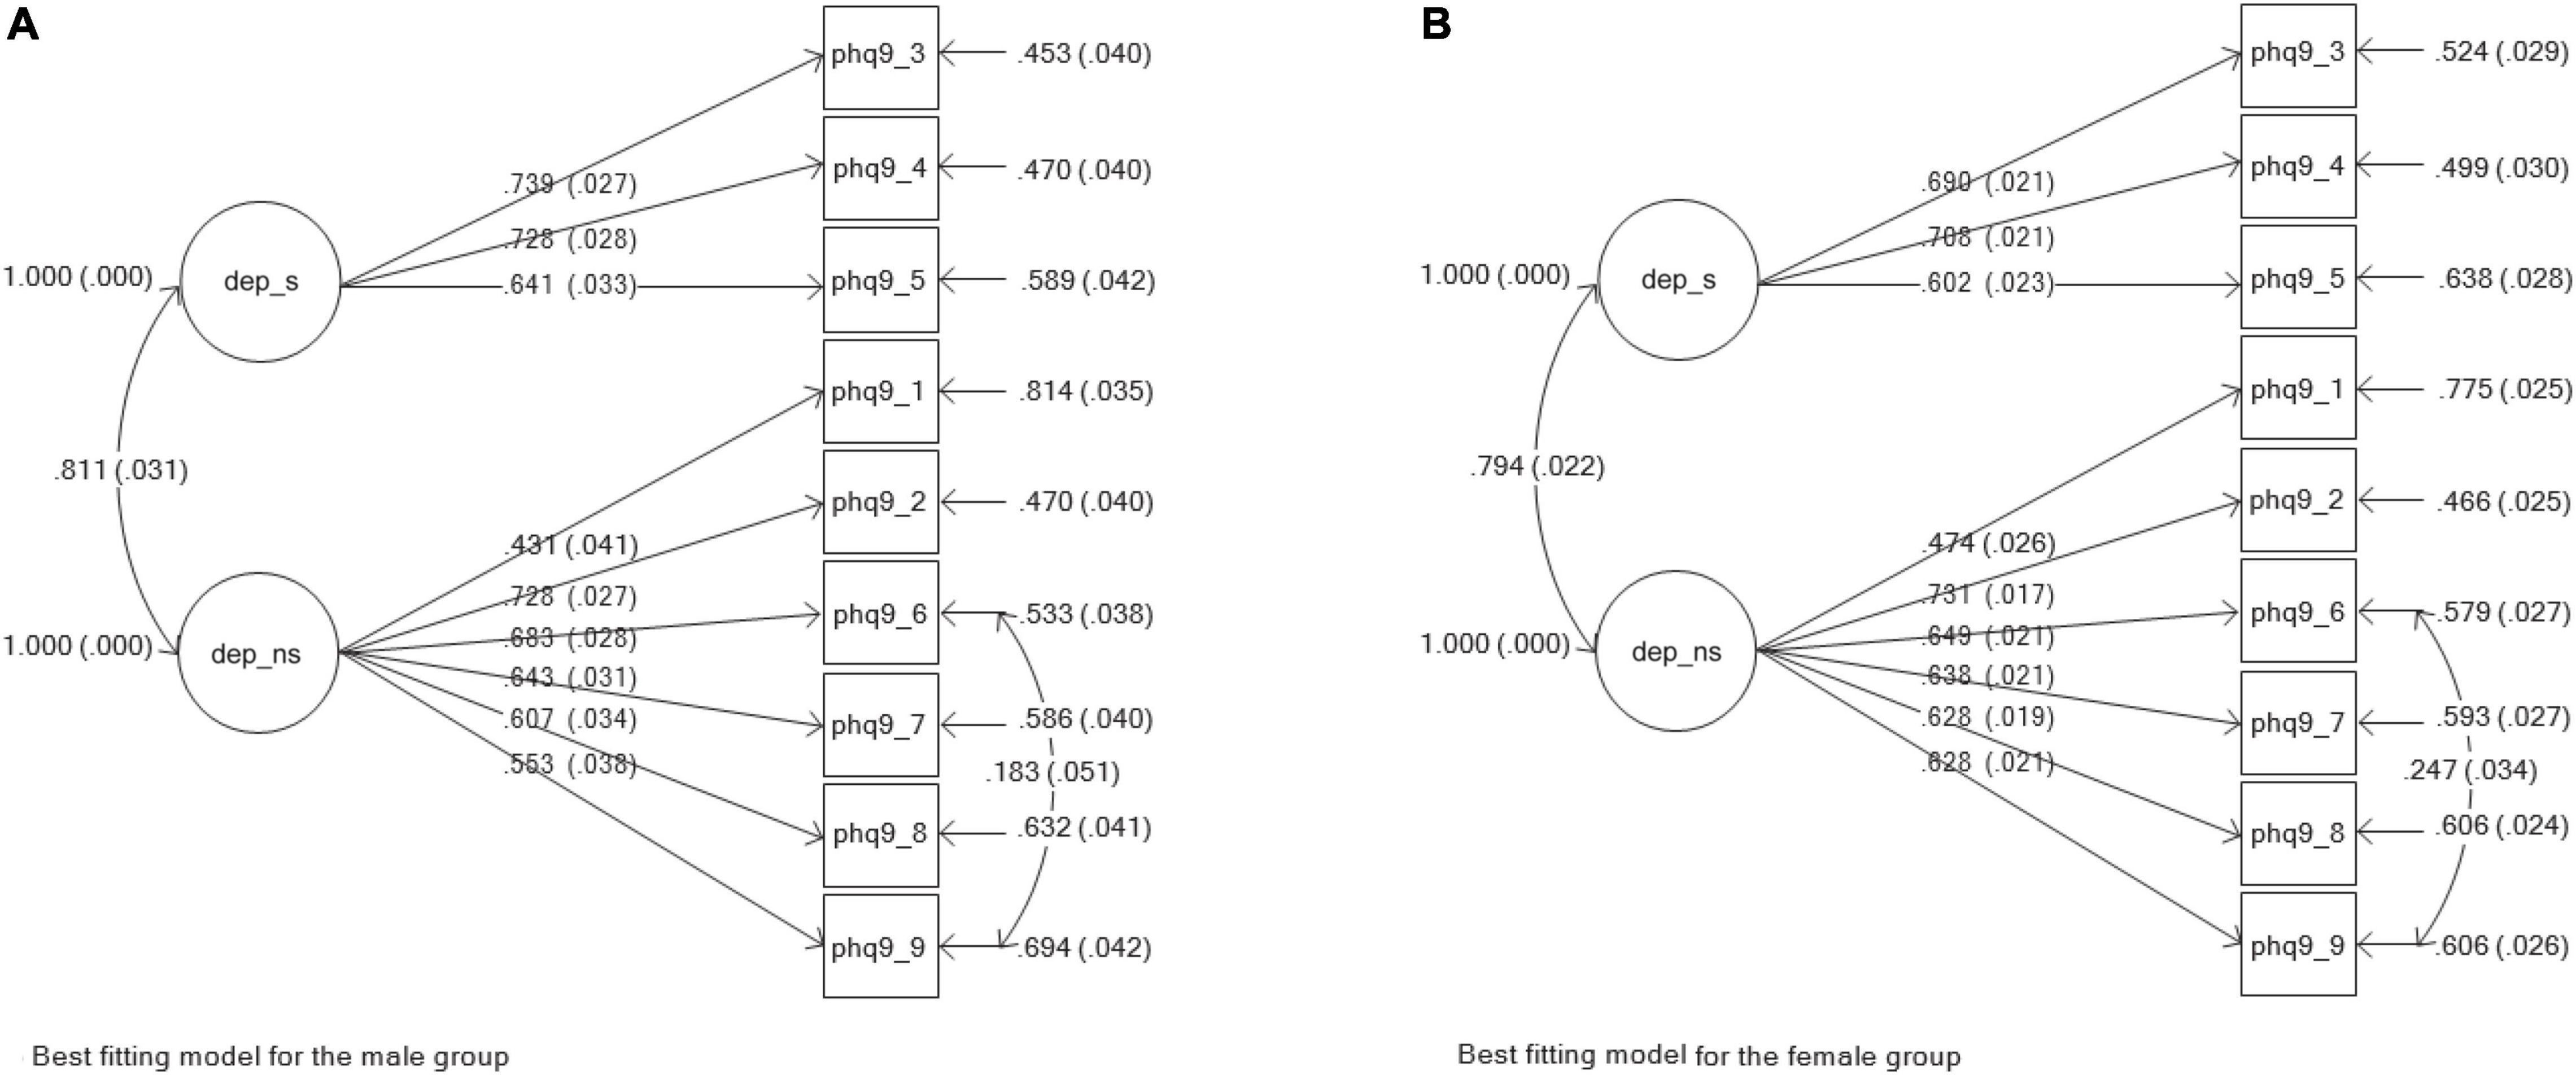
Figure 1. Best fitting models for the measuring instrument of depression (PHO-9). (A) Best fitting model for the male group. (B) Best fitting model for the female group.
Generalized Anxiety Disorder Scale
Generalized Anxiety Disorder scale (Spitzer et al., 2006). The GAD-7 was designed as a brief self-report scale to identify generalized anxiety and assess the severity of symptoms in individuals over the preceding two-week period. Its development and initial validation took place among primary care clinic patients in the US. From this original study, Spitzer et al. (2006) found good validity and reliability. They reported good construct, convergent and divergent validity, as well as a Cronbach’s alpha reliability coefficient of 0.92 and a test-retest interclass correlation of 0.83. Henn and Morgan (2019) validated the GAD-7 in a non-clinical sample of employees in South Africa. They found a good model fit for a one-factor model and reported evidence of discriminant and convergent validity. They also reported a high Cronbach’s alpha coefficient of 0.92. In the present study, the originally intended unidimensional measurement model yielded good fit (CFI = 0.950; TLI = 0.926) and a reliability index of 0.892.
Procedure and Ethical Aspects
Data were collected online from participants who were all above the age of 18 years. The research process was governed by the research ethics principles as provided in the Declaration of Helsinki (World Medical Association [WMA], 2013) and by the South African Department of Health [DOH] (2014, 2015). This included voluntary participation, confidentiality and anonymity, and post-research care. The Research Ethics Committee of the University of the Free State provided ethical clearance (UFS-HSD2019/1941/2407).
Data Analysis
Construct Validity and Reliability
The omega reliability coefficient was used to compute Structural Equation Modelling (SEM)-based reliability estimates (Raykov, 2004, 2009) of the best fitting measurement models, thus considering the possibility that items could have had correlated errors, as well as unequal factor loadings, in addition to having varying degrees of contribution to the latent factor (Gu et al., 2013). Construct validity was investigated by estimating and finding the best fitting measurement models for the PHQ-9 and GAD-7 for the whole group and for males and females separately. We used the robust maximum likelihood (MLR) estimation (Kline, 2011) in Mplus (version 8.1; Muthén and Muthén, 1998/2017). We used the guidelines stipulated by Hu and Bentler (1999) and recommended by Kline (2011), Byrne (2012) among others. Good fit was therefore shown by smaller and insignificant chi square (χ2), a root mean square error of approximation (RMSEA) and a standardized root mean square residual (SRMR) of less than 0.06; a comparative fit index (CFI) of more than 0.95; a Tucker-Lewis index (TLI) of more than 0.95; a smaller Akaike information criterion (AIC) and a smaller Bayesian information criterion (BIC).
Measurement Invariance
After establishing the separate well-fitting baseline models, the one-step procedure using the “model is configural scalar metric” Mplus command was implemented (Byrne, 2012; Van de Schoot et al., 2012; Wang and Wang, 2012). This step involved testing for configural, metric and scalar invariance for the two gender groups using a uniform model. The following fit indices were used to examine the fit of the models: the absolute fit indexes – chi-square (χ2), AIC and BIC; and the comparative fit indexes – CFI, TLI, RMSEA and SRMR. Good fit is indicated by a higher BIC and AIC; a CFI and TLI lower than or equal to 0.90; a 90% confidence interval; an RMSEA of less than 0.06; and an SRMR of less than or equal to 0.08. Two criteria were used for determining invariance, namely the change in chi-square (Δχ2) and the change in CFI (ΔCFI). Measurement invariance is expected to be demonstrated by a ΔCFI of not more than 0.01, and a non-significant Δχ2 (Cheung and Rensvold, 2002; Byrne and Van de Vijver, 2010). However, Δχ2 is known to be sensitive to sample size (Cheung and Rensvold, 2002; Joshanloo et al., 2013) and thus we placed greater emphasis on the interpretation of ΔCFI.
Latent Variable Mean Score and Inter-Variable Correlation Comparison
Descriptive statistics, including mean scores, skewness and kurtosis values, were computed for the whole group, and for males and females separately. The Pearson correlation coefficient was used to determine the size and significance of the relationship between the latent variables of depression and anxiety. Both mean scores (in the case of scalar invariance – assumption of equivalent means) and correlations (in the case of metric invariance – assumption of similar item-to-factor loadings) were compared between males and females.
Latent Class Analysis
For the male and female groups separately, we conducted LCA to identify and compare the naturally occurring latent profiles of depression and anxiety. The best fitting models were chosen on the basis of BIC, sample size adjusted BIC (SSABIC), AIC being lower, and the likelihood ratio chi-square (LRχ2) lower and not significant, but a statistically significant Lo-Mendell-Rubin adjusted likelihood ratio test (LMR-LRT) and Parametric bootstrapped likelihood ratio test (PB-LRT) (Nylund et al., 2007).
Results
Measuring Depression and Anxiety: Estimating the Measurement Models
The two-factor model of depression symptoms, as measured using the PHQ-9, was fitted to the data, firstly involving the whole sample and secondly for separate male and female groups. As displayed in Table 1, all three models showed good to excellent fit (whole group: CFI = 0.956; TLI = 0.939; Male: CFI = 0.974; TLI = 0.964; female: CFI = 0.948; TLI = 0.928). Figure 1 illustrates the PHQ-9 model for males (a) and females (b); factor loadings are also displayed in the figure.
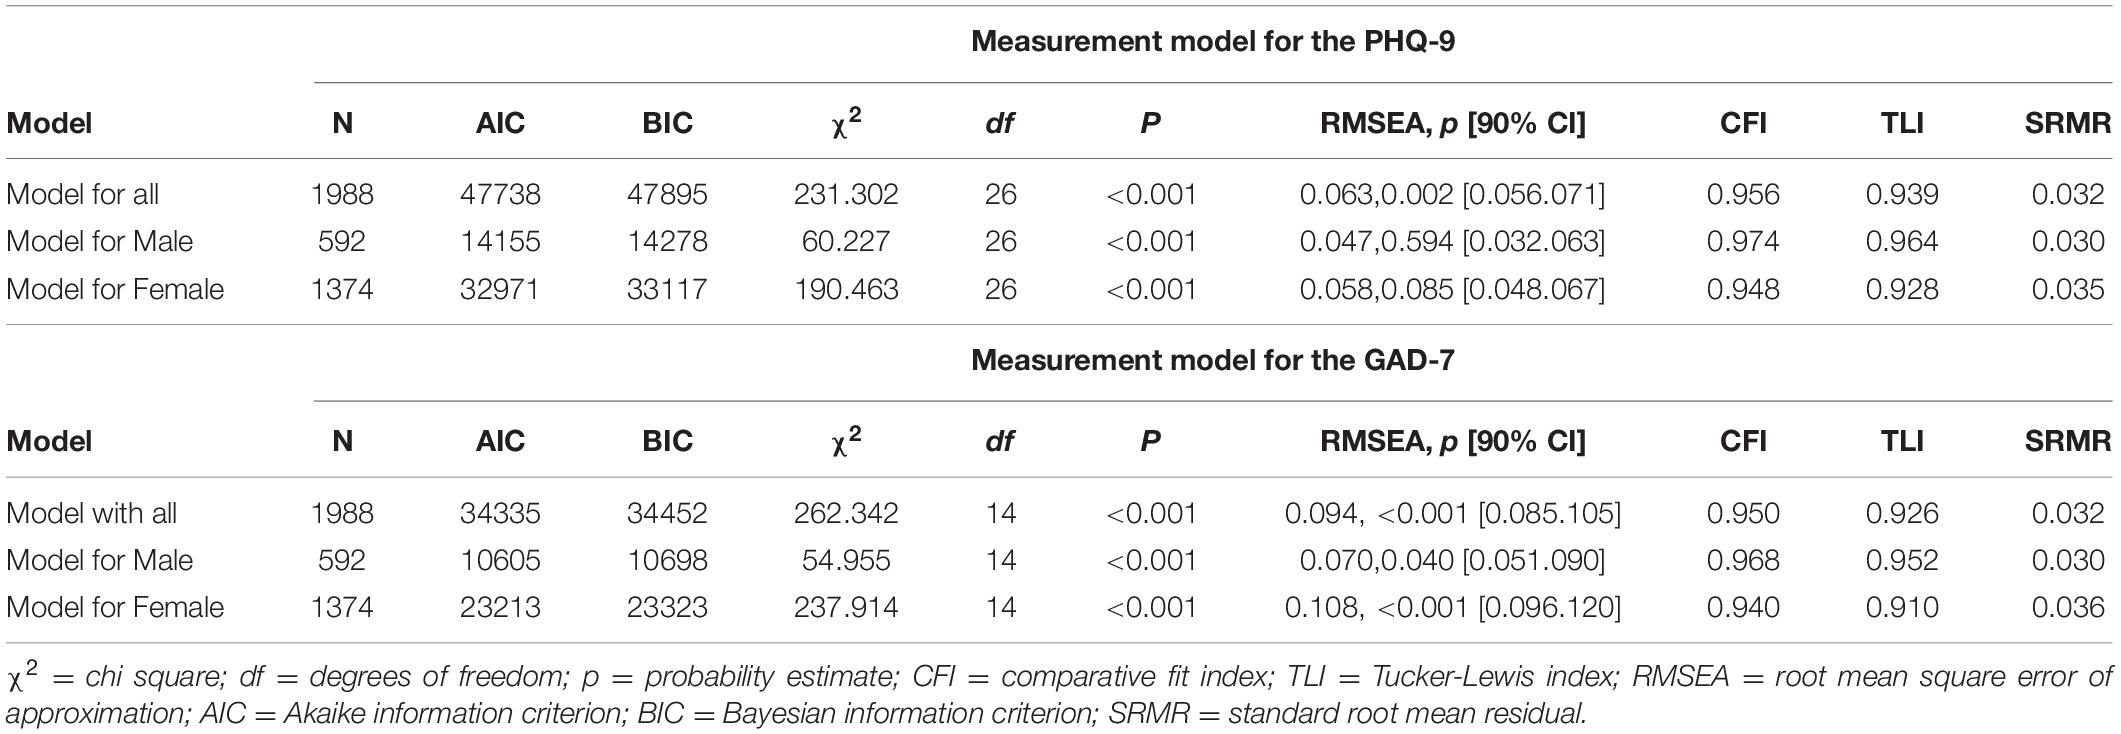
Table 1. Measurement models.
Good model fit was also found for the unidimensional model of anxiety symptoms, as measured by the GAD-7 (whole group: CFI = 0.950; TLI = 0.926; male: CFI = 0.968; TLI = 0.952; female: CFI = 0.940; TLI = 0.910). These models formed the baseline models with which we could begin testing for measurement invariance. Figure 2 illustrates the GAD-7 model for males (a) and females (b); factor loadings are also displayed in the figure.
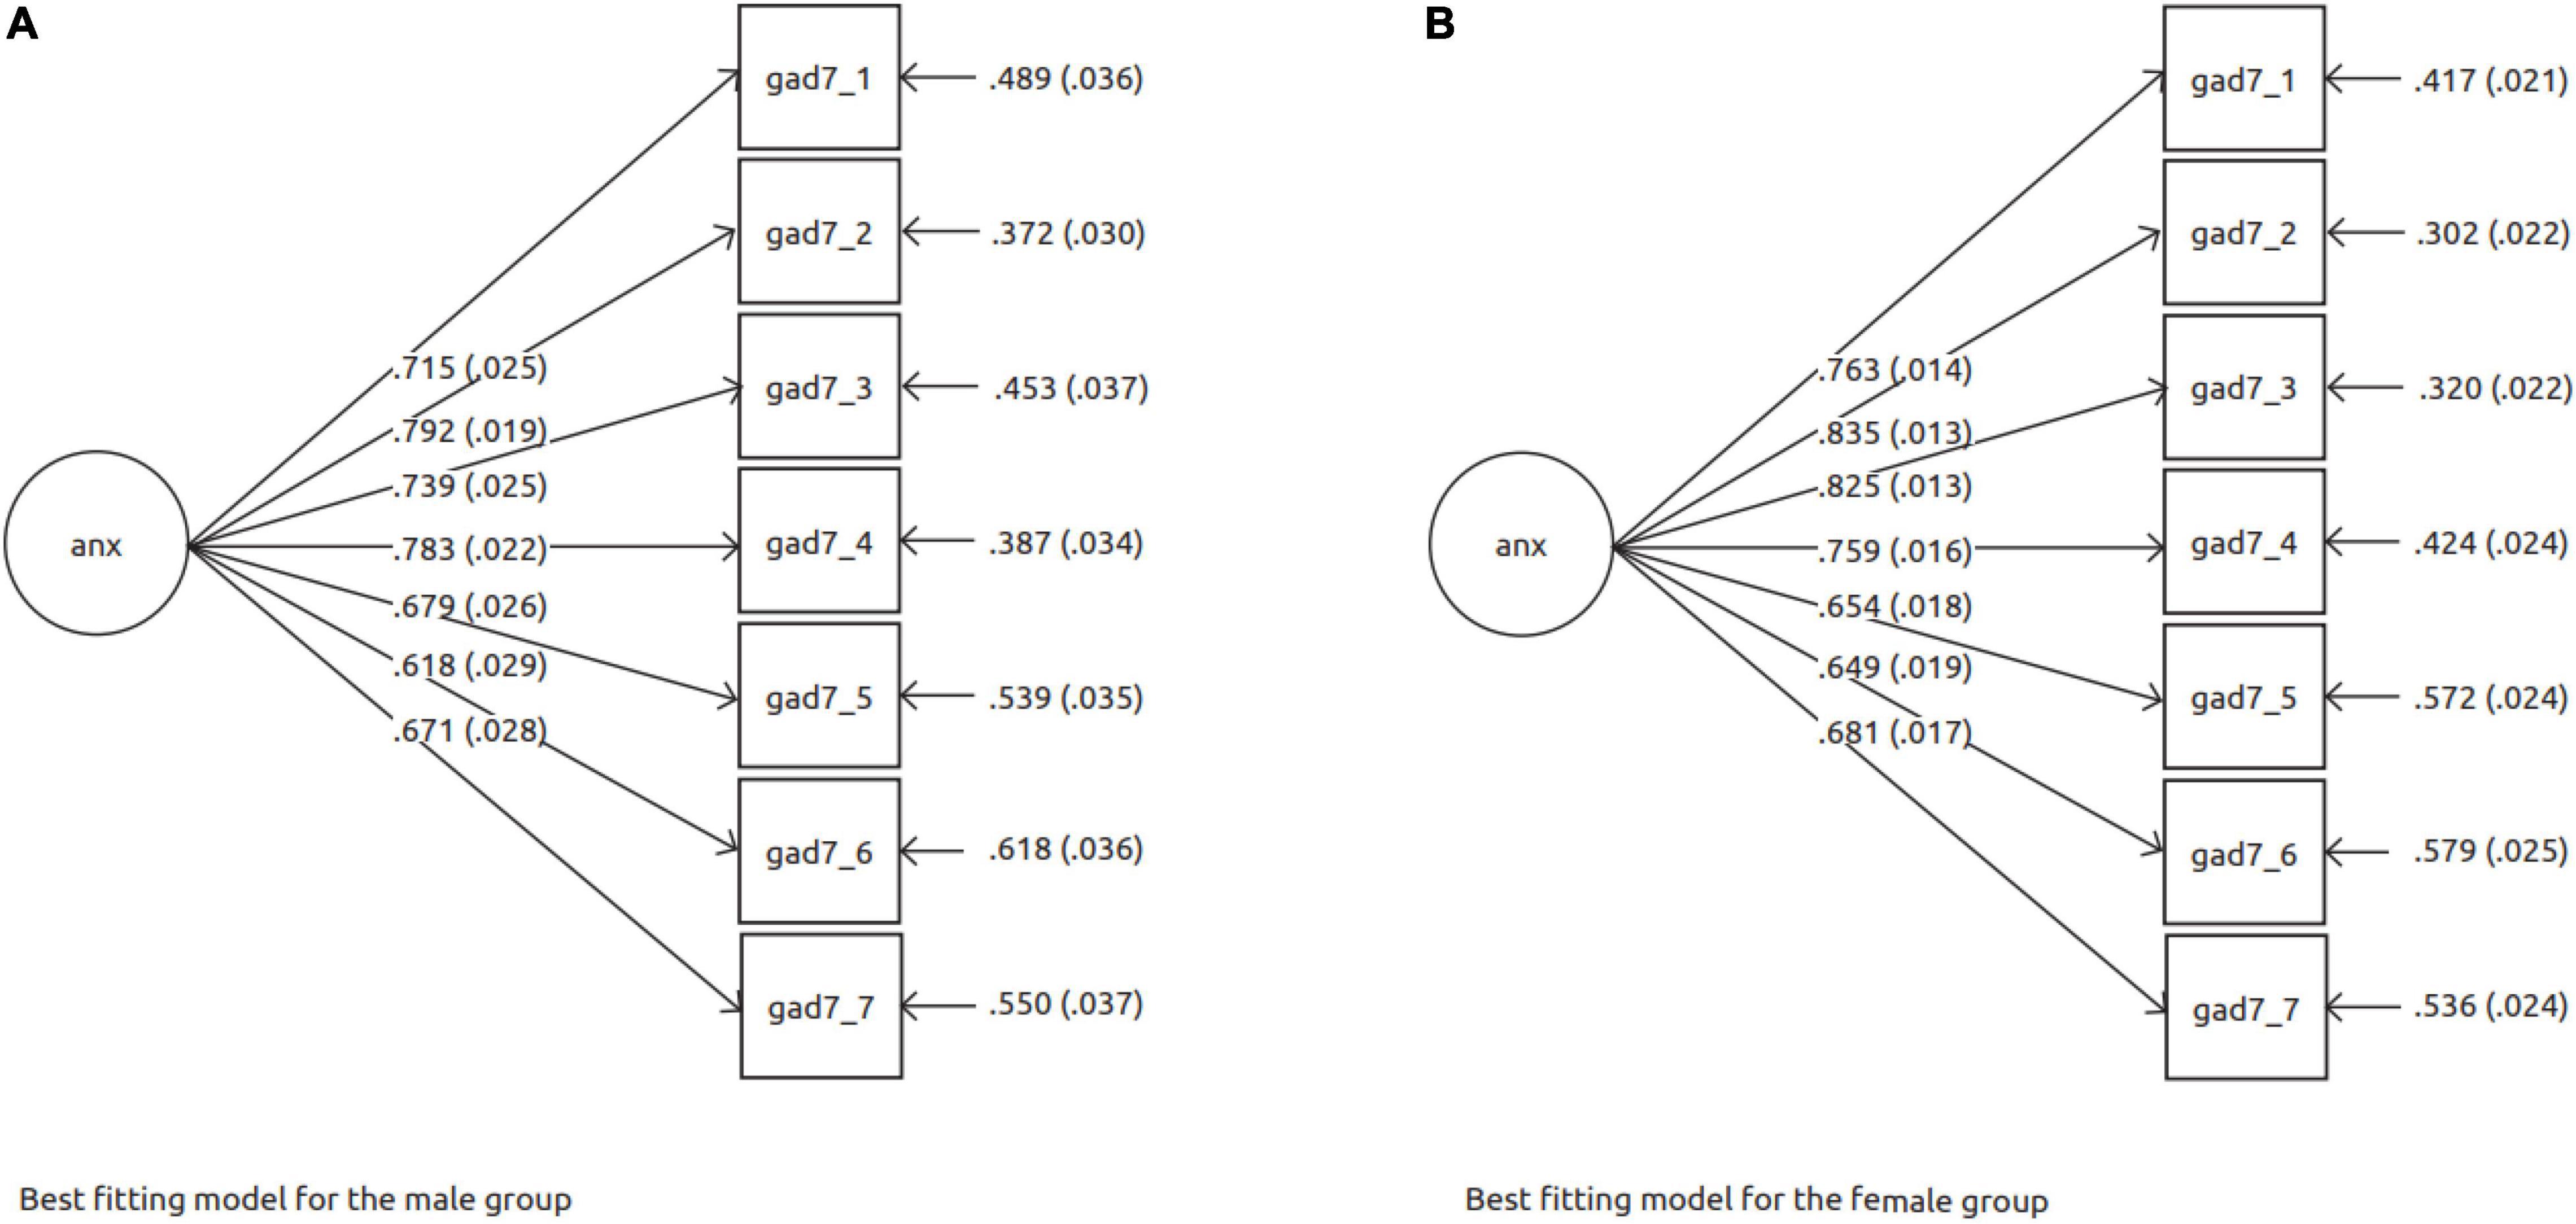
Figure 2. Best fitting models for the measuring instrument of anxiety (GAD-7). (A) Best fitting model for the male group. (B) Best fitting model for the female group.
Measurement Invariance Between the Gender Groups for the Depression and Anxiety Measures
The one-step procedure in Mplus for investigating measurement invariance (Van de Schoot et al., 2012) by testing for configural, metric and scalar invariance was used for the PHQ-9 and GAD-7. As seen in Table 2, the results showed full scalar invariance for the PHQ-9 model, but only metric invariance for the GAD-7 model.
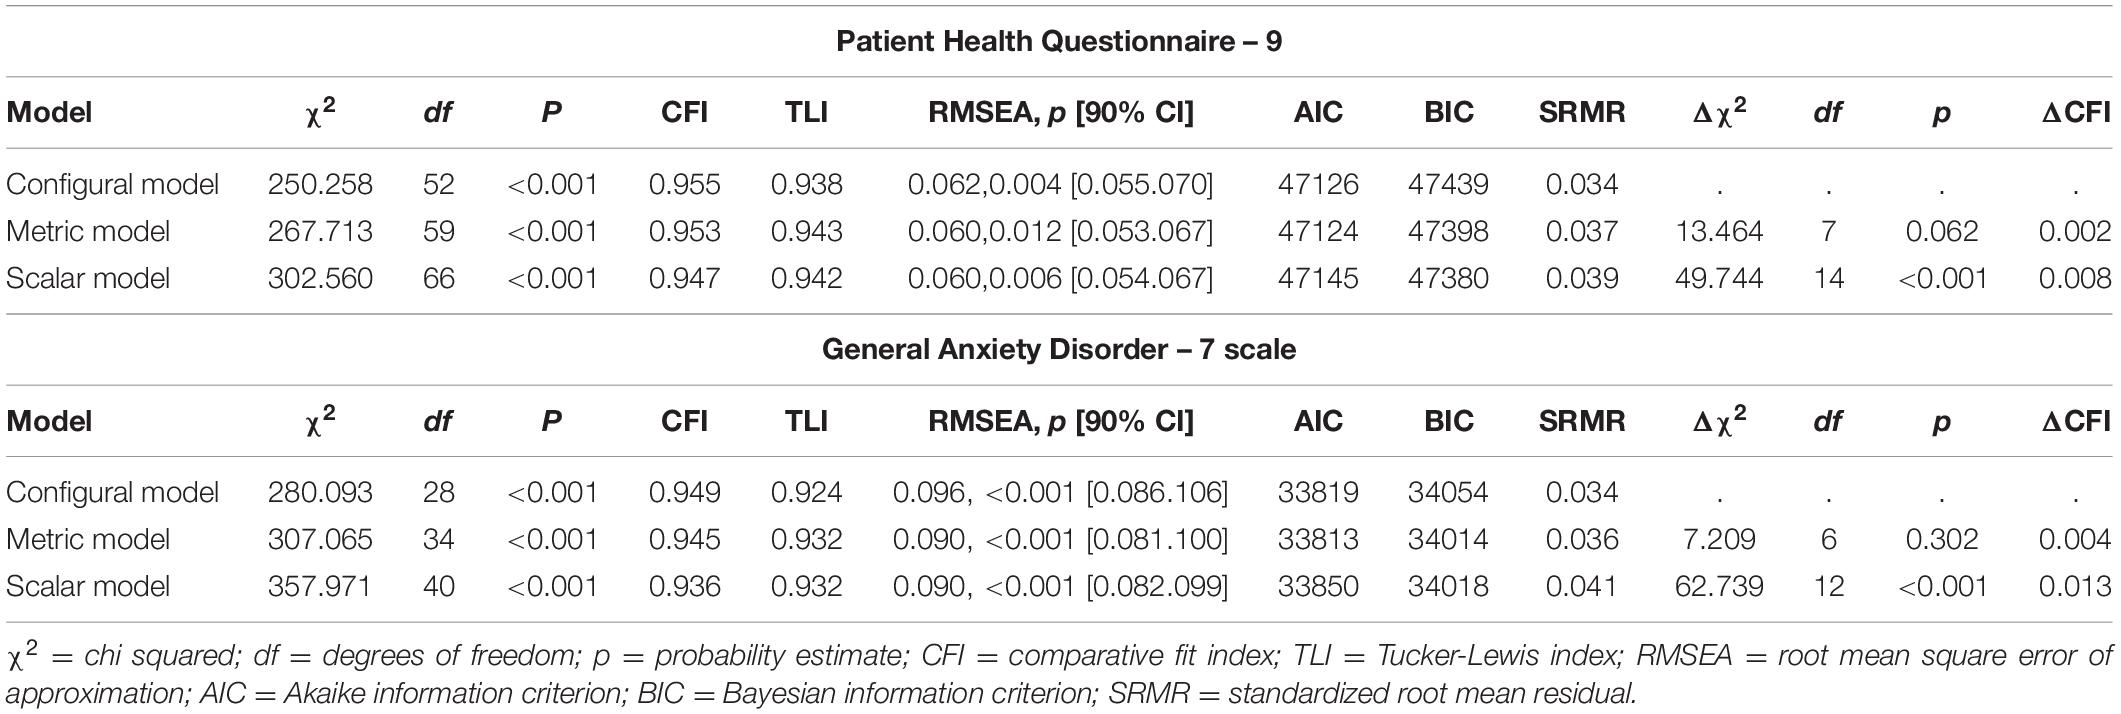
Table 2. Measurement invariance testing the PHQ-9 and GAD-7: male and female.
Patient Health Questionnaire-9 Measurement Invariance
The configural model was tested between the two groups and showed good fit [χ2(52) = 250.26, ρ < 0.001; CFI = 0.955; TLI = 0.938]. The metric model resulting from equality constraints on factor loadings was also well fitting [χ2(59) = 267.71, ρ < 0.001; CFI = 0.953; TLI = 0.943]. The ΔCFI of 0.002 indicated full metric invariance. Scalar invariance was also achieved as shown by ΔCFI of 0.008. This model fitted the data well [χ2(66) = 302.56, ρ < 0.001; CFI = 0.947; TLI = 0.942].
Generalized Anxiety Disorder-7 Measurement Invariance
Similar to the PHQ-9 model, the configural model for GAD-7 showed good fit [χ2(28) = 280.09, ρ < 0.001; CFI = 0.949; TLI = 0.924]. The GAD model [χ2(34) = 307.07, ρ < 0.001; CFI = 0.945; TLI = 0.932] demonstrated metric invariance (ΔCFI = 0.004). However, the scalar model [χ2(40) = 357.97, ρ < 0.001; CFI = 0.936; TLI = 0.933] did not show invariance between the groups (ΔCFI = 0.013).
Comparison of Mean Scores and Correlations of Depression and Anxiety Between the Sexes
Because the PHQ-9 attained scalar invariance, the dimensions of somatic depression and non-somatic depression could be compared for mean scores. For somatic depression, males scored 4.51 (SD = 0.12), while the females scored 5.66 (SD = 0.07), which were not significantly different, Wald (df = 1) = 3.17, ρ = 0.075. The scores were also not significantly different for the non-somatic dimension, with males scoring 7.23 (SD = 0.18) and females scoring 8.28 (SD = 0.12), Wald (df = 1) = 1.60, ρ = 0.206.
Although the mean scores for anxiety could not be compared because of a lack of GAD-7 scalar invariance, the comparison of the relationship between anxiety and depression scores was allowed on the basis of metric invariance. The standardized correlation between somatic depression and anxiety in the male group was r = 0.608 (SE = 0.026), and for the female group it was 0.593 (SE = 0.017), and showed no significant difference, Wald (df = 1) = 1.04, ρ = 0.314. For the non-somatic depression and anxiety correlations, the males scored r = 0.75 (SE = 0.018), and the females scored r = 0.74 (SE = 0.012), with no significant difference, Wald (df = 1) = 0.054, ρ = 0.815. Both the means scores and correlations between the groups are displayed in Table 3.
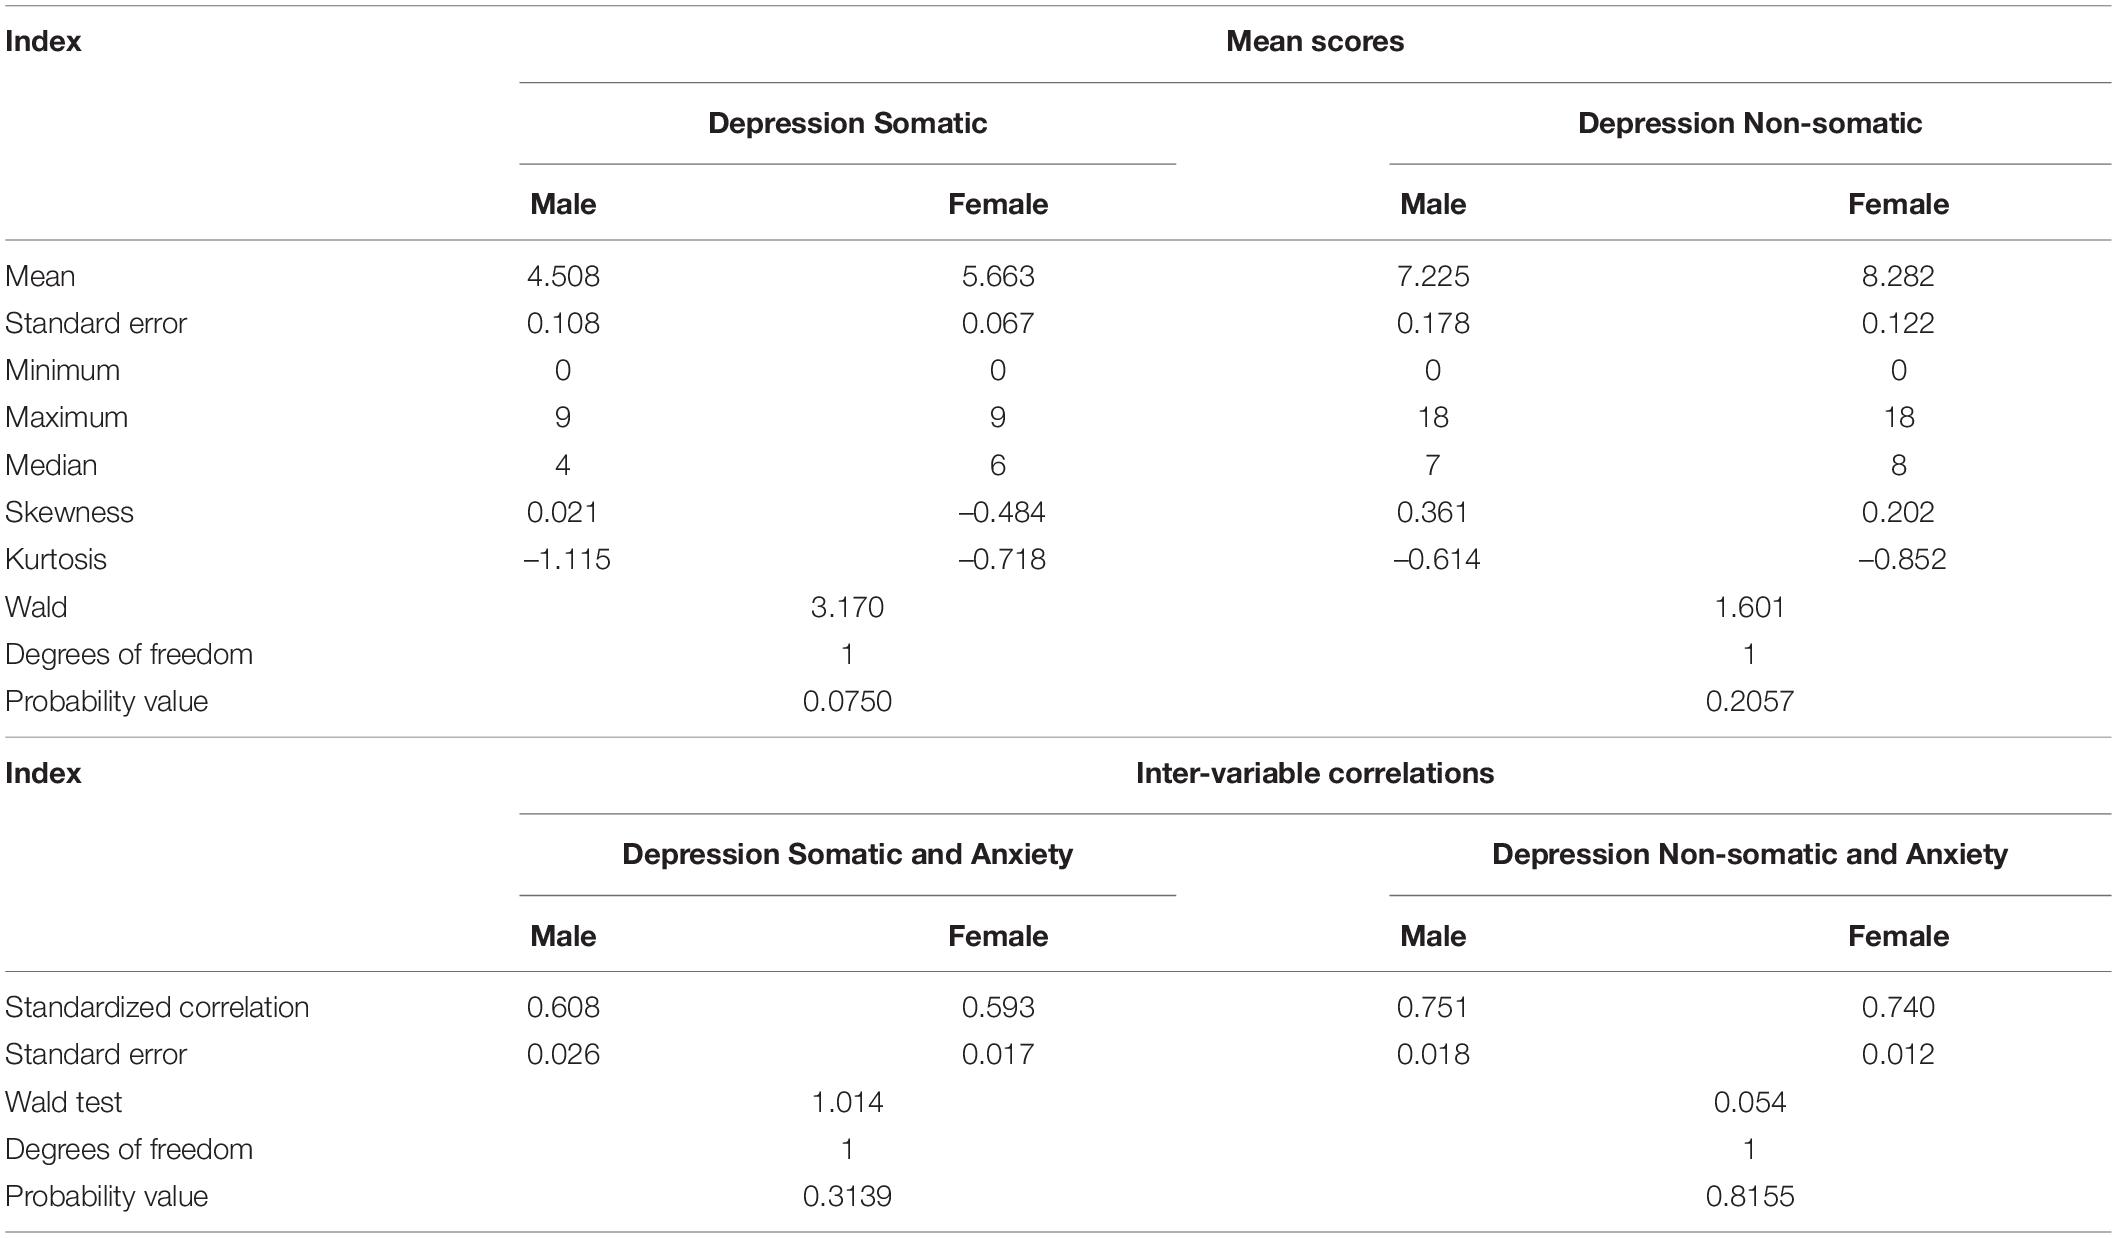
Table 3. Group comparisons of means and correlations.
Latent Class Analysis – Depression Symptom Heterogeneity Between the Sexes
In the male group, the model for one-, two-, three- and four-class solutions was estimated, and the model fit indices showed the three-class solution to be the best fitting. A similar procedure was followed, fitting up to a five-class model, for the female group, with the results fielding a best fitting four-class model. As displayed in Table 4, the male three-class solution was characterized by the lowest entropy value, and non-significant LMR-LRT and VLM-LRT, with class 1 accounting for 43.6%, class 2 for 35.3% and class 3 for 21.1%. Informed by both the relative fit indices and parsimony, the four-class solution was chosen for the women. As seen in Table 4, this is characterized by a low entropy value, and non-significant LMR-LRT and VLM-LRT, with the class distribution of 25.5% for class 1, 18.0% for class 2, 32.1% for class 3 and 24.5% for class 4.
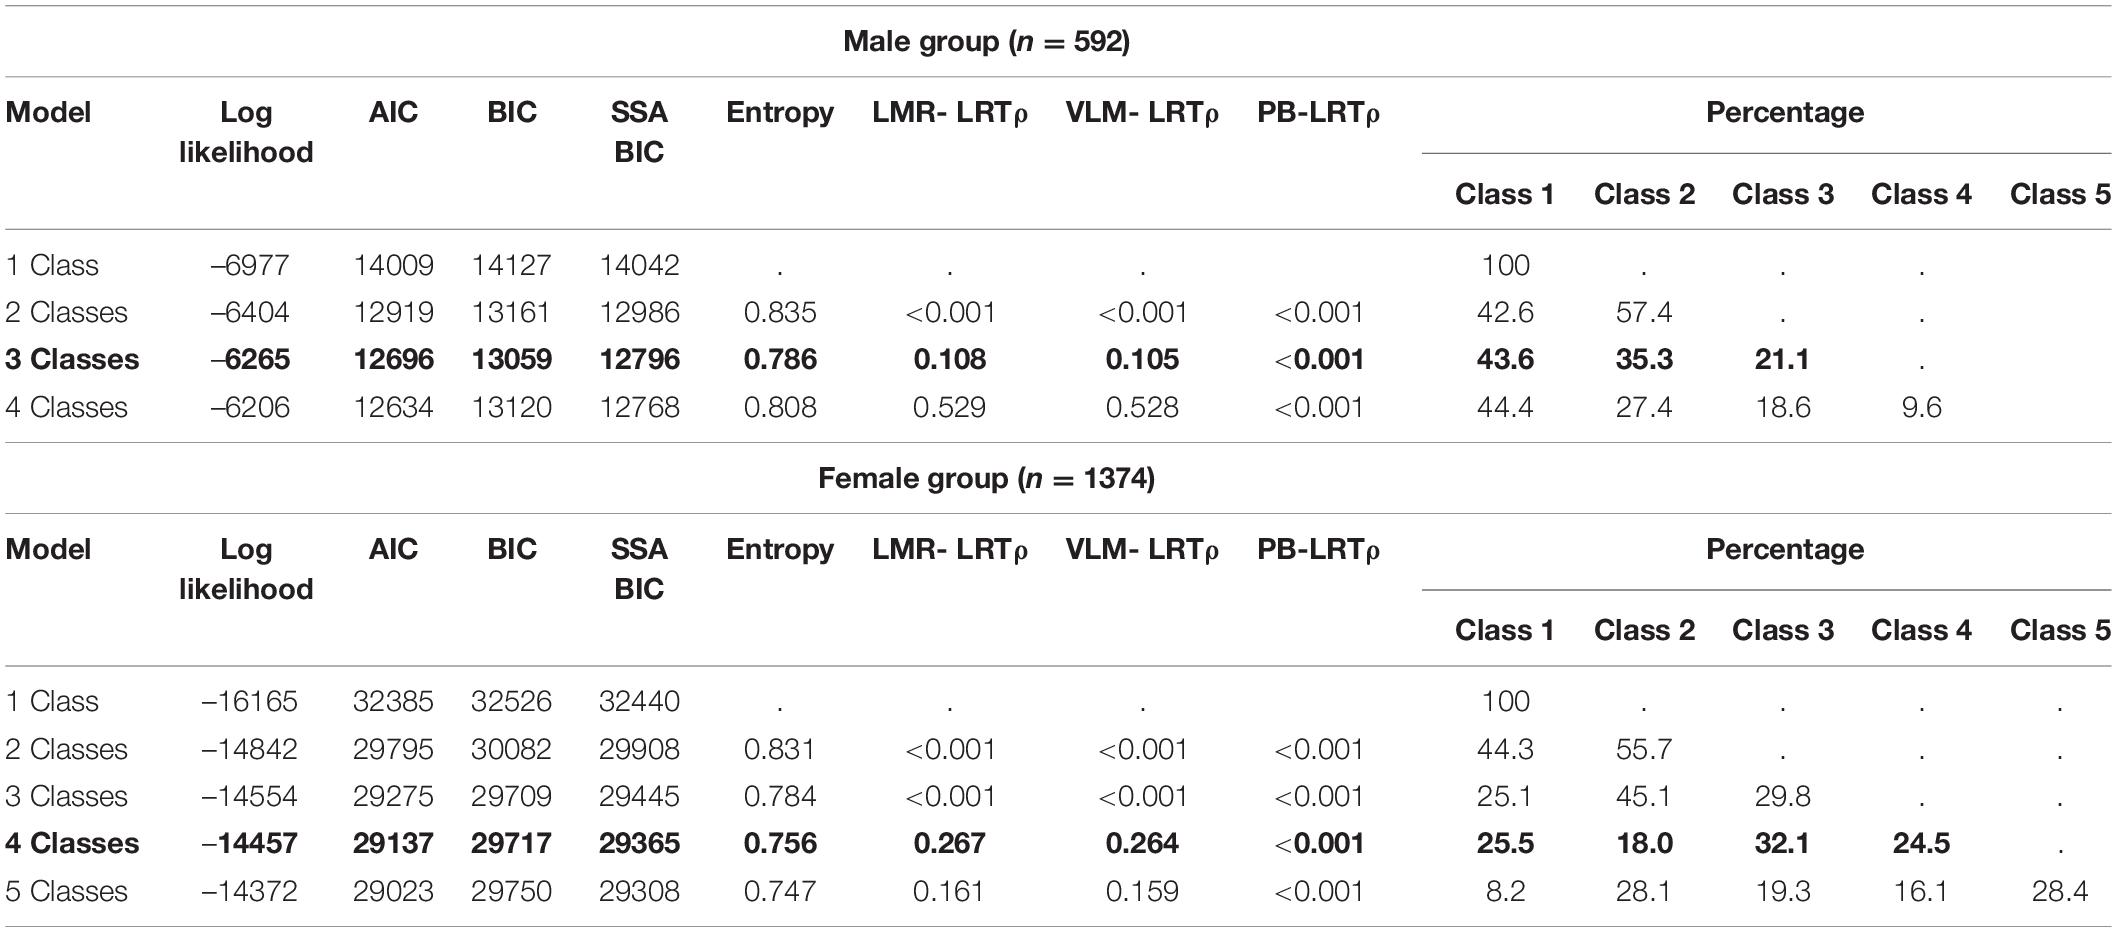
Table 4. Latent class solution model fit indices using the symptoms of depression (PHQ-9) for the male and female groups separately.
As displayed in Figure 3, the depression class profiles for men and women were interpreted on the basis of the relative scores for each depression symptom. Three depression class profiles emerged in the female group. Class 1 accounting for 43.6% shows high depression, characterized by high sleep disturbance and mood disturbances. Class 2 (35.3%: low) and Class 3 (21.1%: low, with sleep disturbance) both show low depression, with relatively low scores across all symptoms, except for sleep disturbance in Class 3.
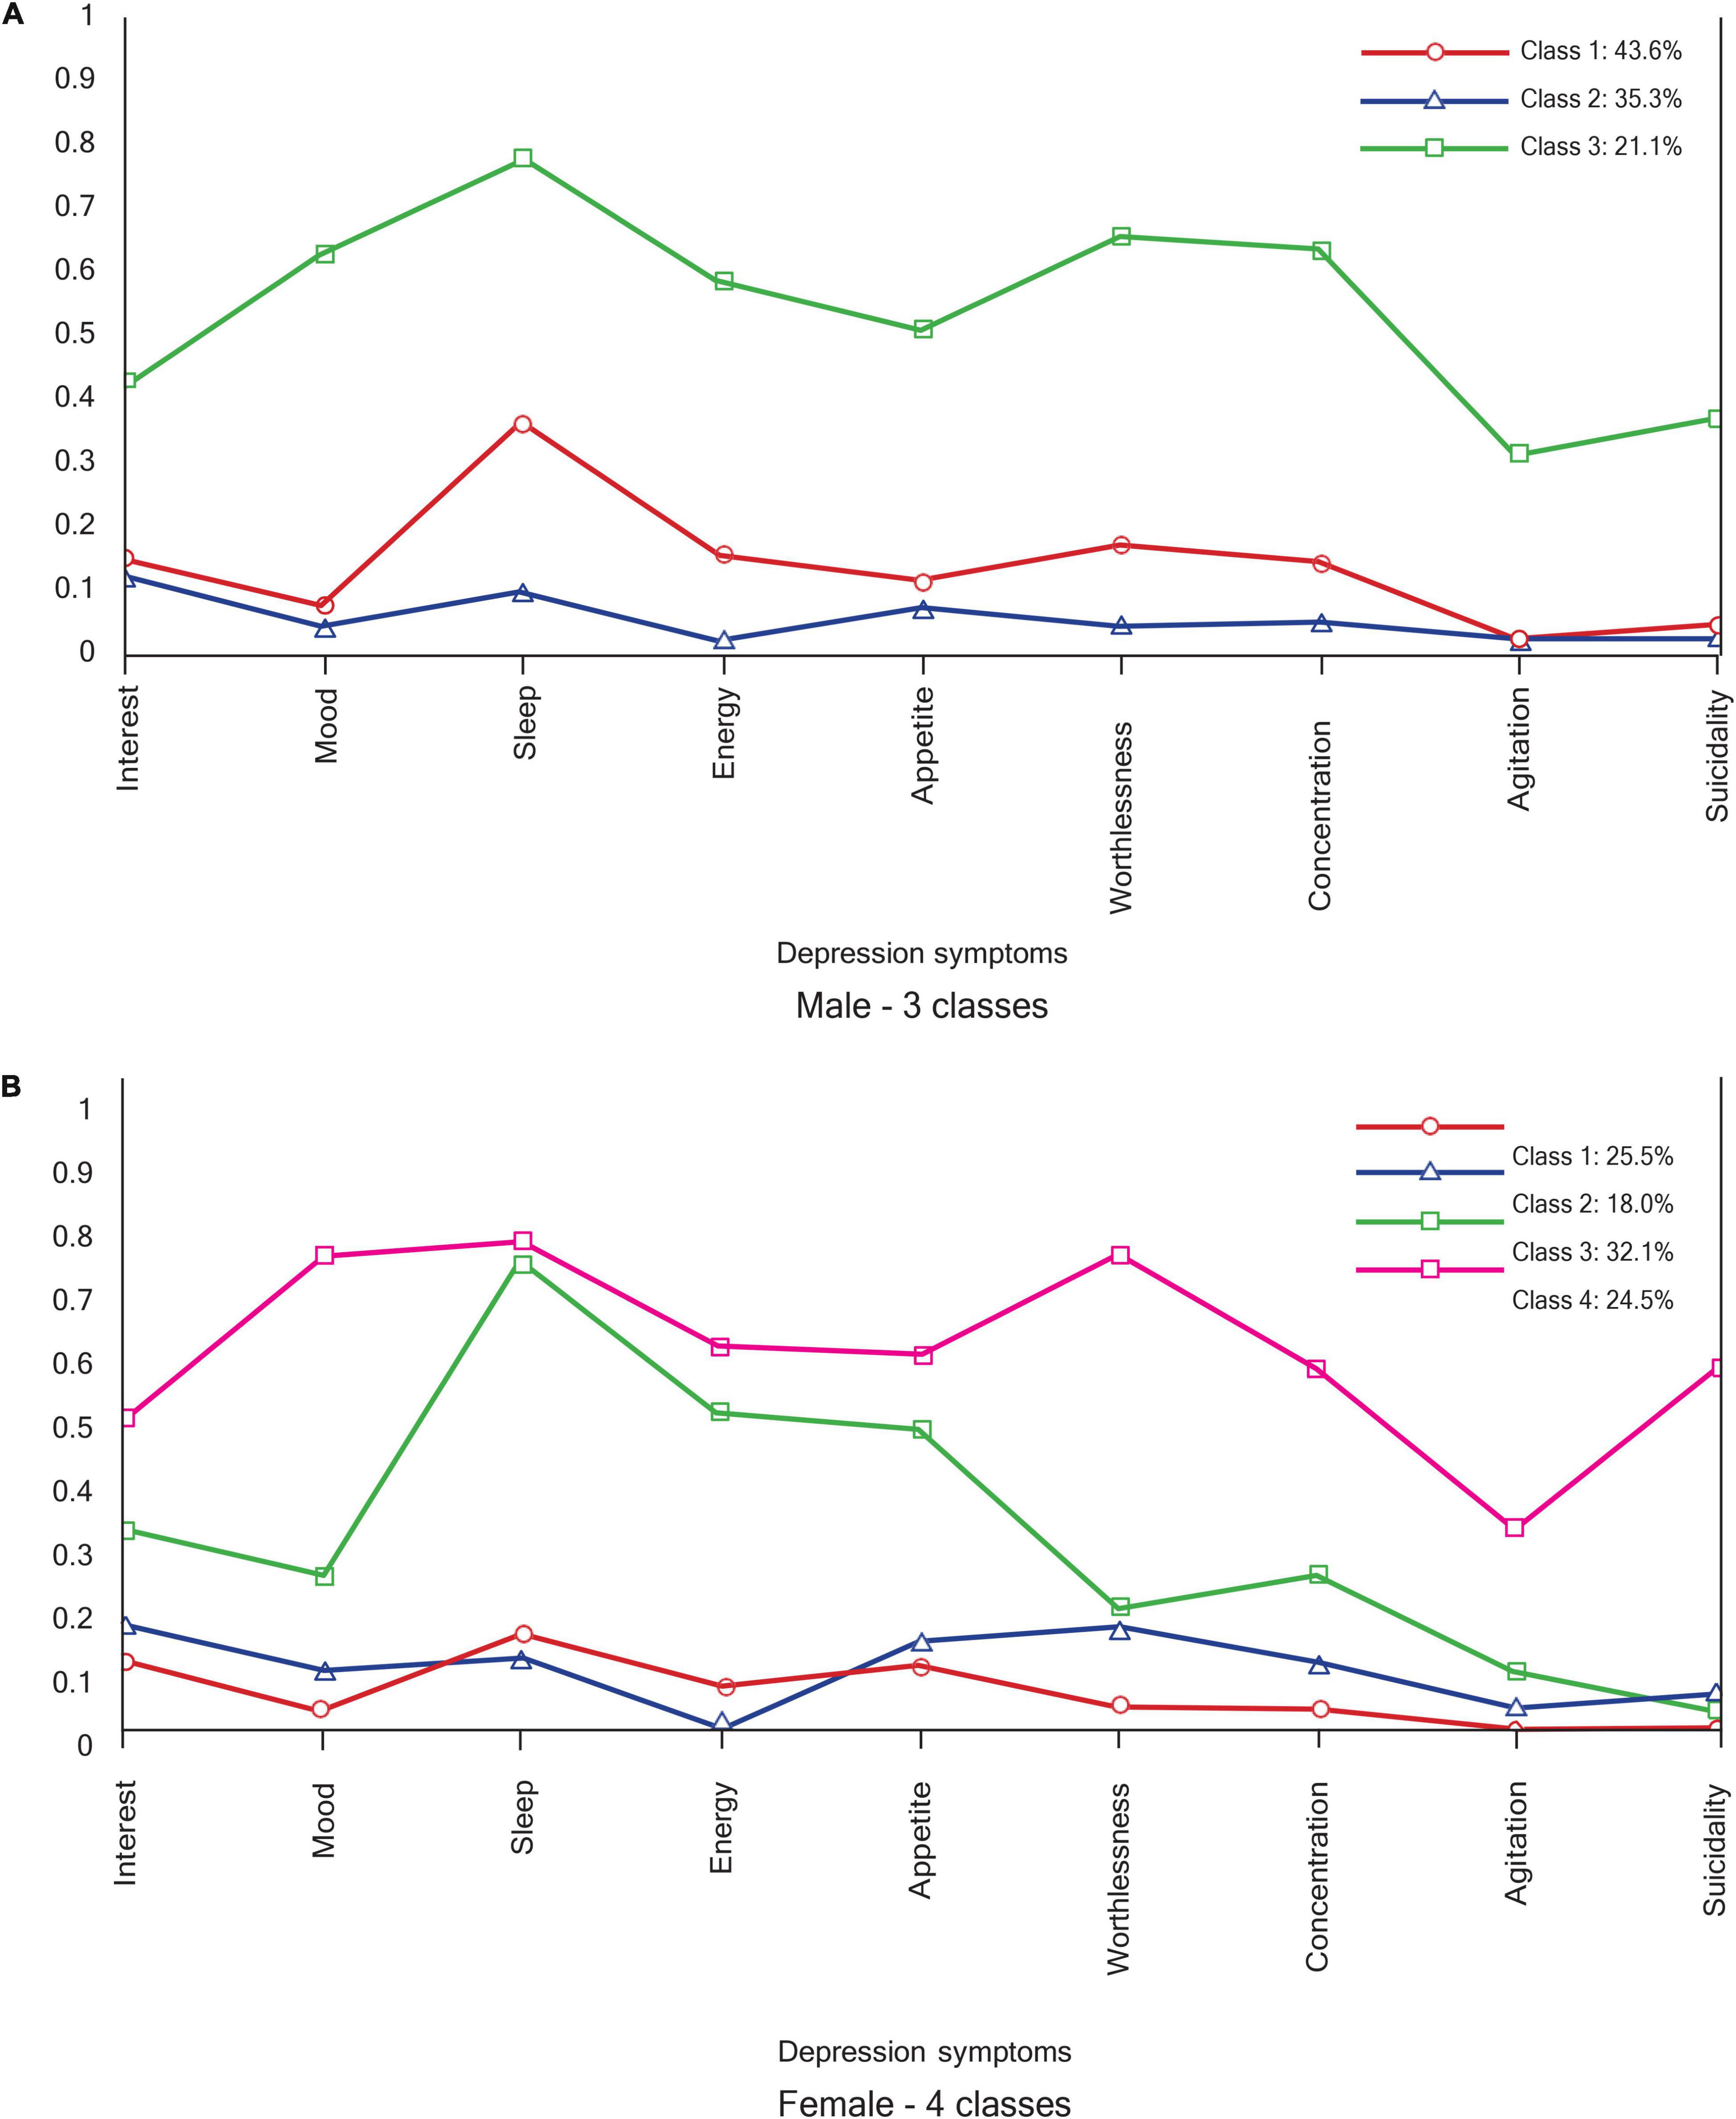
Figure 3. Depression profiles. (A) Male – 3 classes. (B) Female – 4 classes.
Four depression class profiles emerged in the male group, with two high depression profiles (32.1% for class 3 = high, somatic; and 24.5% for class 4 = high) and two low depression profiles (25.5% for class 1 = low, and 18.0% for class 2 = low, cognitive). Although both class 3 and class 4 show high levels of depression symptom endorsement, the class 3 profile (high, somatic) is distinguished by high sleep, energy, and appetite disturbances, while other symptoms are scored lower. Class 2 (low, cognitive) has a higher endorsement of appetite and concentration disturbances and interest, as well as worthlessness.
Latent Class Analysis – Anxiety Symptom Heterogeneity Between the Sexes
Model fit indices for the male and female anxiety symptom latent profiles are displayed in Table 5. In both groups, the three-class models were the best fitting, as indicated by low entropy value and non-significant LMR-LRT and VLM-LRT, with the four-class models adding no further fit improvement. In the male group, class 1 comprised 25.2%, class 2, 42.2%, and class 3, 32.6% of the sample. In the female group, class 1 accounted for 40.0%, class 2 for 37.0%, and class 3 for 23.0%.
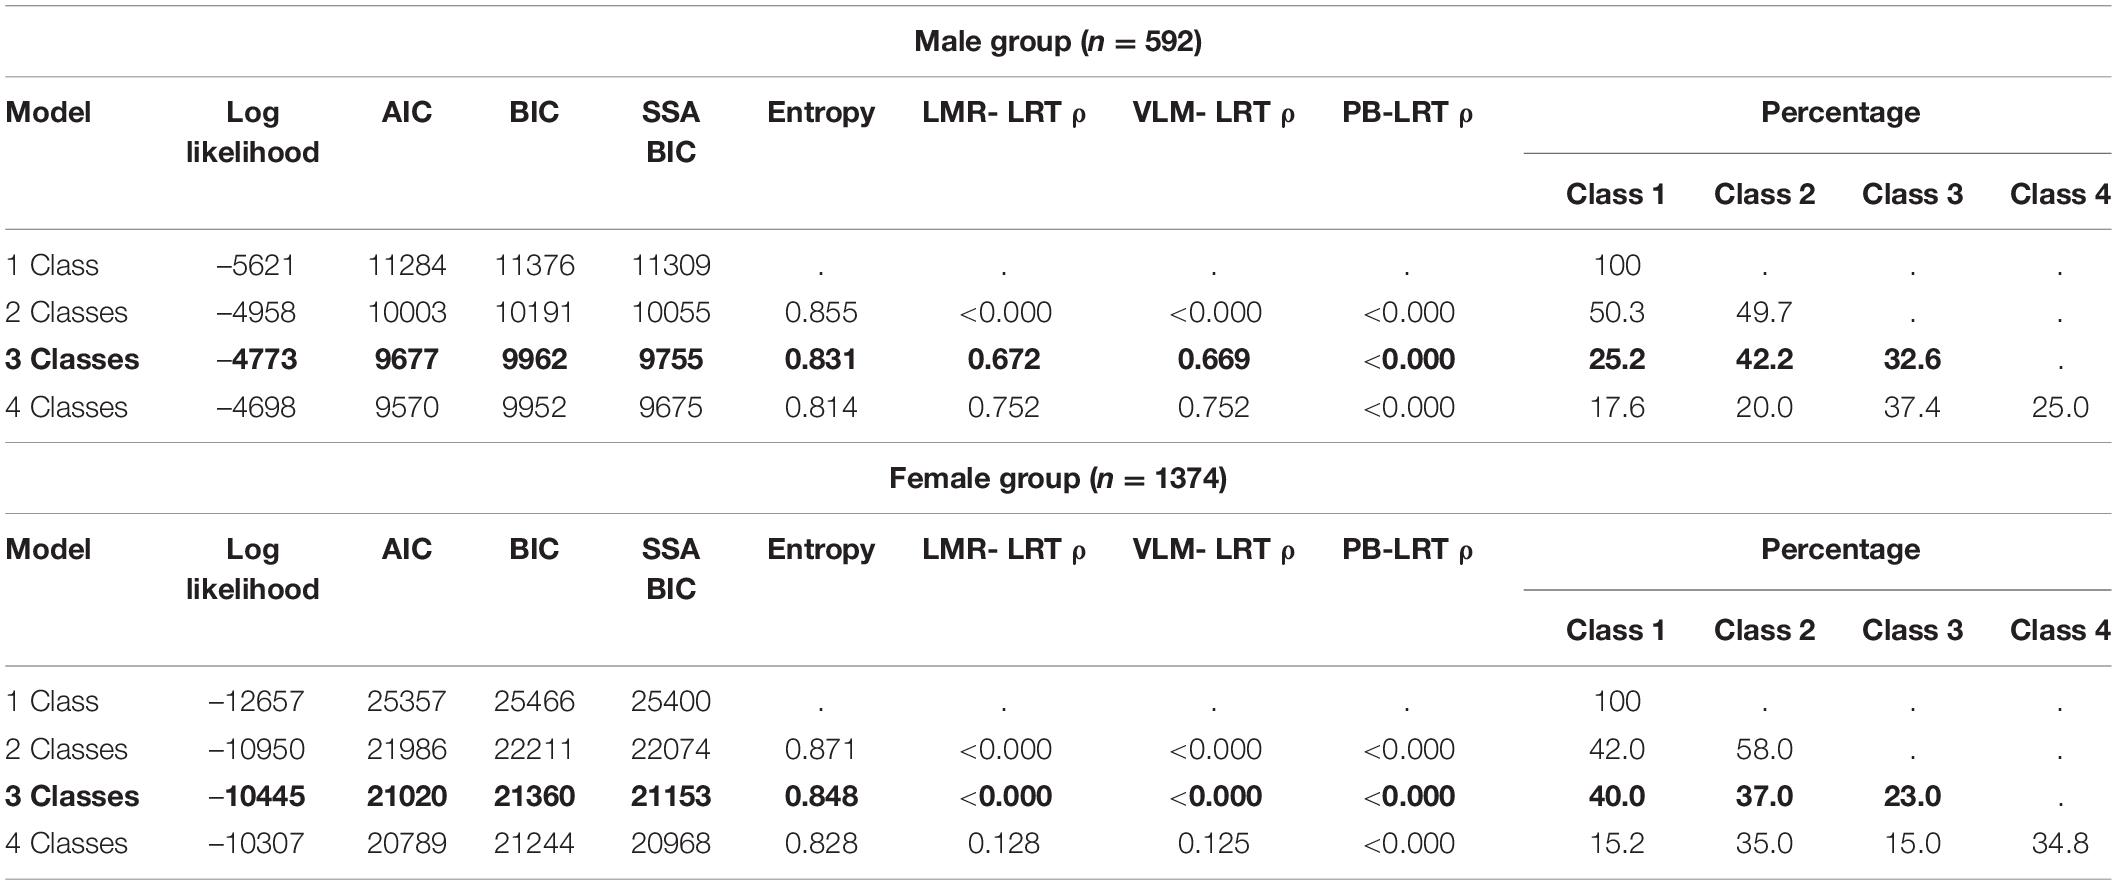
Table 5. Latent class solution model fit indices using the symptoms of anxiety (GAD-7) for the male and female groups separately.
As seen in Figure 4, the anxiety class profiles for males and females were interpreted on the basis of the relative scores of each anxiety symptom. The profiles of the two groups do not seem to differ, with both of them having a high anxiety profile (class 1), with high endorsement of worrying too much and having the need to control the worry. Similarly, two low anxiety profiles are observed in both groups (class 2 and class 3). While all of class 2 symptoms are higher than all of class 3 symptoms in the male group, the female group’s poor relaxation and restlessness symptom endorsement overlap.
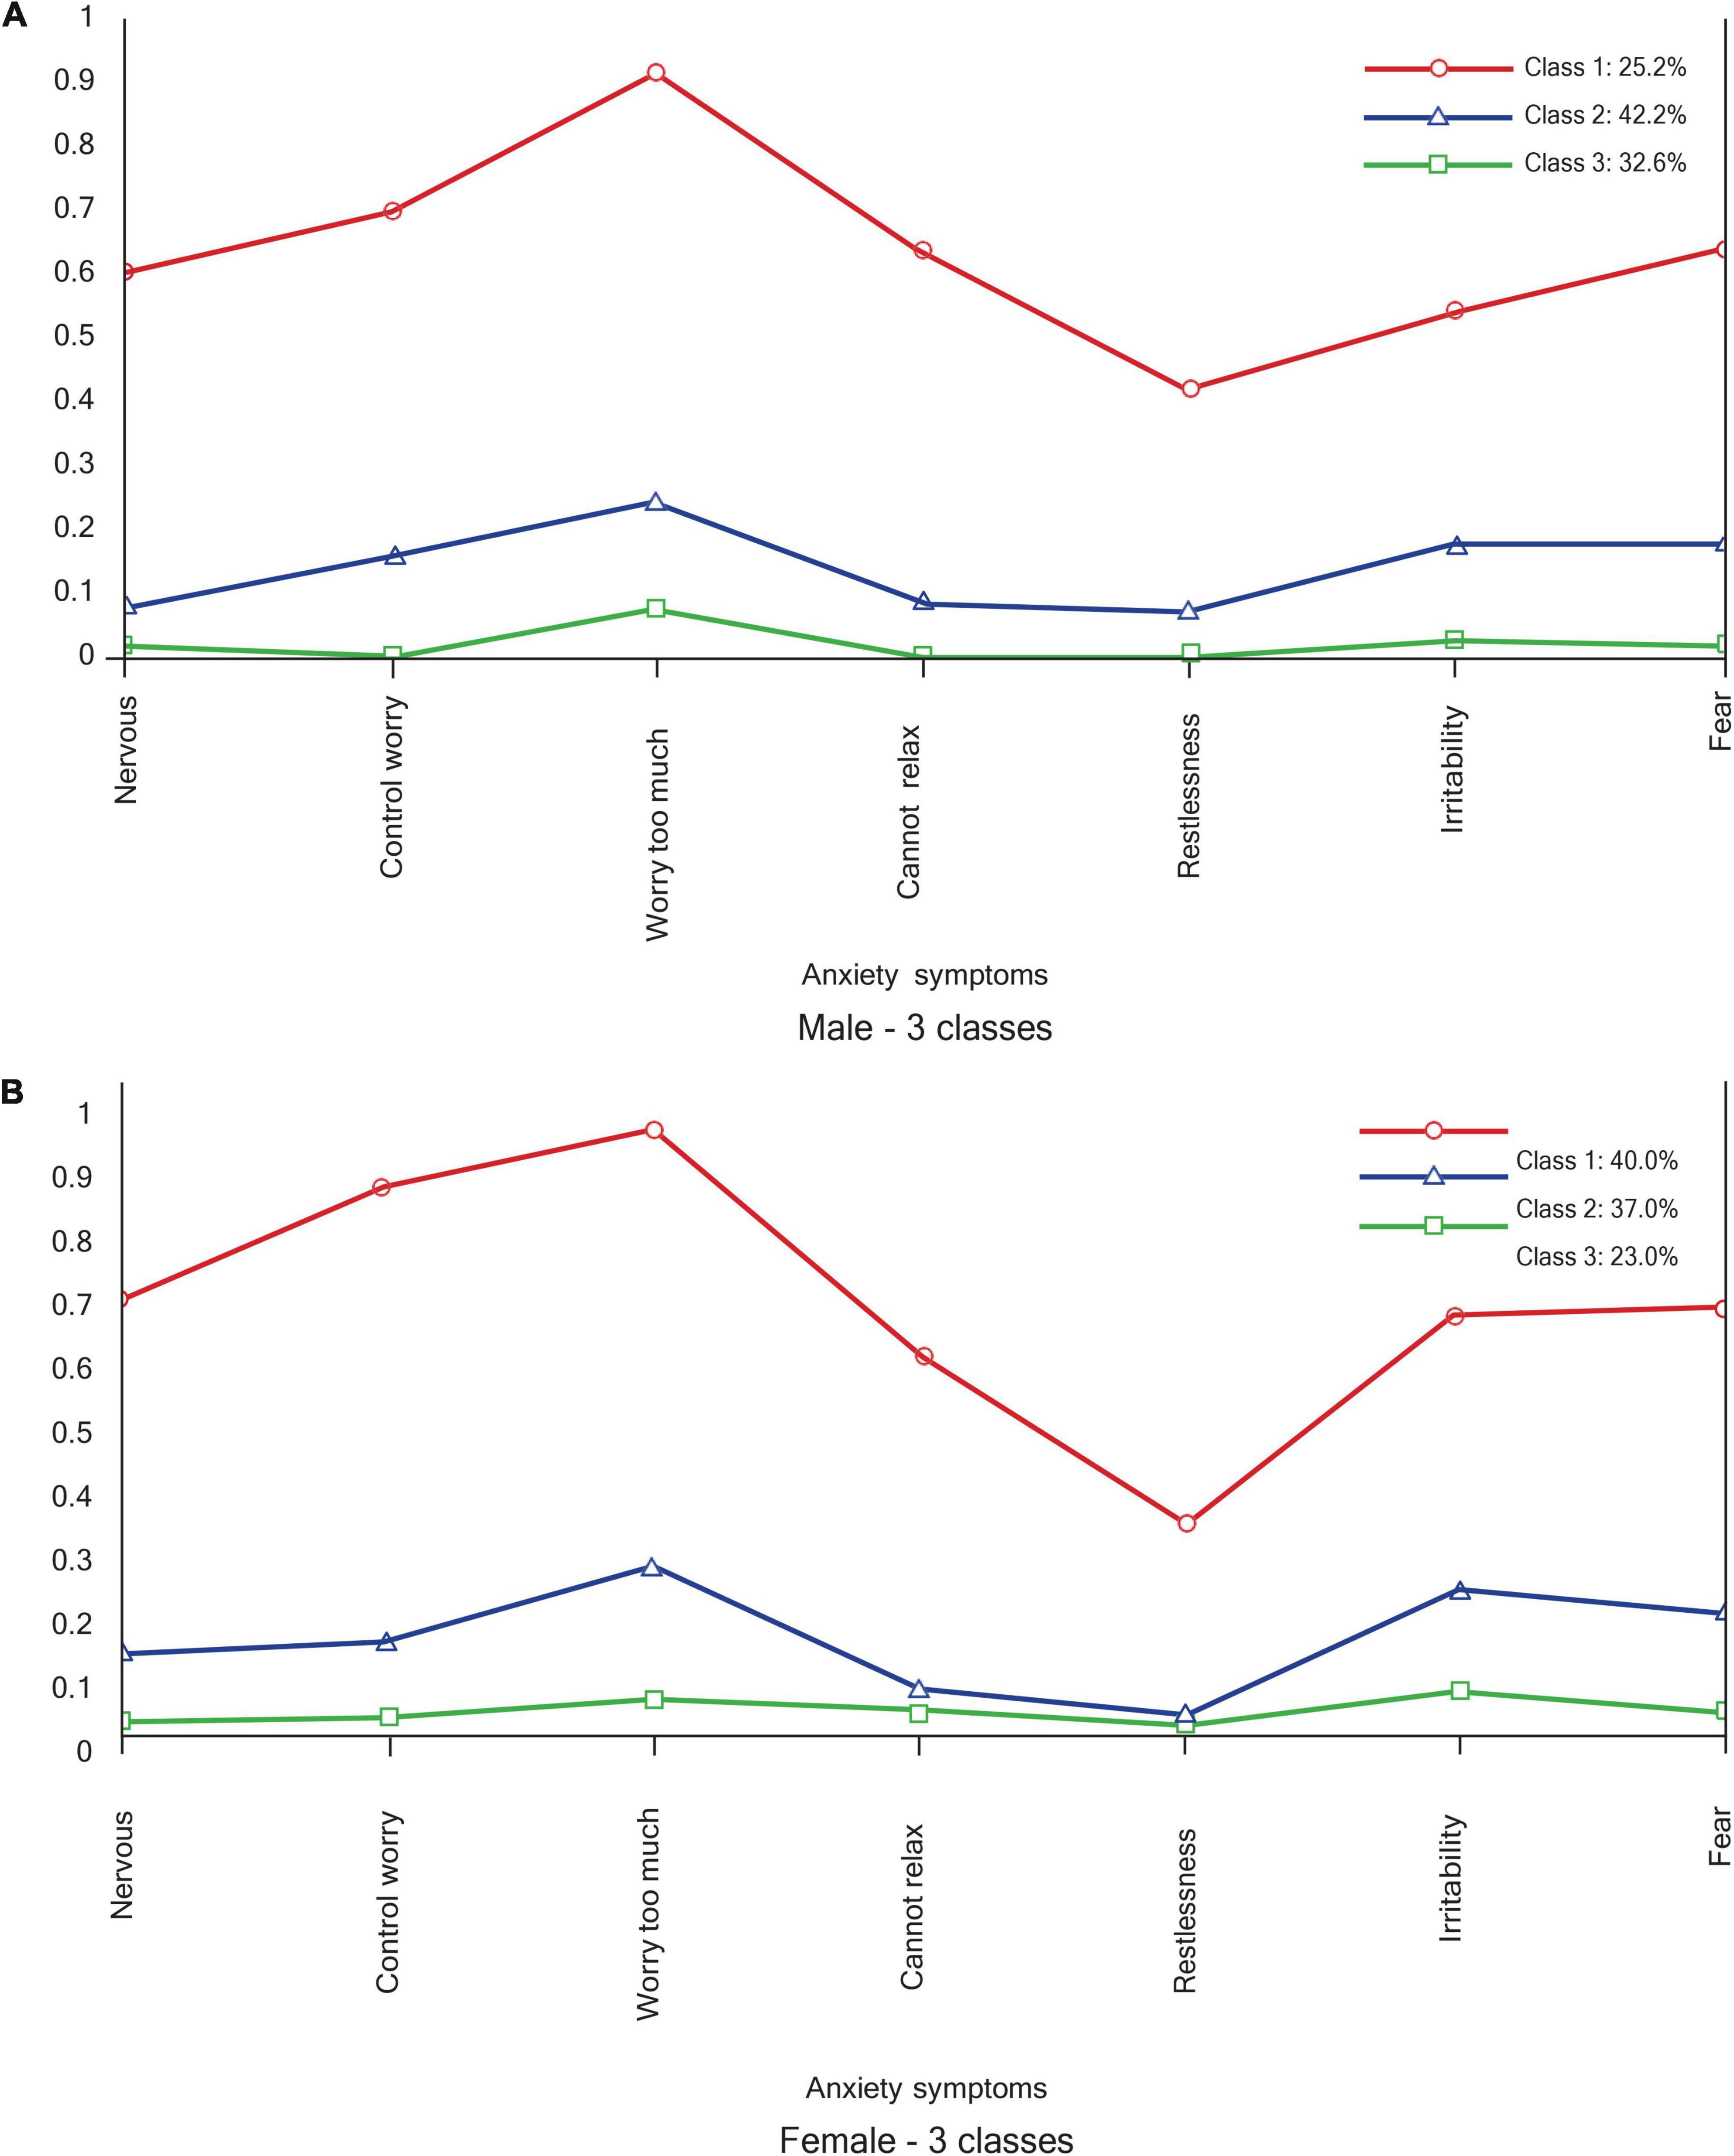
Figure 4. Anxiety profiles. (A) Male – 3 classes. (B) Female – 3 classes.
Discussion
Our aim was to evaluate the measurement of depression and anxiety by investigating the measurement properties of the PHQ-9 and the GAD-7 among male and female university students in South Africa. For the two measuring instruments, we used the university student data (N = 1966) to test for measurement invariance, comparing latent mean scores, naturally occurring symptom homogeneity, and depression and anxiety correlation between men (n = 592) and women (n = 1374). While we found scalar invariance for the two-factor PHQ-9 (somatic and non-somatic depression), the unidimensional GAD-7 yielded metric invariance. Allowing for mean score comparison of somatic and non-somatic depression, we found similar mean scores with no significant group difference. As expected, depression and anxiety were positively correlated, with no significant difference between men and women. Interestingly, while responses to the anxiety measure yielded three latent classes with similar profiles for the men and women, the LCA results for the depression measure showed different models (number of classes and nature of profiles) for men and women.
Measurement Invariance for Patient Health Questionnaire-9 and Generalized Anxiety Disorder-7
The two-factor PHQ-9 measure, with distinct somatic and non-somatic depression dimensions, showed scalar invariance across gender, and their mean scores were compared. In both groups, this model had covarying residual errors for items 6 (thoughts of self as failure) and 9 (suicide thoughts). The unidimensional GAD-7 only achieved metric invariance. While the latter instrument shows only the equivalence of indicator factor loadings on the intended latent constructs, the former assumes the equivalence of intercepts between the groups, and thus the means could be compared. In addition to the intercept equivalence (scalar) in intergroup depression measurement, the significance of the similarity of the factor structure (configural) and intended indicators (metric) of somatic and non-somatic dimensions of depression is worth noting. This finding means that in this sample, the structure of depression is distinguished by an evaluation of psychosomatic symptoms (Kendel et al., 2010; Elhai et al., 2012; Forkmann et al., 2013; Beard et al., 2016).
Comparison of Mean Scores and Inter-Variable Correlations Between Depression and Anxiety
The empirical evidence of no group differences in our data regarding the prevalence and manifestation of depression and anxiety is not supported by previous epidemiological data (e.g., Whiteford et al., 2015; Kuehner, 2017; Riecher-Rössler, 2017). Literature has predominantly found a gender gap, showing women to experience greater depression and anxiety symptoms as well as accounting for a greater disease burden. The empirically supported assertion that “women are about twice as likely as are men to develop depression during their lifetime” (Kuehner, 2017, p. 146) is often made, but such a result did not emerge in this cross-sectional study. It is also known that the gender gap in depression and depressive symptoms varies across countries (Salk et al., 2017). Salk et al.’s (2017) view that the perpetual “emphasizing the preponderance of women with depression is that depression becomes a female-stereotyped disorder” (p. 808), and that depression in men becomes a neglected phenomenon, helped to contextualize our results.
The question of whether gender/sex moderated the relationship between depression and anxiety was pursued through multi-group comparison of the association between their latent variables. We found the positive associations of somatic and non-somatic dimensions of depression with anxiety to be positive and high, with no significant difference between the men and women. While Teymoori et al. (2020a) did not make a distinction between somatic and non-somatic depression, they found a positive relationship between unidimensional PHQ-9 and GAD-7. Given Mosotho et al.’s (2008) findings of predominant somatic presentation among a South African sample, we would have expected this somatic/non-somatic distinction to play a greater role.
Latent Class Analysis for Patient Health Questionnaire-9
We found different latent class profiles for men (three classes) and women (four classes) with differing patterns. The finding of gender-related subtypes of depression is consistent with findings from previous studies (e.g., Kuehner, 2017; Rudenstine and Espinosa, 2018). Except for the two latent classes of high depression and low depression, which were similar in both groups, two main features distinguished men from women. The first is the high depression with the predominance of somatic symptoms factor, which is reminiscent of what Baumeister and Gordon (2012) refer to as female depression. They ascribe female depression to mood disturbance partly resulting from women’s reproductive system. Depression in women is known to present with atypical symptoms, with the predominance of somatic symptoms such as low energy, fatigue and pain (Kuehner, 2017). In a South African study, Makhubela and Debusho (2016) found women to score higher than men on depression-related somatic complaints.
The second distinguishing feature is low depression with features of cognitive evaluative indicators (depressive cognitions of worthlessness and poor concentration) among the men. The finding of different depression symptom configurations for men and women is a literature-consistent demonstration of the role of gender and sex in the patterns of symptom distribution. When examining depression and anxiety symptoms together in a large population-representative sample in the United States, Rudenstine and Espinosa (2018) found a seven-class model for the males and an eleven-class model for the females.
Latent Class Analysis for Generalized Anxiety Disorder-7
The latent class models were similar for men and women in terms of both the number of classes and the pattern of symptom endorsement. The patterns were characterized by a predominance of being nervous, worrying too much and a preoccupation with controlling the worry. This similarity between how men and women present with anxiety symptoms is notwithstanding previous studies, which have shown that women were at a higher risk to carry greater disease burden from anxiety diagnoses than men. McLean et al. (2011) found that women were more likely to meet diagnostic criteria for all of the anxiety disorders except for social anxiety disorder, which was the same as men.
Limitations
We acknowledge the contribution of this manuscript within the context of a few limitations of the study. Data in the present study came from a cross-sectional survey utilizing only self-reported information. Future studies could consider not only implementing longitudinal surveys across time, but also complement self-report information with other forms of data sources. Additional sociodemographic information such as race, gender, sexual orientation and socioeconomic status would have enriched our inquiry. It is known from Makhubela’s (2016) Beck Depression Inventory validation study that, albeit with a couple of non-invariant items, scalar invariance was achieved between black and white participants in South Africa. The present study’s analysis was strictly limited to sex, and not gender. The undisputed distinction between sex (as biological determinants) and gender (as social factors) (see Phillips, 2005; Afifi, 2007; Regitz-Zagrosek, 2012) is acknowledged. Another limitation is that we applied convenience sampling, with available students, instead of a population-based sample. Working with the assumption that depression is a developmental phenomenon, whose prevalence and severity increases as individuals become adults (Black and Pössel, 2015), it may be valuable for future research to explore the measurement complexities of depression and anxiety in a population-based adult sample, and across a lifespan.
Recommendations and Implications
The findings of the present study have implications for both research and practice, some of which may also be considered by policymakers. They make a case for sex-specific (mental) healthcare for the South African population (see Regitz-Zagrosek, 2012). When the healthcare system is sensitive to sex-imposed impacts, it will also respond to the knowledge that, at present, females account for more disability-adjusted life years (DALYs) in mental and neurological disorders (Whiteford et al., 2015). Such a response would foster progress toward efforts to reduce the treatment gap (see Alonso et al., 2018; Evans-Lacko et al., 2018). This outcome would improve access to treatment and reduce the treatment gap, as currently only a minority of people with mental disorders receive help (Evans-Lacko et al., 2018). Lastly, future research should consider the measurement of depression and anxiety using the recently developed Patient Health Questionnaire – Anxiety and Depression Scale (PHQ-ADS, Kroenke et al., 2019), whose bifactor model explains the combination of the syndrome better (Teymoori et al., 2020a).
Conclusion
Within a South African context, the present paper was concerned with equivalence, symptom heterogeneity, the relationship between depression and anxiety and a comparison of symptom prevalence between male and female individuals. While depression and anxiety were found to be equally prevalent in both groups, the difference in symptom presentation is noteworthy. Using the GAD-7, we found generalized anxiety symptoms to manifest and present in similar ways between males and females, but the PHQ-9 yielded different depression latent class patterns. These results make a case for adequate sex-specific measurement approaches to depression and anxiety in South Africa.
Data Availability Statement
The raw data supporting the conclusions of this article will be made available by the authors, without undue reservation.
Ethics Statement
The studies involving human participants were reviewed and approved by the General/Human Research Ethics Committee University of the Free State. The patients/participants provided their written informed consent to participate in this study.
Author Contributions
KP collected the data for her Master’s degree research project and was supervised by IK. IK analyzed the data. All authors contributed to conceptualization and writing.
Conflict of Interest
The authors declare that the research was conducted in the absence of any commercial or financial relationships that could be construed as a potential conflict of interest.
Publisher’s Note
All claims expressed in this article are solely those of the authors and do not necessarily represent those of their affiliated organizations, or those of the publisher, the editors and the reviewers. Any product that may be evaluated in this article, or claim that may be made by its manufacturer, is not guaranteed or endorsed by the publisher.
References
Alonso, J., Liu, Z., Evans-Lacko, S., Sadikova, E., Sampson, N., Chatterji, S., et al. (2018). Treatment gap for anxiety disorders is global: results of the world mental health surveys in 21 countries. Depress. Anxiety 35, 195–208. doi: 10.1002/da.22711
Baas, K. D., Cramer, A. O. J., Koeter, M. W. J., Van de Lisdonk, E. H., Van Weert, H. C., and Schene, A. H. (2011). Measurement invariance with respect to ethnicity of the patient health questionnaire-9 (PHQ-9). J. Affect. Disord. 129, 229–235. doi: 10.1016/j.jad.2010.08.026
Baumeister, H., and Gordon, P. (2012). Meta-review of depressive subtyping models. J. Affect. Disord. 139, 126–140. doi: 10.1016/j.jad.2011.07.015
Beard, C., Hsu, K. J., Rifkin, L. S., Busch, A. B., and Björgvinsson, T. (2016). Validation of the PHQ-9 in a psychiatric sample. J. Affect. Disord. 193, 267–273. doi: 10.1016/j.jad.2015.12.075
Bhana, A., Rathod, S. D., Selohilwe, O., Kathree, T., and Petersen, I. (2015). The validity of the patient health questionnaire for screening depression in chronic care patients in primary health care in South Africa. BMC Psychiatry 15:118. doi: 10.1186/s12888-015-0503-0
Black, S. W., and Pössel, P. (2015). Integrating Beck’s cognitive model and the response style theory in an adolescent sample. J. Youth Adolesc. 44, 195–210. doi: 10.1007/s10964-013-0087-2
Borgogna, N. C., Brenner, R. E., and McDermott, R. C. (2021). Sexuality and gender invariance of the PHQ-9 and GAD-7: implications for 16 identity groups. J. Affect. Disord. 278, 122–130. doi: 10.1016/j.jad.2020.09.069
Byrne, B. M. (2012). Structural Equation Modeling with Mplus: Basic Concepts, Applications, and Programming. London: Routledge.
Byrne, B. M., and Van de Vijver, F. J. (2010). Testing for measurement and structural equivalence in large-scale cross-cultural studies: addressing the issue of nonequivalence. Int. J. Test. 10, 107–132. doi: 10.1080/15305051003637306
Castillo, L. G., Navarro, R. L., Walker, J. E. O. Y., Schwartz, S. J., Zamboanga, B. L., Whitbourne, S. K., et al. (2015). Gender matters: the influence of acculturation and acculturative stress on Latino college student depressive symptomatology. J. Lat. Psychol. 3, 40–55. doi: 10.1037/lat0000030
Charlson, F., van Ommeren, M., Flaxman, A., Cornett, J., Whiteford, H., and Saxena, S. (2019). New WHO prevalence estimates of mental disorders in conflict settings: a systematic review and meta-analysis. Lancet 394, 240–248. doi: 10.1016/S0140-6736(19)30934-1
Chen, F. F. (2008). What happens if we compare chopsticks with forks? The impact of making inappropriate comparisons in cross-cultural research. J. Pers. Soc. Psychol. 95, 1005–1018. doi: 10.1037/a0013193
Cheung, G. W., and Rensvold, R. B. (2002). Evaluating goodness-of-fit indexes for testing measurement invariance. Struct. Equ. Modeling 9, 233–255.
Chisholm, D., Sweeny, K., Sheehan, P., Rasmussen, B., Smit, F., Cuijpers, P., et al. (2016). Scaling-up treatment of depression and anxiety: a global return on investment analysis. Lancet Psychiatry 3, 415–424. doi: 10.1016/S2215-0366(16)30024-4
Elhai, J. D., Contractor, A. A., Tamburrino, M., Fine, T. H., Prescott, M. R., Shirley, E., et al. (2012). The factor structure of major depression symptoms: a test of four competing models using the Patient Health Questionnaire-9. Psychiatry Res. 199, 169–173. doi: 10.1016/j.psychres.2012.05.018
Evans-Lacko, S., Aguilar-Gaxiola, S., Al-Hamzawi, A., Alonso, J., Benjet, C., Bruffaerts, R., et al. (2018). Socio-economic variations in the mental health treatment gap for people with anxiety, mood, and substance use disorders: results from the WHO World Mental Health (WMH) surveys. Psychol. Med. 48, 1560–1571. doi: 10.1017/S0033291717003336
Forkmann, T., Gauggel, S., Spangenberg, L., Brähler, E., and Glaesmer, H. (2013). Dimensional assessment of depressive severity in the elderly general population: psychometric evaluation of the PHQ-9 using rasch analysis. J. Affect. Disord. 148, 323–330. doi: 10.1016/j.jad.2012.12.019
Galenkamp, H., Stronks, K., Snijder, M. B., and Derks, E. M. (2017). Measurement invariance testing of the PHQ-9 in a multi-ethnic population in Europe: the HELIUS study. BMC Psychiatry 17:349. doi: 10.1186/s12888-017-1506-9
Gu, F., Little, T. D., and Kingston, N. M. (2013). Misestimation of reliability using coefficient alpha and structural equation modelling when assumptions of tau-equivalence and uncorrelated errors are violated. Methodology 9, 30–40. doi: 10.1027/1614-2241/a000052
Henn, C., and Morgan, B. (2019). Differential item functioning of the CESDR-R and GAD-7 in African and white working adults. S. Afr. J. Ind. Psychol. 45, 1–10. doi: 10.4102/sajip.v45i0.1663
Hu, L. T., and Bentler, P. M. (1999). Cutoff criteria for fit indexes in covariance structure analysis: conventional criteria versus new alternatives. Struct. Equ. Modeling 6, 1–55. doi: 10.1080/10705519909540118
Joshanloo, M., Wissing, M. P., Khumalo, I. P., and Lamers, S. M. A. (2013). Measurement invariance of the Mental Health Continuum-Short Form (MHC-SF) across three cultural groups. J. Pers. Individ. Dif. 55, 755–759. doi: 10.3389/fpsyg.2021.607152
Kendel, F., Wirtz, M., Dunkel, A., Lehmkuhl, E., Hetzer, R., and Regitz-Zagrosek, V. (2010). Screening for depression: rasch analysis of the dimensional structure of the PHQ-9 and the HADS-D. J. Affect. Disord. 122, 241–246. doi: 10.1016/j.jad.2009.07.004
Keng, S. L., Lee, Y., Drabu, S., Hong, R. Y., Chee, C. Y., Ho, C. S., et al. (2019). Construct validity of the Mclean screening instrument for borderline personality disorder in two Singaporean samples. J. Pers. Disord. 33, 450–469. doi: 10.1521/pedi_2018_32_352
Kline, R. B. (2011). Principles and Practice of Structural Equation Modeling, 3rd Edn. New York, NY: The Guilford Press.
Kroenke, K., Baye, F., and Lourens, S. G. (2019). Comparative validity and responsiveness of PHQ-ADS and other composite anxiety-depression measures. J. Affect. Disord. 246, 437–443. doi: 10.1016/j.jad.2018.12.098
Kroenke, K., and Spitzer, R. L. (2002). The PHQ-9: a new depression diagnostic and severity measure. Psychiatr. Ann. 32, 509–515. doi: 10.3928/0048-5713-20020901-06
Kroenke, K., Spitzer, R. L., and Williams, J. B. (2001). The PHQ-9: validity of a brief depression severity measure. J. Gen. Intern. Med. 16, 606–613. doi: 10.1046/j.1525-1497.2001.016009606.x
Kuehner, C. (2017). Why is depression more common among women than among men? Lancet Psychiatry 4, 146–158. doi: 10.1016/S2215-0366(16)30263-2
Li, S. H., and Graham, B. M. (2017). Why are women so vulnerable to anxiety, trauma-related and stress-related disorders? The potential role of sex hormones. Lancet Psychiatry 4, 73–82. doi: 10.1016/S2215-0366(16)30358-3
Lietaert, S., Roorda, D., Laevers, F., Verschueren, K., and De Fraine, B. (2015). The gender gap in student engagement: the role of teachers’ autonomy support, structure, and involvement. Br. J. Educ. Psychol. 85, 498–518. doi: 10.1111/bjep.12095
Makhubela, M. (2021). Comorbid anxiety and depression psychopathology in university students: a network approach. S. Afr. J. Psychol. 51, 35–53. doi: 10.1177/0081246320973839
Makhubela, M., and Debusho, L. K. (2016). Factorial invariance and latent mean differences of the Beck Depression Inventory – second edition (BDI-II) across gender in South African university students. J. Psychol. Afr. 26, 522–526. doi: 10.1080/14330237.2016.1219555
Makhubela, M., and Khumalo, I. P. (2022). Psychometric evaluation of the PHQ-9 in university students: factorial validity and measurement equivalence across three African countries. Curr. Psychol. doi: 10.1007/s12144-022-02997-0
Makhubela, M. S. (2016). Measurement invariance of the beck depression inventory-second edition across race with South African university students. S. Afr. J. Psychol. 46, 449–461.
McLean, C. P., Asnaani, A., Litz, B. T., and Hofmann, S. G. (2011). Gender differences in anxiety disorders: prevalence, course of illness, comorbidity and burden of illness. J. Psychiatr. Res. 45, 1027–1035. doi: 10.1016/j.jpsychires.2011.03.006
Monahan, P. O., Shacham, E., Reece, M., Kroenke, K., Ong’Or, W. O., Omollo, O., et al. (2009). Validity/reliability of PHQ-9 and PHQ-2 depression scales among adults living with HIV/AIDS in western Kenya. J. Gen. Intern. Med. 24, 189–197. doi: 10.1007/s11606-008-0846-z
Moreno, D. H., and Andrade, L. H. (2010). Latent class analysis of manic and depressive symptoms in a population-based sample in São Paulo, Brazil. J. Affect. Disord. 123, 208–215. doi: 10.1016/j.jad.2009.09.023
Mosotho, N. L., Louw, D. A., Calitz, F. J., and Esterhuyse, K. G. (2008). Depression among Sesotho speakers in Mangaung, South Africa. Afr. J. Psychiatry 11, 35–43. doi: 10.4314/ajpsy.v11i1.30253
Muthén, L. K., and Muthén, B. O. (1998/2017). Mplus Statistical analysis with Latent Variables: Users’ Guide, 8th Edn. Los Angeles, CA: Muthén & Muthén.
Nylund, K. L., Asparouhov, T., and Muthén, B. O. (2007). Deciding on the number of classes in latent class analysis and growth mixture modeling: a Monte Carlo simulation study. Struct. Equ. Modeling 14, 535–569. doi: 10.1080/10705510701575396
Patel, V., Abas, M., Broadhead, J., Todd, C., and Reeler, A. (2001). Depression in developing countries: lessons from Zimbabwe. BMJ 322, 482–484. doi: 10.1136/bmj.322.7284.482
Phillips, S. P. (2005). Defining and measuring gender: a social determinant of health whose time has come. Int. J. Equity Health 4:11. doi: 10.1186/1475-9276-4-11
Ploubidis, G. B., Abbott, R. A., Huppert, F. A., Kuh, D., Wadsworth, M. E. J., and Croudace, T. J. (2007). Improvements in social functioning reported by a birth cohort in mid-adult life: a person-centred analysis of GHQ-28 social dysfunction items using latent class analysis. Pers. Individ. Dif. 42, 305–316. doi: 10.1016/j.paid.2006.07.010
Raykov, T. (2004). Behavioral scale reliability and measurement invariance evaluation using latent variable modelling. Behav. Ther. 35, 299–331. doi: 10.1016/S0005-7894(04)80041-8
Raykov, T. (2009). Evaluation of scale reliability for unidimensional measures using latent variable modeling. Meas. Eval. Couns. Dev. 42, 223–232.
Regitz-Zagrosek, V. (2012). Sex and gender differences in health. Sci. Soc. 13, 596–603. doi: 10.1038/embor.2012.87
Riecher-Rössler, A. (2017). Sex and gender differences in mental disorders. Lancet Psychiatry 4, 8–9. doi: 10.1016/S2215-0366(16)30348-0
Rosato, N. S., and Baer, J. C. (2012). Latent class analysis: a method for capturing heterogeneity. Soc. Work Res. 36, 61–69. doi: 10.1093/swr/svs006
Rousseau, K. L., Thompson, S., Pileggi, L. A., Henry, M., and Thomas, K. G. (2021). Trends in the prevalence and severity of depressive symptoms among undergraduate students at a South African University, 2016–2019. S. Afr. J. Psychol. 51, 67–80. doi: 10.1177/0081246320977759
Rudenstine, S., and Espinosa, A. (2018). Latent comorbid depression and anxiety symptoms across sex and race/ethnic subgroupings in a national epidemiologic study. J. Psychiatr. Res. 104, 114–123. doi: 10.1016/j.jpsychires.2018.07.005
Salk, R. H., Hyde, J. S., and Abramson, L. Y. (2017). Gender differences in depression in representative national samples: meta-analyses of diagnoses and symptoms. Psychol. Bull. 143, 783–822. doi: 10.1037/bul0000102
Schneider, M., Baron, E., Davies, T., Bass, J., and Lund, C. (2015). Making assessment locally relevant: measuring functioning for maternal depression in Khayelitsha, Cape Town. Soc. Psychiatry Psychiatr. Epidemiol. 50, 797–806. doi: 10.1007/s00127-014-1003-0
Scorza, P., Masyn, K., Salomon, J. A., and Betancourt, T. S. (2018). The impact of measurement differences on cross-country depression prevalence estimates: a latent transition analysis. PLoS One 13:e0198429. doi: 10.1371/journal.pone.0198429
Sharma, P., and Kirmani, M. N. (2013). Exploring depression & anxiety among college going students. Int. J. Sci. Res. 4, 528–532.
Skidmore, S. T., Hsu, H.-Y., and Fuller, M. (2018). A person centred approach to understanding cultures of assessment. Assess. Eval. High. Educ. 43, 1241–1257. doi: 10.1080/02602938.2018.1447082
South African Department of Health [DOH] (2014). National Health Act (Act No. 61 of 2003) Regulations Relating to Research with Human Participants. Government Gazette No. R. 719. Pretoria: Government Printing Works.
South African Department of Health [DOH] (2015). Ethics in Health Research: Principles, Structures and Processes. Available Online at: https://www.health.gov.za/wp-content/uploads/2021/10/nhrec-docs_38000199NationalRegulationCV01.pdf
Spitzer, R. L., Kroenke, K., Williams, J. B. W., and Löwe, B. (2006). A brief measure for assessing generalized anxiety disorder: the GAD-7. Arch. Intern. Med. 166, 1092–1097. doi: 10.1001/archinte.166.10.1092
Sullivan, P. F., Kessler, R. C., and Kendler, K. S. (1998). Latent class analysis of lifetime depressive symptoms in the national comorbidity survey. Am. J. Psychiatry 155, 1398–1406. doi: 10.1176/ajp.155.10.1398
Teymoori, A., Gorbunova, A., Haghish, F. E., Real, R., Zeldovich, M., Wu, Y.-J., et al. (2020a). Factorial structure and validity of depression (PHQ-9) and anxiety (GAD-7) scales after traumatic brain injury. J. Clin. Med. 9:873. doi: 10.3390/jcm9030873
Teymoori, A., Real, R., Gorbunova, A., Haghish, E. F., Andelic, N., Wilson, L., et al. (2020b). Measurement invariance of assessments of depression (PHQ-9) and anxiety (GAD-7) across sex, strata and linguistic backgrounds in a European-wide sample of patients after traumatic brain injury. J. Affect. Disord. 262, 278–285. doi: 10.1016/j.jad.2019.10.035
Thai Quynh-Chi, N., Hoang-Minh, D., and Thi Kim-Anh, L. (2021). Recognition of anxiety disorder and depression and literacy of first-aid support: a cross-sectional study among undergraduate students in Ha Noi, Viet Nam 2018. Health Psychol. Open 8:20551029211015116. doi: 10.1177/20551029211015116
Van de Schoot, R., Lugtig, P., and Hox, J. (2012). A checklist for testing measurement invariance. Eur. J. Dev. Psychol. 9, 486–492. doi: 10.1080/17405629.2012.686740
Van der Walt, S., Mabaso, W. S., Davids, E. L., and De Vries, P. J. (2020). The burden of depression and anxiety among medical students in South Africa: a cross-sectional survey at the University of Cape Town. S. Afr. Med. J. 110, 69–79. doi: 10.7196/SAMJ.2019.v110i1.14151
Wang, J., and Wang, X. (2012). Structural Equation Modeling: Applications using Mplus. Hoboken, NJ: Wiley.
Whalen, D. J., Luby, J. L., Tilman, R., Mike, A., Barch, D., and Belden, A. C. (2016). Latent class profiles of depressive symptoms from early to middle childhood: predictors, outcomes, and gender effects. J. Child Psychol. Psychiatry 57, 794–804. doi: 10.1111/jcpp.12518
Whiteford, H. A., Degenhardt, L., Rehm, J., Baxter, A. J., Ferrari, A. J., Erskine, H. E., et al. (2013). Global burden of disease attributable to mental and substance use disorders: findings from the Global Burden of Disease Study 2010. Lancet 382, 1575–1586. doi: 10.1016/S0140-6736(13)61611-6
Whiteford, H. A., Ferrari, A. J., Degenhardt, L., Feigin, V., and Vos, T. (2015). The global burden of mental, neurological and substance use disorders: an analysis from the global burden of disease study 2010. PLoS One 10:e0116820. doi: 10.1371/journal.pone.0116820
Keywords: anxiety, depression, measurement, sex, Africa, measurement invariance, latent class analysis
Citation: Tadi NF, Pillay K, Ejoke UP and Khumalo IP (2022) Sex Differences in Depression and Anxiety Symptoms: Measurement Invariance, Prevalence, and Symptom Heterogeneity Among University Students in South Africa. Front. Psychol. 13:873292. doi: 10.3389/fpsyg.2022.873292
Received: 10 February 2022; Accepted: 09 May 2022;
Published: 31 May 2022.
Edited by:
Given Hapunda, University of Zambia, ZambiaReviewed by:
Jelena Vrublevska, Riga Stradiņš University, LatviaRainer Leonhart, University of Freiburg, Germany
Martin Seehuus, Middlebury College, United States
Copyright © 2022 Tadi, Pillay, Ejoke and Khumalo. This is an open-access article distributed under the terms of the Creative Commons Attribution License (CC BY). The use, distribution or reproduction in other forums is permitted, provided the original author(s) and the copyright owner(s) are credited and that the original publication in this journal is cited, in accordance with accepted academic practice. No use, distribution or reproduction is permitted which does not comply with these terms.
*Correspondence: Itumeleng P. Khumalo, itumelengk@uj.ac.za