

No CrossRef data available.
Article contents
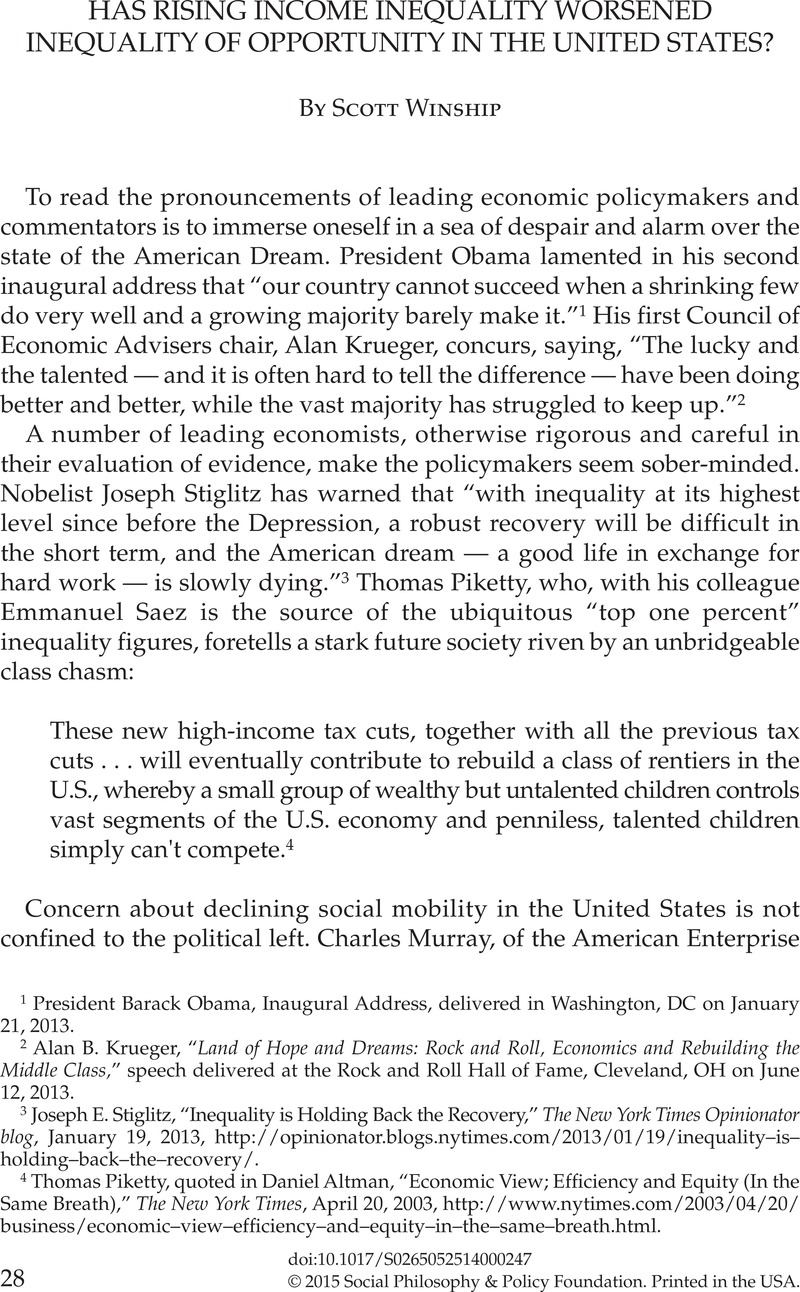
HAS RISING INCOME INEQUALITY WORSENED INEQUALITY OF OPPORTUNITY IN THE UNITED STATES?
Published online by Cambridge University Press: 01 June 2015
Abstract
An abstract is not available for this content so a preview has been provided. Please use the Get access link above for information on how to access this content.
- Type
- Research Article
- Information
- Copyright
- Copyright © Social Philosophy and Policy Foundation 2015
References
1 President Barack Obama, Inaugural Address, delivered in Washington, DC on January 21, 2013.
2 Alan B. Krueger, “Land of Hope and Dreams: Rock and Roll, Economics and Rebuilding the Middle Class,” speech delivered at the Rock and Roll Hall of Fame, Cleveland, OH on June 12, 2013.
3 Joseph E. Stiglitz, “Inequality is Holding Back the Recovery,” The New York Times Opinionator blog, January 19, 2013, http://opinionator.blogs.nytimes.com/2013/01/19/inequality–is–holding–back–the–recovery/.
4 Thomas Piketty, quoted in Daniel Altman, “Economic View; Efficiency and Equity (In the Same Breath),” The New York Times, April 20, 2003, http://www.nytimes.com/2003/04/20/business/economic–view–efficiency–and–equity–in–the–same–breath.html.
5 Murray, Charles, Coming Apart: The State of White America, 1960–2010 (New York: Crown Forum, 2012).Google Scholar
6 Among both social science faculty and journalists, self-identified liberals outnumber conservatives by roughly four to one. See Zipp, John F. and Fenwick, Rudy, “Is the Academy a Liberal Hegemony?” Public Opinion Quarterly 70, no. 3 (2006): 304–26.CrossRefGoogle Scholar The Pew Research Center for the People and the Press found in 1995, 2004, and 2007 surveys of both national and local journalists that self-identified liberals strongly outnumbered conservatives. In 2007, among national journalists, 32 percent declared themselves “very liberal” or “liberal” compared with 8 percent who declared themselves “very conservative” or “conservative.” In 1995, the figures were 22 percent and 5 percent. See Pew Research Center for the People and the Press, “2007 Survey of Journalists Final Topline,” 2008, http://www.stateofthemedia.org/files/2011/02/Journalists-topline.pdf. In contrast, nationally representative surveys of American adults and voters consistently find self-identified conservatives outnumbering liberals by a factor of two to one. Averaging across all of the surveys in which it asked about ideology in 2012 in its daily tracking poll, Gallup found that 38 percent of Americans identify as conservative compared with 23 percent identifying as liberal. See Frank Newport, “Alabama, North Dakota, Wyoming Most Conservative States,” Gallup, Inc., 2013, http://www.gallup.com/poll/160196/alabama-north-dakota-wyoming-conservative-states.aspx.
7 For income growth between 1948 and 1969 for the bottom 80 percent, estimates come from Economic Policy Institute tabulations of data from the Census Bureau’s Current Population Survey. The figures indicate annual change in the family income of families (rather than the family income of individuals). Household income data only go back to 1967, and while family income growth was probably stronger than household income growth from 1948 to 1969, using the former as a proxy for the latter is unlikely to distort the basic trend. “Income” includes cash transfer income from federal programs (such as Social Security, Unemployment Insurance, Supplemental Security Income, and Temporary Assistance for Needy Families) but does not include noncash benefits from employers or government (such as health insurance, food stamps, or housing subsidies). These sources of income were relatively unimportant prior to the 1970s; Medicare and Medicaid were enacted in 1965 and the food stamp program expanded nationally only in the early 1970s. Incomes are measured before taxes. See Economic Policy Institute, “Mean family income, by income group” [data table], The State of Working America (Washington, DC: Economic Policy Institute, 2012), http://www.epi.org/files/2012/data-swa/income-data/Mean%20family%20income,%20by%20income%20group.xlsx.
For income growth within the bottom 80 percent between 1969 and 2007, the estimates are my own, using the Current Population Survey microdata. I show changes in the household income of households (rather than the family income of families or the household income of individuals). Since households became smaller over time as marriage and fertility declined and more people chose to live independently, I adjust income for household size. From 1979 forward it is possible to make other improvements. I add to income noncash federal benefits such as food stamps, Medicaid, and Medicare, and employer-sponsored health benefits. Because there are two different ways of valuing Medicaid and Medicare, which produce very different growth estimates for the bottom fifth, I average across the two approaches for each year before computing income growth. I also use estimates in the CPS data to account for federal and state income taxes (before credits, except that the Earned Income Tax Credit is included in 1989 and 2007), payroll taxes, and property taxes. As with the EPI estimates, capital gains are excluded from these figures. Following the Congressional Budget Office, I also drop households with negative incomes, because such households experienced business or investment losses and are likely to have considerable wealth from which to draw down. Some households with business losses that left them with low but non-negative incomes remain in the data.
The Current Population Survey cannot be used to validly produce estimates of income growth for the richest Americans, so for estimates of top-five-percent income growth across the entire period from 1948 to 2007, the figures of Thomas Piketty and Emmanuel Saez are used. These estimates indicate the change in the mean income of “tax units” (essentially, tax returns, after accounting for a small number of non-filers) rather than of families, households, or individuals. Income is measured before taxes are deducted, and no government or employer benefits are included. See Piketty, Thomas and Saez, Emmanuel, “Income and Wage Inequality in the United States, 1913–2002,” in Atkinson, Anthony B. and Piketty, Thomas, eds., Top Incomes Over the Twentieth Century: A Contrast Between European and English-Speaking Countries (Oxford: Oxford University Press, 2007), 141–225.Google Scholar Updated figures at http://elsa.berkeley.edu/∼saez/TabFig2012prel.xls. The figures cited here are from their series that excludes capital gains, for consistency with the other data sources in the chart.
All income figures were adjusted back to nominal dollars and then inflated using the Bureau of Economic Analysis Personal Consumption Expenditures deflator. Periods are chosen to begin and end with a business cycle peak to ensure comparability.
8 Piketty and Saez, “Income and Wage Inequality in the United States, 1913–2002,” 141–225.
9 If it were possible to add the value of health insurance and noncash transfers to these figures and to take taxes into account, the annual growth rates might look higher relative to the periods from 1979 to 1989 and 1989 to 2007, though they would still fall far short of the period from 1948 to 1969. If the top-five-percent figures could be adjusted for the size of tax units, they might also show stronger growth (perhaps closer to that experienced by the bottom 80 percent).
10 I lack estimates for 1969 that include the value of health insurance and noncash transfers in income and that account for taxes. However the ratio for 1979 was 2.5 and the ratio fell between 1969 and 1979 when income is measured the same way for the two years.
11 Heathcote, Jonathan, Perri, Fabrizio, and Violante, Gianluca, “Unequal We Stand: An Empirical Analysis of Economic Inequality in the United States, 1967–2006,” Review of Economic Dynamics 13, no. 1 (2010): 15–51.CrossRefGoogle Scholar
12 Blank, Rebecca M., Changing Inequality (Berkeley: University of California Press, 2011).CrossRefGoogle Scholar
13 Autor, David H., Katz, Lawrence F., and Kearney, Melissa S., “Trends in U.S. Wage Inequality: Revising the Revisionists,” Review of Economics and Statistics 90, no. 2 (2008): 300–323.CrossRefGoogle Scholar
14 Blank, Changing Inequality. Heathcote, Perri, and Violante find that the ratio of annual earnings for the middle ten percent of male workers to annual earnings for the bottom ten percent has changed little since the early 1980s (Heathcote, Perri, and Violante 2010).
15 Kopczuk, Wojciech, Saez, Emmanuel, and Song, Jae, “Earnings Inequality and Mobility in the United States: Evidence from Social Security Data Since 1937,” Quarterly Journal of Economics 125, no. 1 (2010): 91–128.CrossRefGoogle Scholar
16 Christopher Jencks, Ann Owens, Tracey Shollenberger, and Queenie Zhu, “How Has Rising Economic Inequality Affected Children’s Educational Outcomes?” Unpublished paper, 2010, http://www.hks.harvard.edu/inequality/Seminar/Papers/Jencks11.pdf.
17 Congressional Budget Office, “The Distribution of Household Income and Federal Taxes, 2010,” 2013. Supplemental data available at http://www.cbo.gov/sites/default/files/cbofiles/attachments/44604-AverageTaxRates_Supplemental.xlsx. The papers cited below that look at income concentration trends after accounting for annual accrued capital gains also show declines in middle-class-versus poor inequality. Anomalously, Heathcote, Perri, and Violante find a rise in 50/10 post-tax income inequality and nondurable consumption inequality after the early 1990s. See Heathcote, Perri, and Violante, “Unequal We Stand.”
18 These figures do not account for capital gains — income received from the sale of assets that represents the growth in their value since the time they were purchased — though Piketty and Saez have estimates that do, and show even bigger increases at the top. None of their estimates take into account government benefits, employer-provided health insurance, declining taxes, or declining household size. The Congressional Budget Office has published income estimates that do make these adjustments and also include taxable realized capital gains. Those figures indicate that the average income of the top one percent in 2007 was 4.4 times the 1979 average. See Congressional Budget Office, “The Distribution of Household Income and Federal Taxes, 2010.”
19 There is even some reason to doubt that income concentration has risen, at least since the 1980s. The top income figures that are widely cited either exclude capital gains or include only those gains that are both realized through the sale of assets during the year and taxable. However, the most complete measure of yearly income would include all capital gains accruing over the year, whether assets are sold or held, and regardless of whether or not they are taxable. Capital gains from the sale of homes are not fully taxable, and capital gains accruing in retirement accounts are not realized while people are still working. These are the two most important asset categories for most Americans, so their exclusion from the Piketty-Saez and CBO estimates is problematic. Furthermore, upper-income taxpayers often strategically time the realization of capital gains that have been accruing from asset appreciation depending on the state of the economy and on tax law changes. Realized capital gains are very lumpy accumulations of past annual gains.
A recent paper includes annual accrued gains in household income to look at inequality trends. It accounts for changes in taxes and household size and includes the value of health insurance as part of income. It imputes accrued capital gains to households based on average returns over the previous year. The paper finds that from 1989 to 2007, the incomes of the bottom fifth rose by just 15 percent, and the average income of the middle fifth was flat. However, their most surprising result is that the average income of the top five percent fell by 25 percent. In other words, income inequality declined. See Philip Armour, Richard V. Burkhauser, and Jeff Larrimore, “Levels and Trends in United States Income and Its Distribution A Crosswalk from Market Income Towards a Comprehensive Haig-Simons Income Approach,” Working Paper No. 19110 (Cambridge, MA: National Bureau of Economic Research, 2013).
20 Goldin, Claudia, “The Quiet Revolution That Transformed Women's Employment, Education, and Family,” AEA Papers and Proceedings 96, no. 2 (2006): 1–21.Google Scholar The discussion below draws from: May, Martha, “The Historical Problem of the Family Wage: The Ford Motor Company and the Five Dollar Day,” Feminist Studies 8, no 2 (1982): 399–424CrossRefGoogle Scholar; Milkman, Ruth, Women, Work, and Protest: A Century of U.S. Women’s Labor History (London: Routledge and Kegan Paul, 1985)Google Scholar; Kessler-Harris, Alice, Out to Work: The History of Wage-Earning Women in the United States (Oxford: Oxford University Press, 1983)Google Scholar; Blackwelder, Julia Kirk, Now Hiring: The Feminization of Work in the United States, 1900–1995 (College Station, TX: Texas A & M University Press, 1997)Google Scholar; and Carlson, Allan, The Family in America: Searching for Social Harmony in the Industrial Age (New Brunswick, NJ: Transaction, 2007).Google Scholar
21 Estimates are from the Federal Reserve Bank of St. Louis’s “Federal Reserve Economic Data” (FRED) data archive.
I compare the series on the nominal gross value added of the nonfarm business sector (Series A358RC1A027NBEA) to the series on nominal employee compensation in the nonfarm business sector (Series C4091C0A144NBEA and A4091C0A144NBEA). Since dividing the former by hours worked in the sector gives sector productivity while dividing the latter by hours worked gives hourly compensation, one can assess the relative growth rates of productivity and hourly compensation using these estimates.
22 McGrattan, Ellen R. and Rogerson, Richard, “Changes in the Distribution of Family Hours Worked Since 1950,” Frontiers of Family Economics 1 (2008): 115–38.CrossRefGoogle Scholar
23 Blau, Francine D. and Kahn, Lawrence M., “Changes in the Labor Supply Behavior of Married Women: 1980–2000,” Journal of Labor Economics 25 (2007): 393–438.CrossRefGoogle Scholar
24 Knowles, John A., “Why Are Married Men Working So Much? An Aggregate Analysis of Intra-Household Bargaining and Labor Supply,” Review of Economic Studies 80 (2013): 1055–1085.CrossRefGoogle Scholar
25 Scott Winship, “Men’s Rising Earnings,” (Washington, DC: The Brookings Institution, 2013), http://www.brookings.edu/research/articles/2013/07/01–mens–rising–earnings.
26 Scott Winship, “Choosing Our Battles: Why We Should Wage a War on Immobility Instead of Inequality,” testimony before the Joint Economic Committee, U.S. Congress, January 16, 2014, http://www.jec.senate.gov/republicans/public/?a=Files.Serve&File_id=4472dcdb–4bc9–40e0–974d–dc050719891e.
27 The only exception to this requirement is that if positions are defined with respect to larger reference groups that encompass children and their parents, then a child can move up without another child moving down. For instance, percentiles might be defined in the parent generation such that nonparents are also included, or they could be defined in the child generation such that same-age immigrants are included. In an extreme case, if new immigrants occupy the bottom 10 percent of positions, then every native-born child raised below the tenth percentile could experience upward relative mobility (with immigrants included in determining percentiles) without any native-born child having to experience downward relative mobility.
28 Hout, Michael and Janus, Alexander, “Educational Mobility in the United States Since the 1930s,” in Duncan, Greg J. and Murnane, Richard J., eds., Whither Opportunity? Rising Inequality, School, and Children’s Life Chances (New York: Russell Sage Foundation, 2011).Google Scholar
29 Hout and Janus, “Educational Mobility in the United States Since the 1930s”; Broucker, Patrice de and Underwood, Kristen, “Intergenerational Education Mobility: An International Comparison with a Focus on Postsecondary Education,” Education Quarterly Review 5, no. 2 (1998): 30–51.Google Scholar Hout and Janus find declines in college graduation rates for all men regardless of paternal educational attainment, but the declines are biggest among the sons of the most-educated fathers, plus fathers’ educational attainment increased over time. Among daughters, college graduation rates declined only for the daughters of the best-educated fathers. De Broucker and Underwood find that the main change in absolute educational mobility between 1940s cohorts and 1960s cohorts was a decline in the likelihood of college graduation for children with a college-educated parent.
30 Several studies consider trends in the incremental boost to child educational attainment from additional parental educational attainment. They tend to find that changes in absolute educational mobility between the cohorts born in the early twentieth century and those born around 1980 were either opportunity equalizing or benign. That is, the coefficients on parental education in regression models tend not to increase over time. See Hertz, Tom, Jayasundera, Tamara, Piraino, Patrizio, Selcuk, Sibel, Smith, Nicole, and Verashchagina, Alina, “The Inheritance of Educational Inequality: International Comparisons and Fifty-Year Trends,” B.E. Journal of Economic Analysis and Policy 7, no. 2 (2007): 1–46Google Scholar; Hout and Janus, “Educational Mobility in the United States Since the 1930s”; and Bloome, Deirdre and Western, Bruce, “Cohort Change and Racial Differences in Educational and Income Mobility,” Social Forces 90, no. 2 (2011): 375–95.CrossRefGoogle Scholar Bloome and Western find generally flat trends across the first two NLS surveys, except that white sons with college educated fathers obtained more schooling over time (but those with college educated mothers did not). Hout and Janus find similar trends for sons and daughters. Hertz et al. group sons and daughters together. There is also a small literature looking at trends in intergenerational correlations (as opposed to elasticities), which is somewhere in between asking whether changes in absolute mobility increased or diminished inequality of absolute educational outcomes between rich and poor children and asking whether changes in relative mobility increased or diminished inequality of relative educational outcomes between rich and poor children. The research is mixed. Hertz et al. found that changes in mobility increased educational disparities between rich and poor children for cohorts born 1929–1934 through 1975–1980. Fabian Pfeffer found little change in mobility’s impact on rich-poor disparities between 1930s and 1960s birth cohorts, and de Broucker and Underwood found no change or a reduction of rich-poor disparities between 1940s and 1960s cohorts. See Hertz et al., “The Inheritance of Educational Inequality”; de Broucker and Underwood, “Intergenerational Education Mobility”; and Fabian T. Pfeffer, “Persistent Inequality in Educational Attainment and its Institutional Context,” European Sociological Review 24, no. 5 (2008): 543–65.
31 Guest, Avery M., Landale, Nancy S., and Mccann, James C., “Intergenerational Occupational Mobility in the Late 19th Century United States,” Social Forces 68, no. 2 (1989): 351–78CrossRefGoogle Scholar; Hauser, Robert M., Warren, John Robert, Huang, Min-Hsiung, and Carter, Wendy Y., “Occupational Status, Education, and Social Mobility,” in Arrow, Kenneth, Bowles, Samuel, and Durlauf, Steven, eds., Meritocracy and Economic Inequality (Princeton, NJ: Princeton University Press, 2000)Google Scholar; Beller, Emily and Hout, Michael, “Intergenerational Social Mobility: The United States in Comparative Perspective,” Future of Children 16, no. 2 (2006): 19–36.CrossRefGoogle ScholarPubMed Hauser et al.’s Table 8.1 shows trends by age group for white men that suggest absolute mobility rising between the 1898–1907 and 1932–1943 cohorts and falling between the 1929–1938 and 1952–1963 cohorts. Beller and Hout show upward and downward mobility trends in their Table 4 for all men.
32 Beller and Hout, “Intergenerational Social Mobility.”
33 Several studies estimate trends in absolute occupational mobility over calendar years rather than birth cohorts. See Featherman, David L. and Hauser, Robert M., Opportunity and Change (New York: Academic Press, 1978)Google Scholar; Hout, Michael, “More Universalism, Less Structural Mobility: The American Occupational Structure in the 1980s,” American Journal of Sociology 93, no. 6 (1988): 1358–1400CrossRefGoogle Scholar; Jonsson, Jan O., Grusky, David B., Pollak, Reinhard, Di Carlo, Matthew, and Mood, Carina, “Occupations and Social Mobility: Gradational, Big-Class, and Micro-Class Reproduction in Comparative Perspective,” in Erikson, Robert, Jantti, Markus, and Smeeding, Timothy, eds., Persistence, Privilege, and Parenting: The Comparative Study of Intergenerational Mobility (New York: Russell Sage, 2011)Google Scholar; Grusky, David B. and DiPrete, Thomas A., “Recent Trends in the Process of Stratification.” Demography 27 (1990): 617–37.CrossRefGoogle ScholarPubMed Featherman and Hauser found rising absolute mobility between 1962 and 1973, all of it downward. Hout found a flat trend for men and women between 1972–1975 and 1982–1985, but for men it was produced by a decline in upward mobility and a rise in downward mobility. Jonsson et al. found an increase in absolute mobility from 1962 to 1972–1979 and a flat to declining trend between 1972–1979 and 1990–2006. They did not look at upward or downward mobility. Grusky and DiPrete examine the trend in the elasticity of sons’ occupational status with respect to fathers’ status, finding an increase in mobility from 1972 to 1987, though the trend was not statistically significant.
34 Until recently, most research had found that relative mobility among white men had increased or changed little between cohorts born in 1899–1909 and those born in the 1950s. See, for instance, Hout, Michael, “Status, Autonomy, and Training in Occupational Mobility,” American Journal of Sociology 89, no. 6 (1984): 1379–1409CrossRefGoogle Scholar; and Hauser et al., “Occupational Status, Education, and Social Mobility.” Calendar-year-based trend research also supported this conclusion. See Featherman and Hauser, Opportunity and Change.
However, the new census-based research suggests that holding the occupational structure fixed, a man’s occupation became more strongly tied to his father’s over the period through the 1930s. See Long, Jason and Ferrie, Joseph, “Intergenerational Occupational Mobility in Great Britain and the United States Since 1850,” American Economic Review 103, no. 4 (2013): 1109–37CrossRefGoogle Scholar; Ferrie, Joseph P., “The End of American Exceptionalism? Mobility in the United States Since 1850,” Journal of Economic Perspectives 19, no. 3 (2005): 199–215CrossRefGoogle Scholar; and Guest et al., “Intergenerational Occupational Mobility in the Late 19th Century United States.” Ferrie finds little change in relative mobility between the 1934–1940 and 1959–1965 cohorts. Guest et al. find an increase in relative mobility between the 1928–1937 and 1939–1948 birth cohorts. This downward trend in relative mobility, however, was driven by the combination of a secular decline in farming and continued high rates of inheritance of those family farms that remained. The odds of entering farming were much lower over time for sons of nonfarmers than for sons of farmers. It is not obvious that the greater mobility into farming in the nineteenth century was beneficial to the sons of nonfarmers, given the demands of the job. See Xie, Yu and Killewald, Alexandra, “Intergenerational Occupational Mobility in Great Britain and the United States Since 1850: Comment,” American Economic Review 103, no. 5 (2013): 2003–20CrossRefGoogle Scholar; Hout, Michael and Guest, Avery M., “Intergenerational Occupational Mobility in Great Britain and the United States Since 1850: Comment,” American Economic Review 103, no. 5 (2013): 2021–40CrossRefGoogle Scholar; and Long, Jason and Ferrie, Joseph, “Intergenerational Occupational Mobility in Great Britain and the United States Since 1850: Reply,” American Economic Review 103, no. 5 (2013): 2041–49.CrossRefGoogle Scholar
While the models used to estimate relative mobility are on surer ground in more recent decades, by which time the industrial occupational structure had settled into place, the research comes to conflicting conclusions. Relative mobility may have fallen between cohorts born in the 1950s and those in the 1970s. See Beller, Emily, “Bringing Intergenerational Social Mobility Research Into the Twenty-First Century: Why Mothers Matter,” American Sociological Review 74 (2009): 507–28.CrossRefGoogle Scholar A calendar-year-based study also recently found declining relative mobility. See Pablo A. Mitnik, Emily Cumberworth, and David B. Grusky, “Social Mobility in a High Inequality Regime,” working paper, Stanford Center on Poverty and Inequality, 2013. Contradicting these findings of declining relative mobility, however, are several calendar-year-based studies. See Hout, “More Universalism, Less Structural Mobility”; Jonsson et al., “Occupations and Social Mobility”; Steven Rytina, “Is Occupational Mobility Declining in the U.S.?” Social Forces 78, no. 4 (2000): 122776.
35 Beller and Hout, “Intergenerational Social Mobility.”
36 Hout, “More Universalism, Less Structural Mobility.” Guest et al. find that between the cohorts of the 1930s and 1940s, upward mobility fell slightly and downward mobility rose. But their tables indicate that upward mobility from the bottom increased and downward mobility from the top rose a bit while it fell slightly for lower-status sons. See Guest et al., “Intergenerational Occupational Mobility in the Late 19th Century United States.”
37 To my knowledge, no study has looked at trends in absolute income mobility by simply comparing individuals’ incomes to those of their parents at the same age.
38 Claudia Olivetti and M. Daniele Paserman, “In the Name of the Son (and the Daughter): Intergenerational Mobility in the United States, 1850–1930,” Working paper, 2013. Aaronson, Daniel and Mazumder, Bhashkar, “Intergenerational Economic Mobility in the United States, 1940 to 2000,” Journal of Human Resources 43, no. 1 (2008): 139–72.CrossRefGoogle Scholar Olivetti and Paserman look at sons’ and sons-in-law’s earnings and the imputed earnings of their father and father-in-law. The imputation is in two parts. Men in the paternal generation are assigned the mean earnings that accrued in the mid-twentieth century to the occupation they hold. Then a man is assigned paternal earnings equal to the mean earnings of all fathers in a given year whose own son shared the man’s first name. Olivetti and Paserman find similar trends for sons and sons-in-law. Aaronson and Mazumder also impute paternal earnings to men. They use the average parental income in a man’s birth state among men with sons of a similar age ten to thirty years earlier.
39 Reville, Robert T., “Two Essays on Intergenerational Earnings and Wage Mobility,” Doctoral Dissertation, Brown University, 1996; Mary Corcoran, “Mobility, Persistence, and the Consequences of Poverty for Children: Child and Adult Outcomes,” in Danziger, Sheldon H. and Haveman, Robert H., eds., Understanding Poverty (New York and Cambridge, MA: Russell Sage Foundation and Harvard University Press, 2001)Google Scholar; David I. Levine and Bhashkar Mazumder, “Choosing the Right Parents: Changes in the Intergenerational Transmission of Inequality —Between 1980 and the Early 1990s,” Federal Reserve Bank of Chicago Working Paper 2002–08, 2002; Fertig, Angela R., “Trends in Intergenerational Earnings Mobility in the United States,” Journal of Income Distribution 12 (2003): 108–30Google Scholar; Nam, Yunju, “Is America Becoming More Equal for Children? Changes in the Intergenerational Transmission of Low- and High-Income Status,” Social Science Research 33 (2004): 187–205CrossRefGoogle Scholar; Mayer, Susan E. and Lopoo, Leonard M., “Has the Intergenerational Transmission of Economic Status Changed?” Journal of Human Resources 40, no. 1 (2005): 169–85CrossRefGoogle Scholar; Harding, David J., Jencks, Christopher, Lopoo, Leonard M., and Mayer, Susan E., “The Changing Effect of Family Background on the Incomes of American Adults,” in Bowles, Samuel, Gintis, Herbert, and Groves, Melissa Osbourne, eds., Unequal Chances: Family Background and Economic Success (New York and Princeton, NJ: Russell Sage Foundation and Princeton University Press, 2005)Google Scholar; Hertz, Tom, “Trends in the Intergenerational Elasticity of Family Income in the United States,” Industrial Relations 46, no. 1 (2007): 22–50Google Scholar; and Lee, Chul-In and Solon, Gary, “Trends in Intergenerational Income Mobility,” Review of Economics and Statistics 91, no. 4 (2009): 766–72.CrossRefGoogle Scholar Hertz suggests that the PSID samples may be too small to identify trends in mobility.
40 Levine and Mazumder, “Choosing the Right Parents”; Bloome and Bruce Western, “Cohort Change and Racial Differences in Educational and Income Mobility.”
41 Scott Winship, “The Dream Abides: Economic Mobility in America from the Golden Age to the Great Recession,” paper prepared for the “Inequality Reexamined” conference, Harvard University, October 11, 2013.
42 Aaronson, Daniel and Mazumder, Bhashkar, “Intergenerational Economic Mobility in the United States, 1940 to 2000,” Journal of Human Resources 43, no. 1 (2008): 139–72.CrossRefGoogle Scholar
43 Raj Chetty, Nathaniel Hendren, Patrick Kline, Emmanuel Saez, and Nicholas Turner, “Is the United States Still a Land of Opportunity? Recent Trends in Intergenerational Mobility,” NBER Working Paper No. 19844 (Cambridge, MA: National Bureau of Economic Research). The authors used as their measure the regression coefficient relating parent and child income after converting both to percentiles, making it the relative mobility analogue to the intergenerational elasticity.
44 There are no other studies that consider long-run trends in relative income mobility, where adult ranks are compared with parental ranks. Fertig finds that over a five-year period (1968–1972 through 1972–1976) upward earnings mobility from the bottom fifth of fathers increased while it may have declined slightly for sons starting in the middle fifth. Downward mobility from the top fifth of fathers may have increased slightly and it increased for sons starting in the middle. See Fertig, “Trends in Intergenerational Earnings Mobility in the United States.” The intergenerational correlation coefficient may be thought of as something in-between an absolute mobility measure and a relative mobility measure. The correlation coefficient is just the elasticity after parental and child incomes have been standardized by subtracting them from their means and dividing by their standard deviations. Reville finds varying results for the correlation between father and son earnings for cohorts born between 1952 and 1961, but little evidence of secular increases or declines. See Reville, “Two Essays on Intergenerational Earnings and Wage Mobility.” For cohorts born between 1968–1972 and 1972–1976, Fertig finds declines in the correlation between father and son earnings and between mother and son earnings — indicating mobility changes that reduce disparities between rich and poor children — though neither is statistically significant. See Fertig, “Trends in Intergenerational Earnings Mobility in the United States.”
45 Several studies consider trends in educational attainment by parental income, and many more attempt to estimate the causal effect of “parental socioeconomic status” on educational attainment or occupational status. I am here focused on the descriptive trend in how parent and child educational attainments or parent and child occupational statuses are associated. Other studies of trends in mobility that combine economic, educational, and occupational concepts include Harding et al., “The Changing Effect of Family Background on the Incomes of American Adults,” and Robert M Hauser, “Intergenerational Economic Mobility in the United States: Measures, Differentials, and Trends,” CDE Working Paper 98–12 (Madison, WI: University of Wisconsin–Madison Center for Demography and Ecology, 2010). See also Levine, David I. and Mazumder, Bhashkar, “The Growing Importance of Family: Evidence from Brothers’ Earnings,” Industrial Relations 46, no. 1 (2007): 7–21.Google Scholar A new book leverages the information on heritability contained in surnames to estimate trends in social mobility across a range of countries, finding little change over centuries and small cross-national differences. See Clark, Gregory, The Son Also Rises: Surnames and the History of Social Mobility (Princeton, NJ: Princeton University Press, 2014).Google Scholar
46 Economic Mobility Project, “Pursuing the American Dream: Economic Mobility Across Generations,” (Washington, DC: Pew Charitable Trusts, 2012).