 Yanli Yang
 Fangmei Liang
 Fangying Quan
 Guangyu Jiang
 Ke Yu
Ke Yu Yong Zheng
- 1Center for Studies of Education and Psychology of Ethnic Minorities in Southwest China, Southwest University, Chongqing, China
- 2Teaching Department of Public Course, Ningxia Art Vocational College, Yinchuan, China
- 3Faculty of Psychology, Southwest University, Chongqing, China
In this study we developed the Chinese Minority Ethnic Value Questionnaire (CMEVQ) and the Chinese Minority Ethnic Value-Expressive Behavior Questionnaire (CMEVEBQ) to assess the importance of ethnicity from the standpoint of diverse ethnic values and behavioral manifestations. Drawing on self-construal theory, social identity theory, and value theory, we conducted a review of literature, in-depth interviews, semi-structured questionnaires, and expert reviews. A total of 18 items for the CMEVQ and CMEVEBQ were developed. Data were collected from three samples of Chinese ethnic minorities (mainly college students). We generated two sets of item pools from the pilot sample (n = 438). Then we examined the dimensions and final items of the CMEVQ and CMEVEBQ using exploratory factor analysis (EFA) with sample 1 (n = 665). After that, we conducted a confirmatory factor analysis (CFA) to recheck the factor structure of two refined, mutually matched, yet independent scales obtained from Study 1 with sample 2 (n = 1309); meanwhile criterion-related, K-means cluster, t-tests, and multiple regression analyses were used to test the validity of and relationship between the CMEVQ and CMEVEBQ. Results showed that the multidimensional constructs with six shared first-order factors (Minority Ethnic Consciousness, Exploration, Involvement, Alienation, Inheritance, and Mastery) demonstrated a better fit for the data and supported the conceptual framework. Both questionnaires demonstrated adequate internal consistency reliability, convergent and discriminant validity, and ecological validity. That is, as practical, psychometrically sound measures, the CMEVQ and CMEVEBQ can be used to measure the importance of ethnicity for Chinese ethnic minorities. They also extend the content and sample fields of value research.
Introduction
China is known to be a multiethnic nation, with the majority Han ethnic group (Minzu) representing mainstream culture and the 55 officially defined minority ethnic groups each with their own unique cultures. According to the famous sociologist and anthropologist Fei (1999), the term minzu refers to the unity of all ethnic groups in China, namely the whole Chinese nation, as well as to each individual ethnic group that makes up the Chinese nation. With the development of economic globalization, ethnic minorities who were once living in relatively closed environments have increased contact with modern mainstream culture, and the uniqueness of each ethnic minority has become increasingly challenged. Hence, maintaining the diversity of the Chinese nation and the ethnicity of minority ethnic members has become a pressing concern.
Verkuyten (2005, p. 198) contended that members of majority and minority ethnic groups can identify each other using four “ways of ethnicity”: being (individuals’ ethnic self-category; Phinney, 1996), feeling (individuals’ emotions or affect toward the ethnic group; Ong et al., 2010), knowing (individuals’ thoughts or cognition toward the ethnic group; Ong et al., 2010), and doing (individuals’ ethnic practices and social interaction; Phinney, 1992). However, the contents of each “way of ethnicity” that are particularly important or desirable in influencing ethnic members’ selection of actions and evaluation of events, remain undetermined. The goal of this study was to explore the “ways of ethnicity” of ethnic minority groups. Values are often important guidelines for people’s lives (Kluckhohn, 1951; Williams, 1968; Rokeach, 1973; Schwartz, 1992), and we thus we named these particularly important reflections of ethnicity “ethnic-minority-values.”
In fact, values tend to be defined at an abstract level in the real-world context, which makes it difficult to comprehend their content and importance; accordingly, the typically important ideals in measures of values are at least perceived by most individuals (Maio, 2010). When applied, values need to be related to something concrete, particularly to instantiations that can express them in ways other than subsuming diverse behaviors as exemplars of their concepts (Hanel et al., 2018). Researchers have gradually come to focus on value-expressive behaviors or to test the correlation between values and behavior in value-consistent directions (e.g., Verplanken and Holland, 2002; Schwartz and Butenko, 2014). Therefore, another aim of this study was to explore the value-expressive behaviors of ethnic minorities; that is, guided by ethnic-minority-values, it examined how ethnic members behaved to indicate their ethnicity and their relationships with their own ethnic groups. These behaviors may be driven either internally or externally, consciously or unconsciously, but should be chosen a priori to express their ethnic values (Schwartz and Butenko, 2014).
Drawing on self-construal theory, social identity theory (Tajfel, 1981; Tajfel and Turner, 1986), and value theory (Schwartz, 1992; Schwartz et al., 2012), we provided an operational definition for ethnic-minority-value, and developed two new mutually matched, yet independent, ethnic questionnaires, the Chinese Minority Ethnic Value Questionnaire (CMEVQ) and the Chinese Minority Ethnic Value-Expressive Behavior Questionnaire (CEMVEBQ). Inspired by Verkuyten’s (2005) ways of ethnicity and Phinney and Ong’s components of ethnic identity, we defined six shared dimensions for both questionnaires as follows: “being”—which we denoted as minority ethnic consciousness (MEC), “feeling”— minority ethnic involvement (MEIV) and minority ethnic alienation (MEA), “knowing”— minority ethnic exploration (MEE), and “doing”— minority ethnic inheritance (MEIH) and minority ethnic mastery (MEM). Multiple statistical methods were used to examine the psychometric properties, particularly the construct validity, of the two questionnaires.
Ethnic-Minority-Values as a Necessary Part of Members’ Ethnic Self-Description: A Self-Construal Perspective
The emergence of a person’s various social identities is an essential prerequisite for the emergence of their personal identities and personality development (Swann and Bosson, 2010). Individuals’ initial self-construal is usually derived from the implicit or explicit expectations of various societal agents (e.g., family members) rather than beginning with self-awareness and self-reflection (Abrams, 2015). Tajfel and Turner (1986) defined social identity as “those aspects of an individual’s self-image that derive from the social categories to which he perceives himself as belonging” (p. 16). Thus, when an individual has an ethnic affiliation, their self-definition includes the expectations of their ethnic group, which has been found to be of considerable importance for self-concept among minority ethnic groups (Verkuyten, 2005). The “old” generation is unaware of the need to distinguish itself from others through intragroup comparison due to its common strong ethnicity. In contrast, the “new” generation, due to increasing contacts with “external” cultures, is more aware of intergroup and intragroup differences, which demonstrates their degree of acculturation and leads to wide variation in the recognition of importance of ethnicity. Fading cultural differences may cause members to emphasize their ethnic belonging, particularly for the most acculturated minority individuals (Verkuyten, 2005). Ethnicity may be of particular value in the self-construal of minority ethnic groups, which may influence choices and behaviors when activated (Verplanken et al., 2009).
Ethnic-Minority-Value as a Basis of Ethnic Identity: A Social Identity Theory Perspective
Social identity theory (SIT: Tajfel and Turner, 1986) states that identity is linked to the value and evaluative significance of group membership. Ethnic identity, one part of social identity, incorporates both individuals’ knowledge of membership in their own ethnic group and the values and feelings attached to that membership (Tajfel, 1981, p. 255). Those who are characterized as high identifiers regard ethnic-group-value as being more important than those who are low identifiers (Verkuyten, 2006). Compared with the ethnic identity of the majority group, the ethnic identity of the minority group is not only related to its group but also to the “inside” of its own group. In other words, minority ethnic groups are “ethnic” from the “inside” due to a common imagined origin and culture, which are also used in constructing ethnic identity (Verkuyten, 2005). Further, ethnic cultures characterized by structure and continuation are usually expressed by factors such as central values and symbols. As previously stated, ethnic-minority-value is one factors that can identify an ethnic group. Thus, some researches on ethnic identity have not only considered values of an ethnic group as an essential component of ethnic identity, but also have used group-specific values as a variable to measure ethnic identity (e.g., Tajfel, 1981; Phinney and Ong, 2007).
Ethnic Behavior as a priori Selection of the Value Expression of Ethnic Minority: A Value Theory Perspective
Since Verkuyten’s (2005) description of “doing” as one of the “ways of ethnicity,” ethnic behaviors, as ethnic practices and social interaction, have often been included in measures of ethnic identity. However, value theories have postulated that values are one significant factor of influence in everyday behavior and that behavior expresses important values to achieve the goals that are important to people and confirm the values that are critical to their self-identification (Schwartz, 2006). Furthermore, as the expression of underlying goal motivation (Roccas and Sagiv, 2010) and the mental representation of desirable goals (Maio, 2015), values encourage behaviors that promote and instantiate such goals. Here, we developed ethnic-minority-behavior as the a priori selection of the value expression of an ethnic minority. This was done for two main reasons: first, to instantiate the abstract concept of ethnic-minority-values; second, to preserve and confirm “ethnicity” from the standpoint of ethnic inheritance since “doing” or behaving is subject to change (Fishman, 1980).
In practice, however, behavior has proven particularly difficult to measure due to the variability caused by specific situational factors (Verkuyten, 2005). Multiple ethnic values may motivate most specific ethnic behaviors. For example, ethnic members may be motivated to participate in their own ethnic festivals by the values of ethnic involvement, ethnic consciousness, and/or ethnic inheritance. Furthermore, many ethnic behaviors express ethnic values more than they express other values. For example, spreading information on one’s own ethnic culture primarily expresses value in ethnic exploration while feeling cordial when observing matters related to one’s own minority group primarily expresses the value of ethnic involvement. Thus, we sought to explore whether each ethnic-minority -behavioral tendency can more typically express an ethnic-minority-value more than any other behavioral tendency, based on its conceptual definition. This required separate ethnic-minority-behavioral tendencies to be measured for each ethnic-minority-value. Additionally, for conceptual clarity, ethnic behaviors should be separated from ethnic values, which will allow the results to be measured and analyzed separately to distinguish the implications of value and its expressive behaviors.
Definition of Ethnic-Minority-Value
The unique culture of each Chinese ethnic minority differentiates them from other minorities, which forms diverse eco-ethnological environments and sparks numerous relevant ethnological and sociological studies. Although there is no consensus on the concept of ethnic psychology in China, scholars generally have incorporated ethnic values as a basic element in ethnic psychology (e.g., Xu and Qi, 1996; Qi, 2000; Hou, 2008; Tu, 2010). Hou (2008) defines ethnic values as the sum of stable attitudes and choice tendencies, including feeling components, which come from evaluating the significance of ethnic culture by minority ethnic members according to their own needs. Tu (2010) has defined ethnic values as people’s most basic views on nationality and ethnic issues, which influence their attitudes and ways of dealing with specific ethnic issues, the essence of which is to safeguard and develop one’s own ethnic group’s interests and status. The term “Minzu” (ethnic group) in their definitions applies both to the majority ethnic group, such as ethnic Han, but also to minority ethnic groups. They did not exactly characterize the ethnicity of minority ethnic groups from the ethnic “inside.” Furthermore, several Western scholars have applied the term ethnic value as a psychometric indicator of immigrants’ acculturation (e.g., Koh et al., 2009) or ethnic identity (e.g., Phinney and Ong, 2007), but failed to explore its meaning. The present research attempted to enrich existing theory and methods of ethnic-minority-value using a sample of diverse and understudied minority ethnic groups in China.
Ethnic-minority-values have a complex, multidimensional structure encompassing various psychological traits of minority ethnic groups. As an essential component of ethnic identity, ethnic-minority-values refers to minority ethnic members’ self-perception of the importance of ethnicity based on their own ethnic contacts and practices; it indicates ethnic belonging, ethnic feeling, and recognition of one’s own ethnic group through, for example, ethnic language, customs, and religion, and is a subjective criterion for ethnic members to select and evaluate matters relevant to their own ethnic group. The concept of ethnic-minority-values is transforming. While some of its elements are gradually disappearing due to incompatibility with modern society, it also actively integrates new cultural factors, e.g., views, ways of life, or social norms (Hou, 2008). In addition, we have described ethnic-minority-value-expressive behaviors as a set of typical instantiations that express the content of various values among ethnic minorities.
Overview of the Present Study
In summary, the present study aimed to (a) explore the content and construct validity of two new measures using experts’ reviews and diverse statistical procedures; (b) demonstrate support for two multidimensional measures that is consistent with the psychological operational definition of ethnic value among ethnic minorities in China; and (c) evaluate the criterion-related, discriminant, and ecological validity and relationships of the two new scales, which can be used collaboratively or independently. We purposefully sampled from multiple minority ethnic groups in China, regardless of demographic variables such as occupation and age, for two distinct benefits. First, the newly developed scales aimed to explore the common importance of ethnicity among minorities, and theoretically, they would be more directly affected by ethnicity strength than by demographic variables. Second, ethnic values and its corresponding behaviors could be affected by cultural context and minority ethnic living areas; thus, we sampled ethnic participants from a cultural context in which multiple minority groups live together to hold these influences constant.
The Pilot Study
This study aimed to generate two sets of conceptually and empirically viable self-report item pools. Drawing on the format of item portrayal in Portrait Values Questionnaire (PVQ; Schwartz et al., 2012), items in CMEVQ described minority ethnic basic views on something important to their own ethnic groups, and CMEVEBQ used the act-frequency approach (Buss and Craik, 1983) to measure behavioral tendency to express minority ethnic values. All items are well-understood by the general population. We expected the item content in CMEVQ and CMEVEBQ to represent the importance of ethnicity by way of ethnic values and its postulated behavior tendency.
Methods
Participants
Two samples were used that comprised 103 and 335 Chinese ethnic minority participants, respectively. Each participant’s minority ethnic identity was self-reported, and we assessed whether both participant and one of their parents were from the same ethnic group, which is the same method that was used in the subsequent studies reported in this paper. The first group was recruited from the ethnic department of Southwest University, and comprised participants educated to undergraduate level and above, including 86.4% (n = 89) students and 13.6% (n = 14) working people. Their mean age was 22.18 years (SD = 4.91), ranging from 17 to 40 years; 33.0% (n = 34) were men and 67.0% (n = 69) were women, 64.0% (n = 66) were from minority-inhabited areas, 36% (n = 37) were from minority-scattered areas, 67% (n = 69) were from rural areas, the parents of 60.2% (n = 62) of participants were of the same minority ethnic group, and 91.3% (n = 94) were single. Educationally, 78.6% (n = 81) were undergraduate students while 21.4% (n = 22) were graduate students. They included 20 of the 55 Chinese ethnic minorities: Miao, Tung, Tujia, Yi, Naxi, Gelao, Tibetan, Qiang, Mulam, Shui, Zhuang, Mongolian, Uygur, Hui, Yao, Buyi, Li, Dai, Kazakh, and Wa. Twelve participants agreed to participate in further interviews.
The second sample comprised 126 men and 209 women. They came from 12 of the 34 provinces/regions of China (based on IP address) and covered 26 Chinese ethnic minorities (Miao, Yi, Tujia, Bai, Tung, Hui, Buyi, Hani, Zhuang, Dai, Gelao, Uygur, Shui, Chuanqing, Tibetan, Mongolian, Manchu, Mulam, Naxi, Qiang, Yao, Korean, Kazakh, Lahu, Li, and Tu). Their ages ranged from 15 to 42 years with a mean age of 22.22 years (SD = 4.68). Professionally, there were 75.5% (n = 253) students and 24.5% (n = 82) working people; 64.5% (n = 216) were from minority-inhabited areas and 35.5% (n = 119) from minority-scattered areas; 47.2% (n = 158) were from rural areas, the parents of 75.8% (n = 254) of participants were of the same minority ethnic group, and 83.6% (n = 280) were single. Regarding educational level, 2% and 8.1% (n = 27) respectively had primary and junior middle school education, while 12.2% (n = 41) were senior high school students, 12.2% (n = 51) were junior college students, 58.8% (n = 197) were undergraduates, and 2.1% (n = 17) were graduate students.
Measures
The initial item pools of the CMEVQ and CMEVEBQ were generated following a semi-structured questionnaire, in-depth interviews with ethnic minorities, and existing questionnaires related to ethnic values (Hou, 2008; Tu, 2010; Hu et al., 2014) and ethnic behavior (Phinney, 1992; Phinney and Ong, 2007; Gaines et al., 2016). In addition to the demographic measures, the semi-structured questionnaires and interviews included the following open-ended questions: (1) Concerning minority ethnic consciousness: (a) Under what circumstances can you perceive your minority ethnic identity? (b) In your daily life, what actions have you ever engaged in to indicate your ethnic affiliation? (2) Regarding minority ethnic involvement: (a) What are your feelings for your own ethnic group? (b) How have you ever showed your feelings to your ethnic group in your life? (3) Concerning minority exploration: (a) How do you obtain knowledge about your ethnic group as you grow up? (b) What other ways do you think contribute to ethnic minorities’ exploring their own ethnic group? (4) Regarding minority ethnic mastery: (a) What do you think of the relationship between your ethnic group and society or nature? (b) What are the most important (most valuable) factors in making your ethnicity last longer? All initial questions were free of cultural content regarding specific minority ethnic groups to ensure they were applicable to any minority ethnic group.
Overall the initial item pools consisted of 63 items on the CMEVQ and 56 items on the CMEVEBQ. Each item in the CMEVQ comprised a short, gender-matched, verbal portrait of different minority ethnic member, each describing a Minzu-related goal, varying in importance to them and serving as guiding principles in maintaining their ethnicity. For example, “It is important to honor his/her own, diverse ethnic taboos.” The importance of this goal to an ethnic member suggests his/her ethnic consciousness and determines whether he/she will engage in relevant activities in his/her daily life whenever he/she has the opportunity. The respondents indicated how similar the ethnic member in the portrait is to themselves on a 6-point Likert-type response scale ranging from 1 (not like me) to 6 (very much like me) (Schwartz et al., 2012). The items in the CMEVEBQ were designed to measure how frequently the minority ethnic respondents had engaged in each Minzu-related behavior in their daily lives on a 4-point scale ranging from 0 (never doing) to 4 (always doing). The response “never had one opportunity to perform the behavior described by item” was labeled X and treated as missing data.
Procedure
The study was performed via an online Chinese survey platform1, which was used in the subsequent studies, using the snowball sampling method. To recruit the first group of participants, we sent the online link consisting of demographic characteristics and two questionnaires to minority ethnic undergraduates known to the authors, who then forwarded the link to their ethnic friends, classmates, and siblings. The respondents had 1 day to return the survey. The first group completed the semi-structured questionnaire, and 12 participants were then selected for in-depth interviews. Subsequently, the same researcher twice performed a content frequency analysis of similar and key information in 103 responses and 12 interviews, in terms of six populated pits – MEC, MEE, MEIV, MEA, MEIH, and MEM, over a 20-day interval. For the second group of participants we sent the online link, consisting of standard instructions explaining our research purpose, demographic variables, and the initial 63-item CMEVQ and 56-item CMEVEBQ based on the frequency analysis, to three teachers from Southwest Minzu University. They forwarded the online link to their class QQ or Wechat groups. The respondents were expected to individually complete the survey in the classroom within 20 min. As a monetary reward, we paid 10 Yuan RMB per survey submitted. We then conducted a statistical item-analysis of 335 responses to the two questionnaires and the experts reviewed the content validity and semantic analysis of the retained items.
Data Analyses
In the analysis of content frequency, specific ethnocultural matters (e.g., customs, rites, or taboos) were separately categorized as the frequency of common domains for all minority ethnic groups. For instance, Hui respondents mentioned Eid-al-Fitr, while Yi and Bai respondents mentioned the Torch festival or Dai’ Water-Splashing Festival, but the rater categorized all of them as festivals. Krippendorff’s alpha index was calculated to evaluate the intercoder reliability. Prior to item analysis, we replaced missing data, constituting less than 1% in both questionnaires, with a series mean. We adopted SPSS Version 22.0 for Windows (IBM Inc., Released 2013, Armonk, NY, United States) to operate the statistical item-analysis to delete items that had an item-total correlation coefficient of less than 0.30 and no significant difference at the p = 0.05 level between the highest and lowest 27% of the total population. Next, an ethnologist and psychology professor further evaluated those items retained in item-analysis.
Results
Table 1 shows the information of frequency greater than 15 in the content frequency analysis of responses to the semi-structured questionnaires. Matters generally important to ethnic minorities comprise ethnic festivals, ethnic uniqueness, inheritance and development of ethnic culture, ethnic knowledge, ethnic language, ethnic customs, ethnic membership, and ethnic feeling. The Krippendorff’s nominal alpha presented a high degree of reliability of 0.87 based on the content frequency statistics of the rater, conducted twice (Krippendorff, 2007). Two initial item pools were shown as simplified Chinese statements, and some items were then eliminated because they did not meet the statistical criteria of item selection and experts’ review to item content. As a result, a total of 38 items were retained for the CMEVQ and 30 for the CMEVEBQ. Content assessment by statistical item-analysis and the experts supported our conceptualization of minority ethnic values and its behavioral tendency, indicating that they could be applied to the following studies.
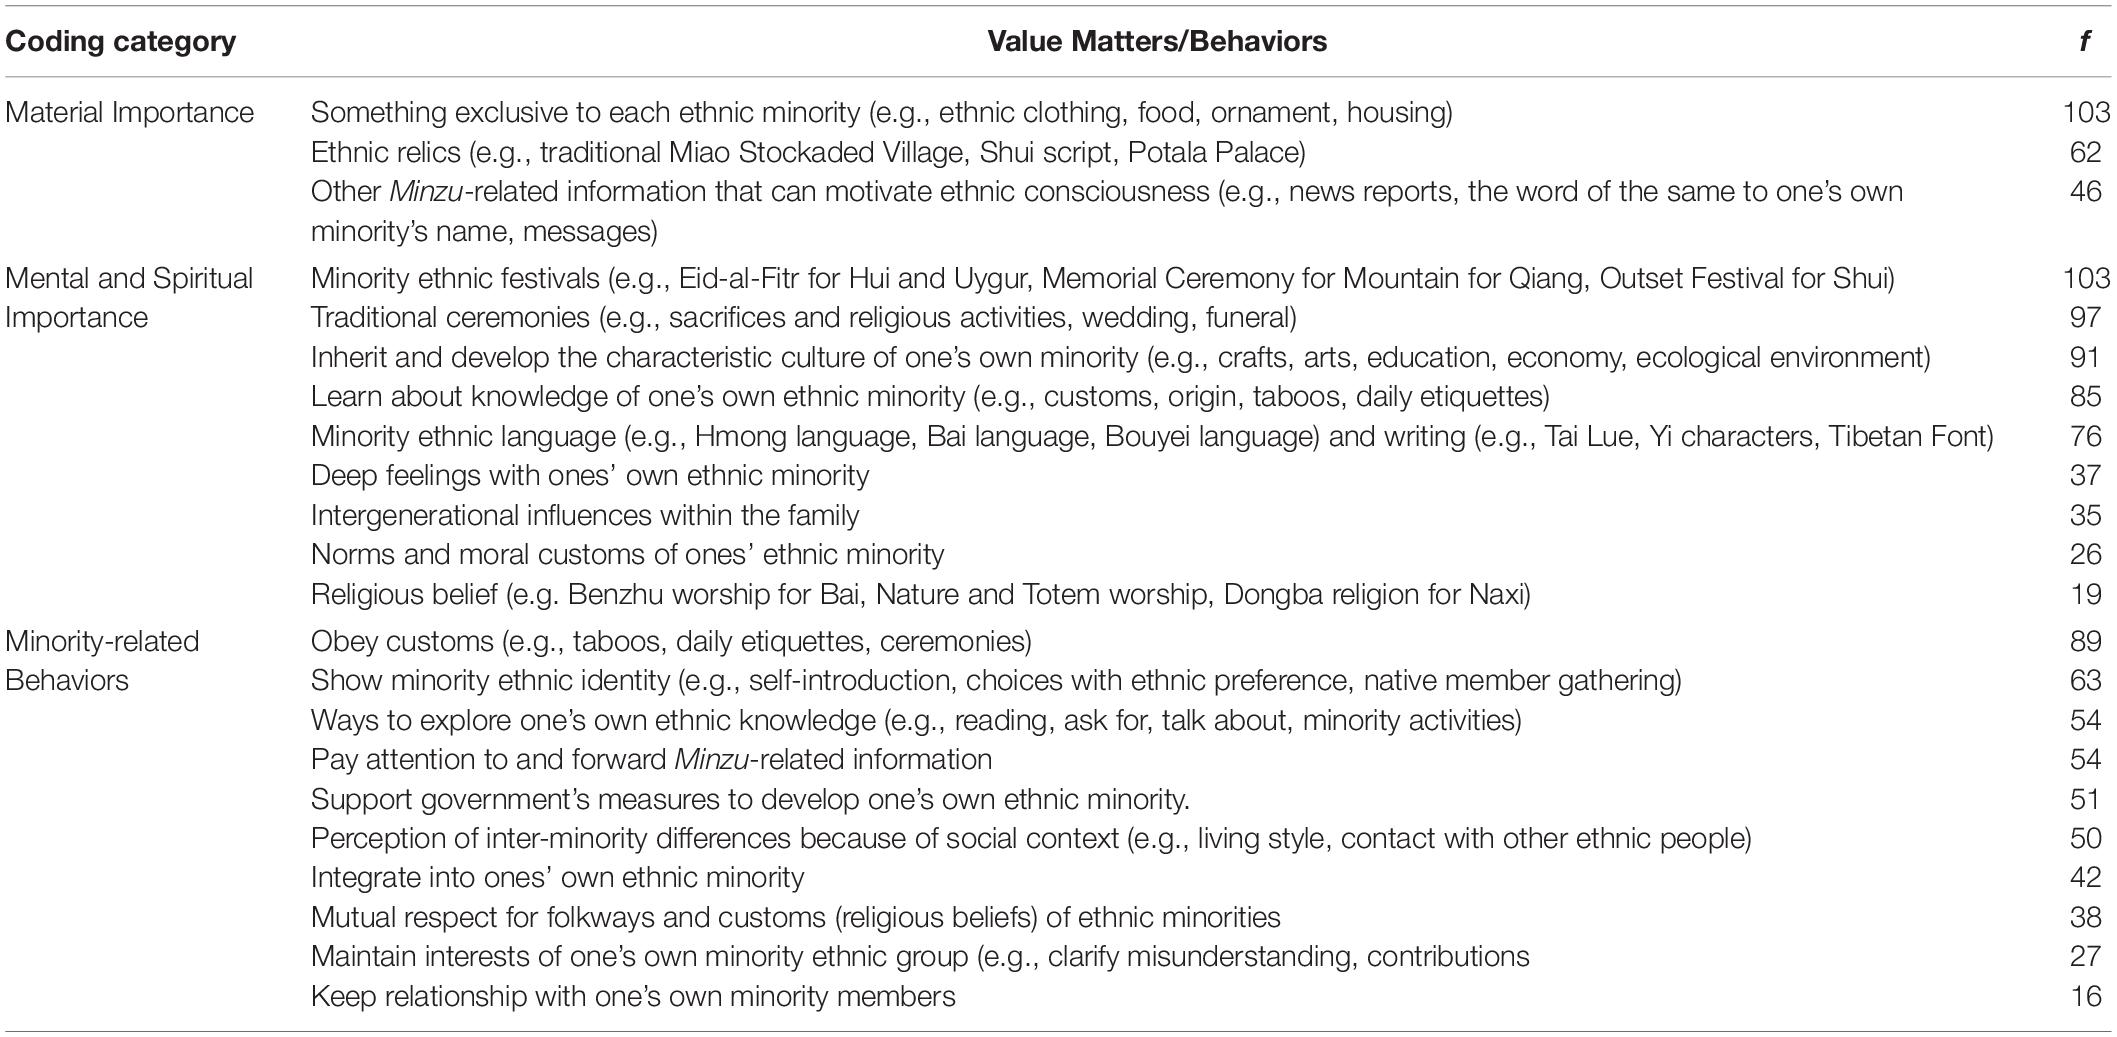
Table 1. Frequency coding of Minority Ethnic Values and Value-Expressive Behaviors.
Study 1
The aim of Study 1 was to explore the factor structure of the CMEVQ and CMEVEBQ using exploratory factor analysis (EFA), and to assess the internal reliability and construct validity of all latent factors with the structural equation model (SEM). We hypothesized that two multidimensional structures would fit the data better, indicating the need for two appropriate and parsimonious ethnic questionnaires, as well as several factors of ethnic-minority-values and value-expressive behavior.
Method
Participants
We recruited another sample of 665 minority ethnic participants, comprising 235 (35.3%) women and 430 (64.7%) men from 19 provinces/regions of China (based on IP address) and covering 28 Chinese ethnic minorities (including all minority ethnic groups of the second group in the pilot study apart from ethnic Ge and Wa). Their ages ranged from 16 to 47 years, Mage = 22.26 years (SD = 4.90). Of these participants, 435 (65.4%) were from minority-inhabited areas; 503 (75.6%) were from rural areas, 107 (16.1%) were from towns, and 55 (8.3%) were from urban areas; 563 (84.7%) were unmarried; 530 (79.7%) were non-religious; and the parents of 502 (75.5%) participants were of the same minority ethnic group. Regarding educational level, 52 (7.8%) had received primary and junior middle education, 69 (10.4%) were senior high school students, 105 (15.8%) were junior college students, 398 (59.8%) were undergraduates, and 41 (6.2%) were graduate students. Professionally, there were 514 (77.2%) students and 151 (22.8%) working people. Our sample contained a broad range of demographics, which has been rarely involved in previous research.
Procedures
Data were collected from three schools: Tongren University in Guizhou Province, Southwest Minzu University in Sichuan, and Honghe University in Yunnan. These universities are located in minority ethnic areas and therefore have larger numbers of minority-registered students. The survey was conducted with the help of university administrators who forwarded an online link consisting of standard instructions explaining our research purpose, demographic variables, and two questionnaires to the class QQ or Wechat groups with a large number and variety of ethnic minorities. The respondents were expected to individually complete the survey in the classroom within 10 min. As a monetary reward, we paid 6 Yuan RMB per survey submitted. A total of 86 invalid questionnaires were eliminated, to give an effective survey rate of 88.7%.
Data Analyses
Prior to analysis, we replaced missing data, constituting less than 1% in both questionnaires, with a series mean. We used a principal component analysis with varimax rotation (Costello and Osborne, 2005) in SPSS 22.0 and parallel analysis in Mplus version 7 to examine the factor structure of the 38-item CMEVQ and 30-item CMEVEBQ by EFA. The following criteria of the “cleanest” factor structure were adopted: fixed number of six factors; item-loading on one factor above 0.40; no cross-loaded items; and no factors with more than three items. We only retained the three items with the highest factor loading for factors with more than three items (Hair et al., 2009). The SEM with maximum likelihood was performed to individually validate the possible psychometric models of the two questionnaires by IBM SPSS Amos version 22.0.
Results
Factor Structure of the CMEVQ and CEMVEBQ
The results of the Kaiser-Meyer-Olkin (KMO) and Bartlett’s test of sphericity were KMOCMEVQ = 0.948, χ2(435) = 8416.67 and KMOCMEVEBQ = 0.932, χ2(435) = 5216.32, ps < 0.001, which supported the factorial analysis. After the principal component analysis of each questionnaire, visual analysis of two scree plots individually suggested six “jumps” down to the scree line. Table 2 contains the first eight Eigenvalues of total variance of the retained CMEVQ and CMEVEBQ items. We conducted parallel analysis to extract the number of factors of the two scales, and the results separately suggested five and four factors for CMEVQ and CMEVEBQ, respectively. Thus, we conducted another principal component analysis of the two questionnaires; the items that did not meet the above item-selection criteria were gradually eliminated, specifying the number of factors as six. A value item stating “It is important to him/her to have more educational opportunities for children of their own minority” loaded 0.43 and 0.59 onto two factors, and we retained this item to the latter factor to ensure it has at least three items. Finally, a total of 18 items of the CMEVQ and CMEVEBQ with six-factor structures were generated, individually accounting for 66.79 and 63.67% of the total variance in the item correlation matrix. The factor loadings of the two questionnaires are displayed in Tables 3, 4, respectively. The Cronbach’s alpha coefficients for each factor with only three items suggested that the CMEVQ and CMEVEBQ are robust, except for the MEM factor. Reliability coefficients of the total scores were 0.759 for CMEVQ and 0.767 for CMEVEBQ. The fit indices of the value and behavior models are shown in line 1 of the two panels of Table 5, demonstrating that both CMEVQ and CMEVEBQ had reasonable construct validity with six first-order factors.
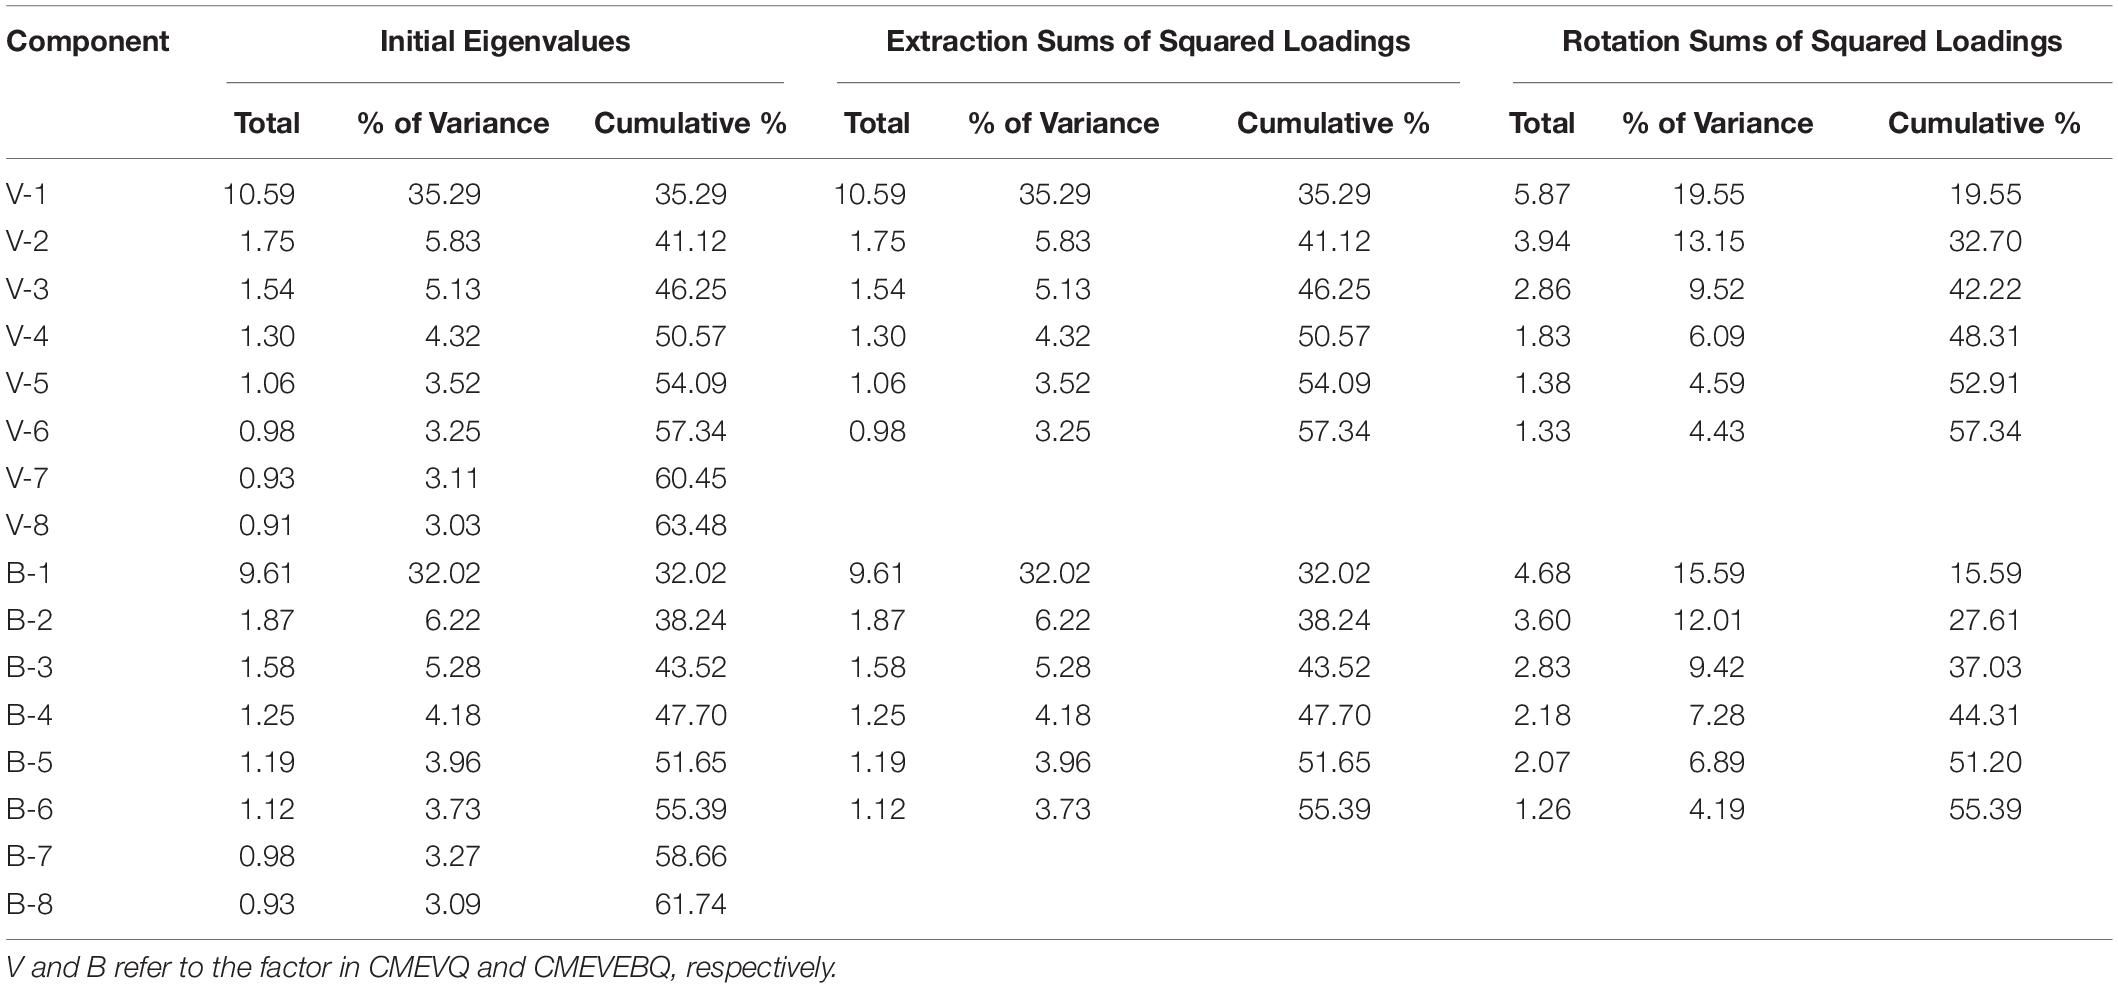
Table 2. Total variance explained for CMEVQ and CMEVEBQ.
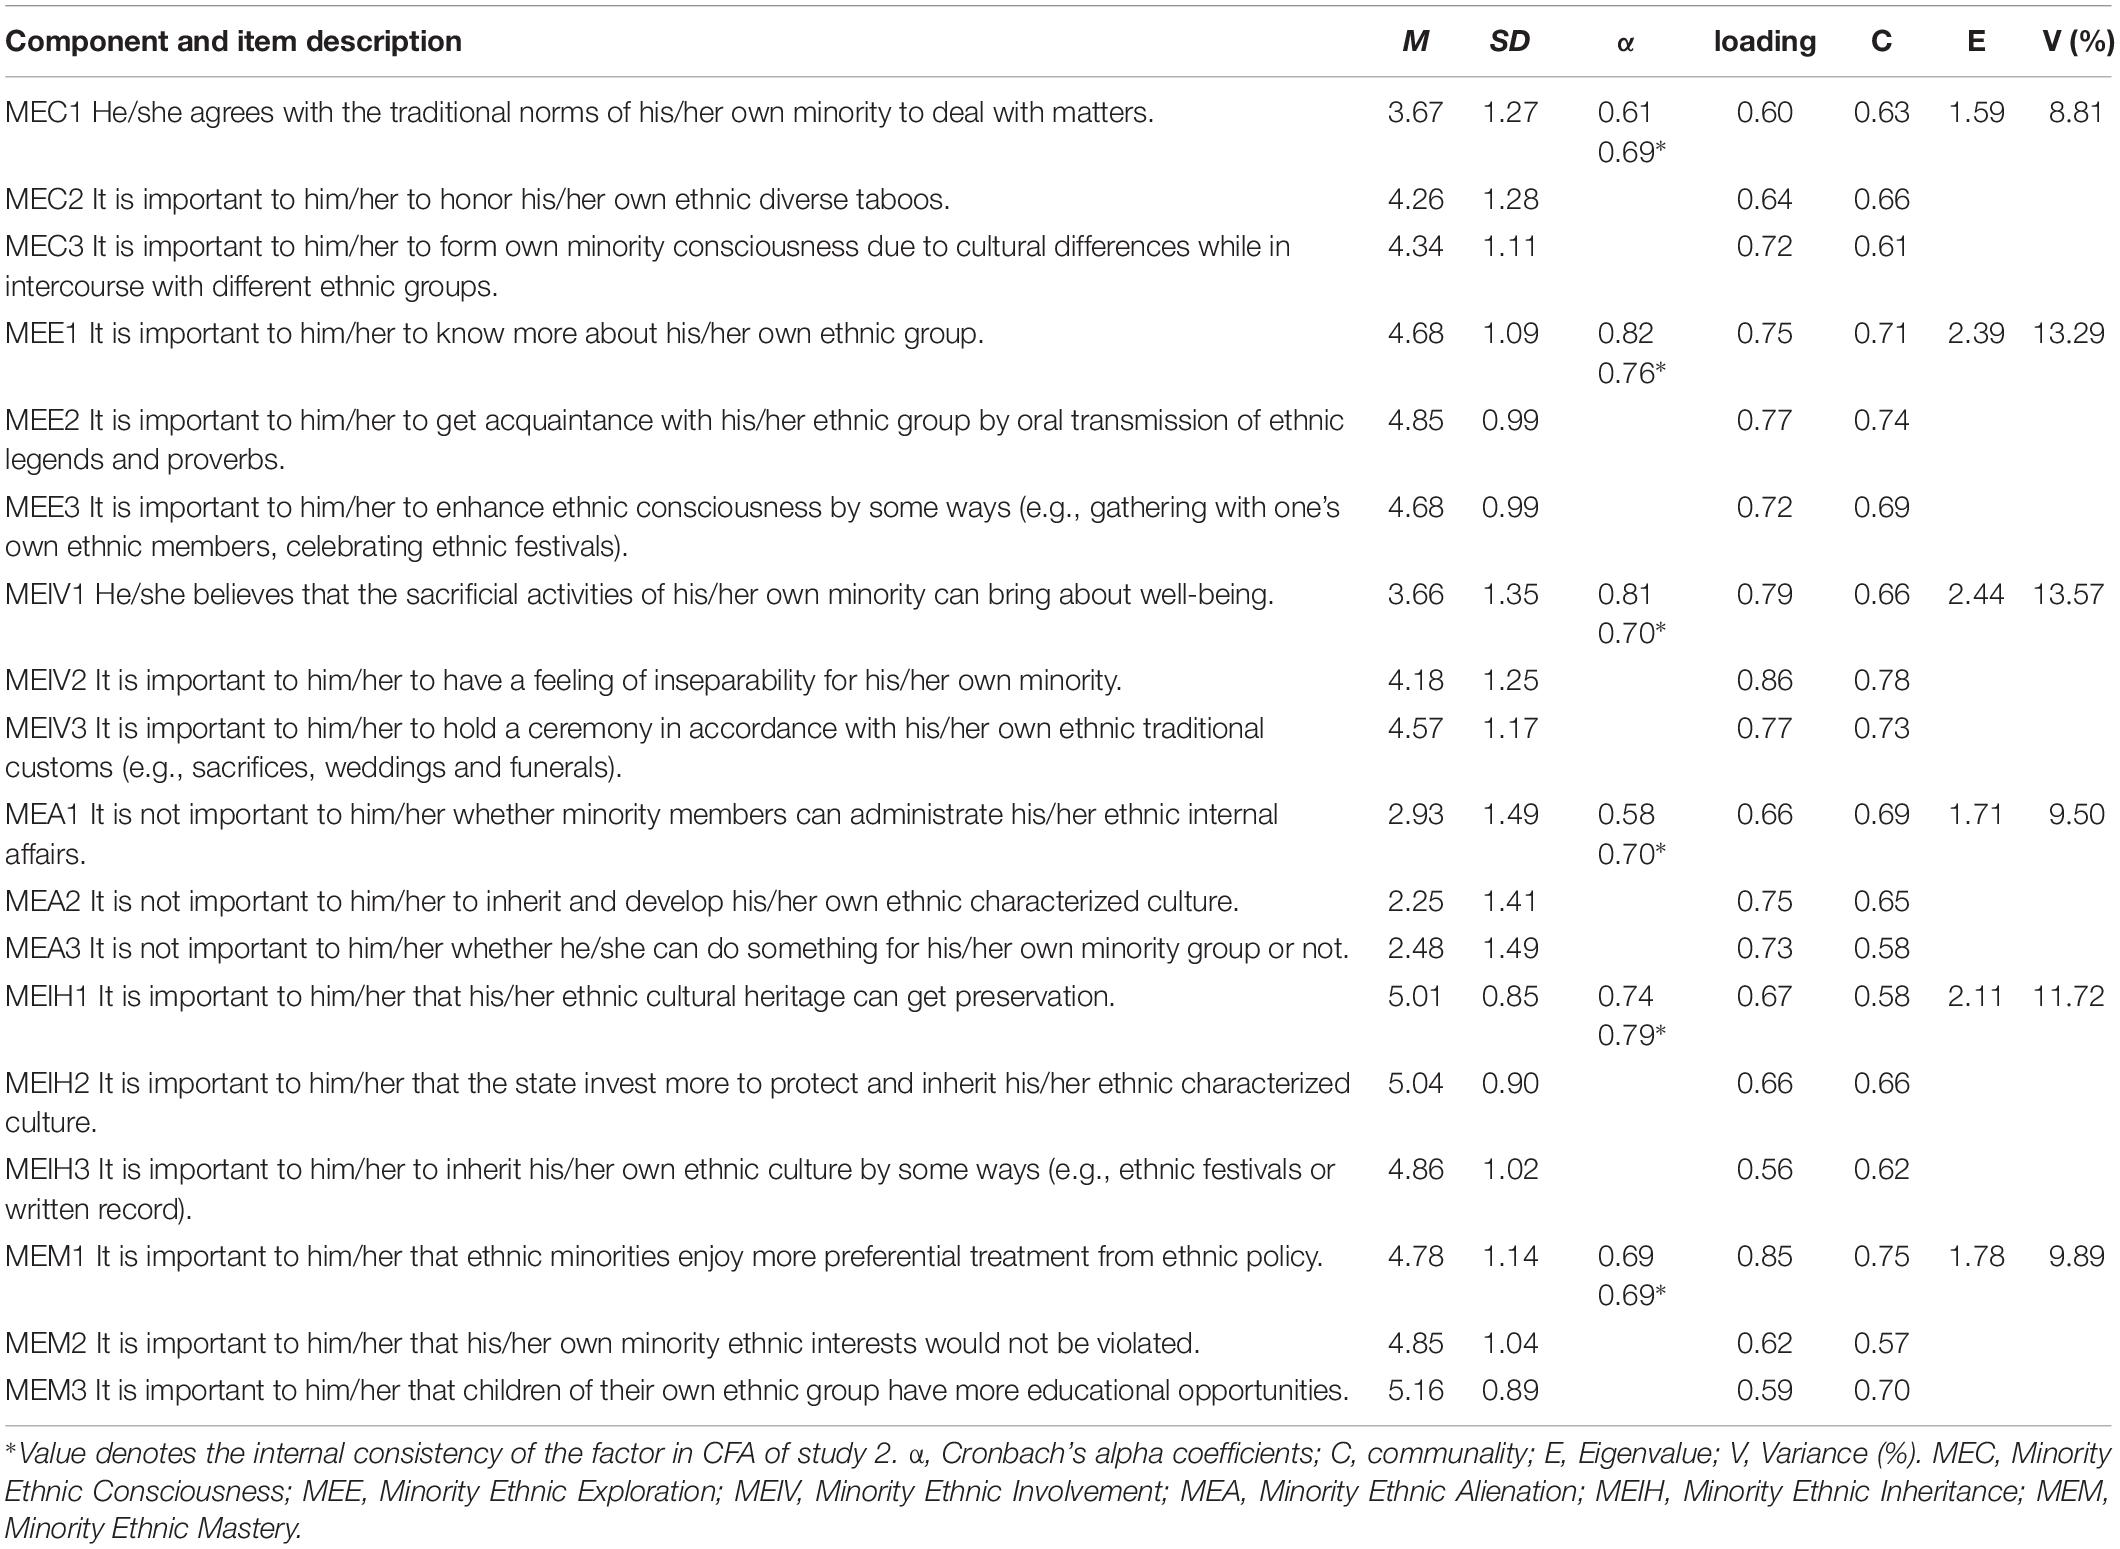
Table 3. First-order factor structure of the Chinese Minority Ethnic Value Questionnaire.
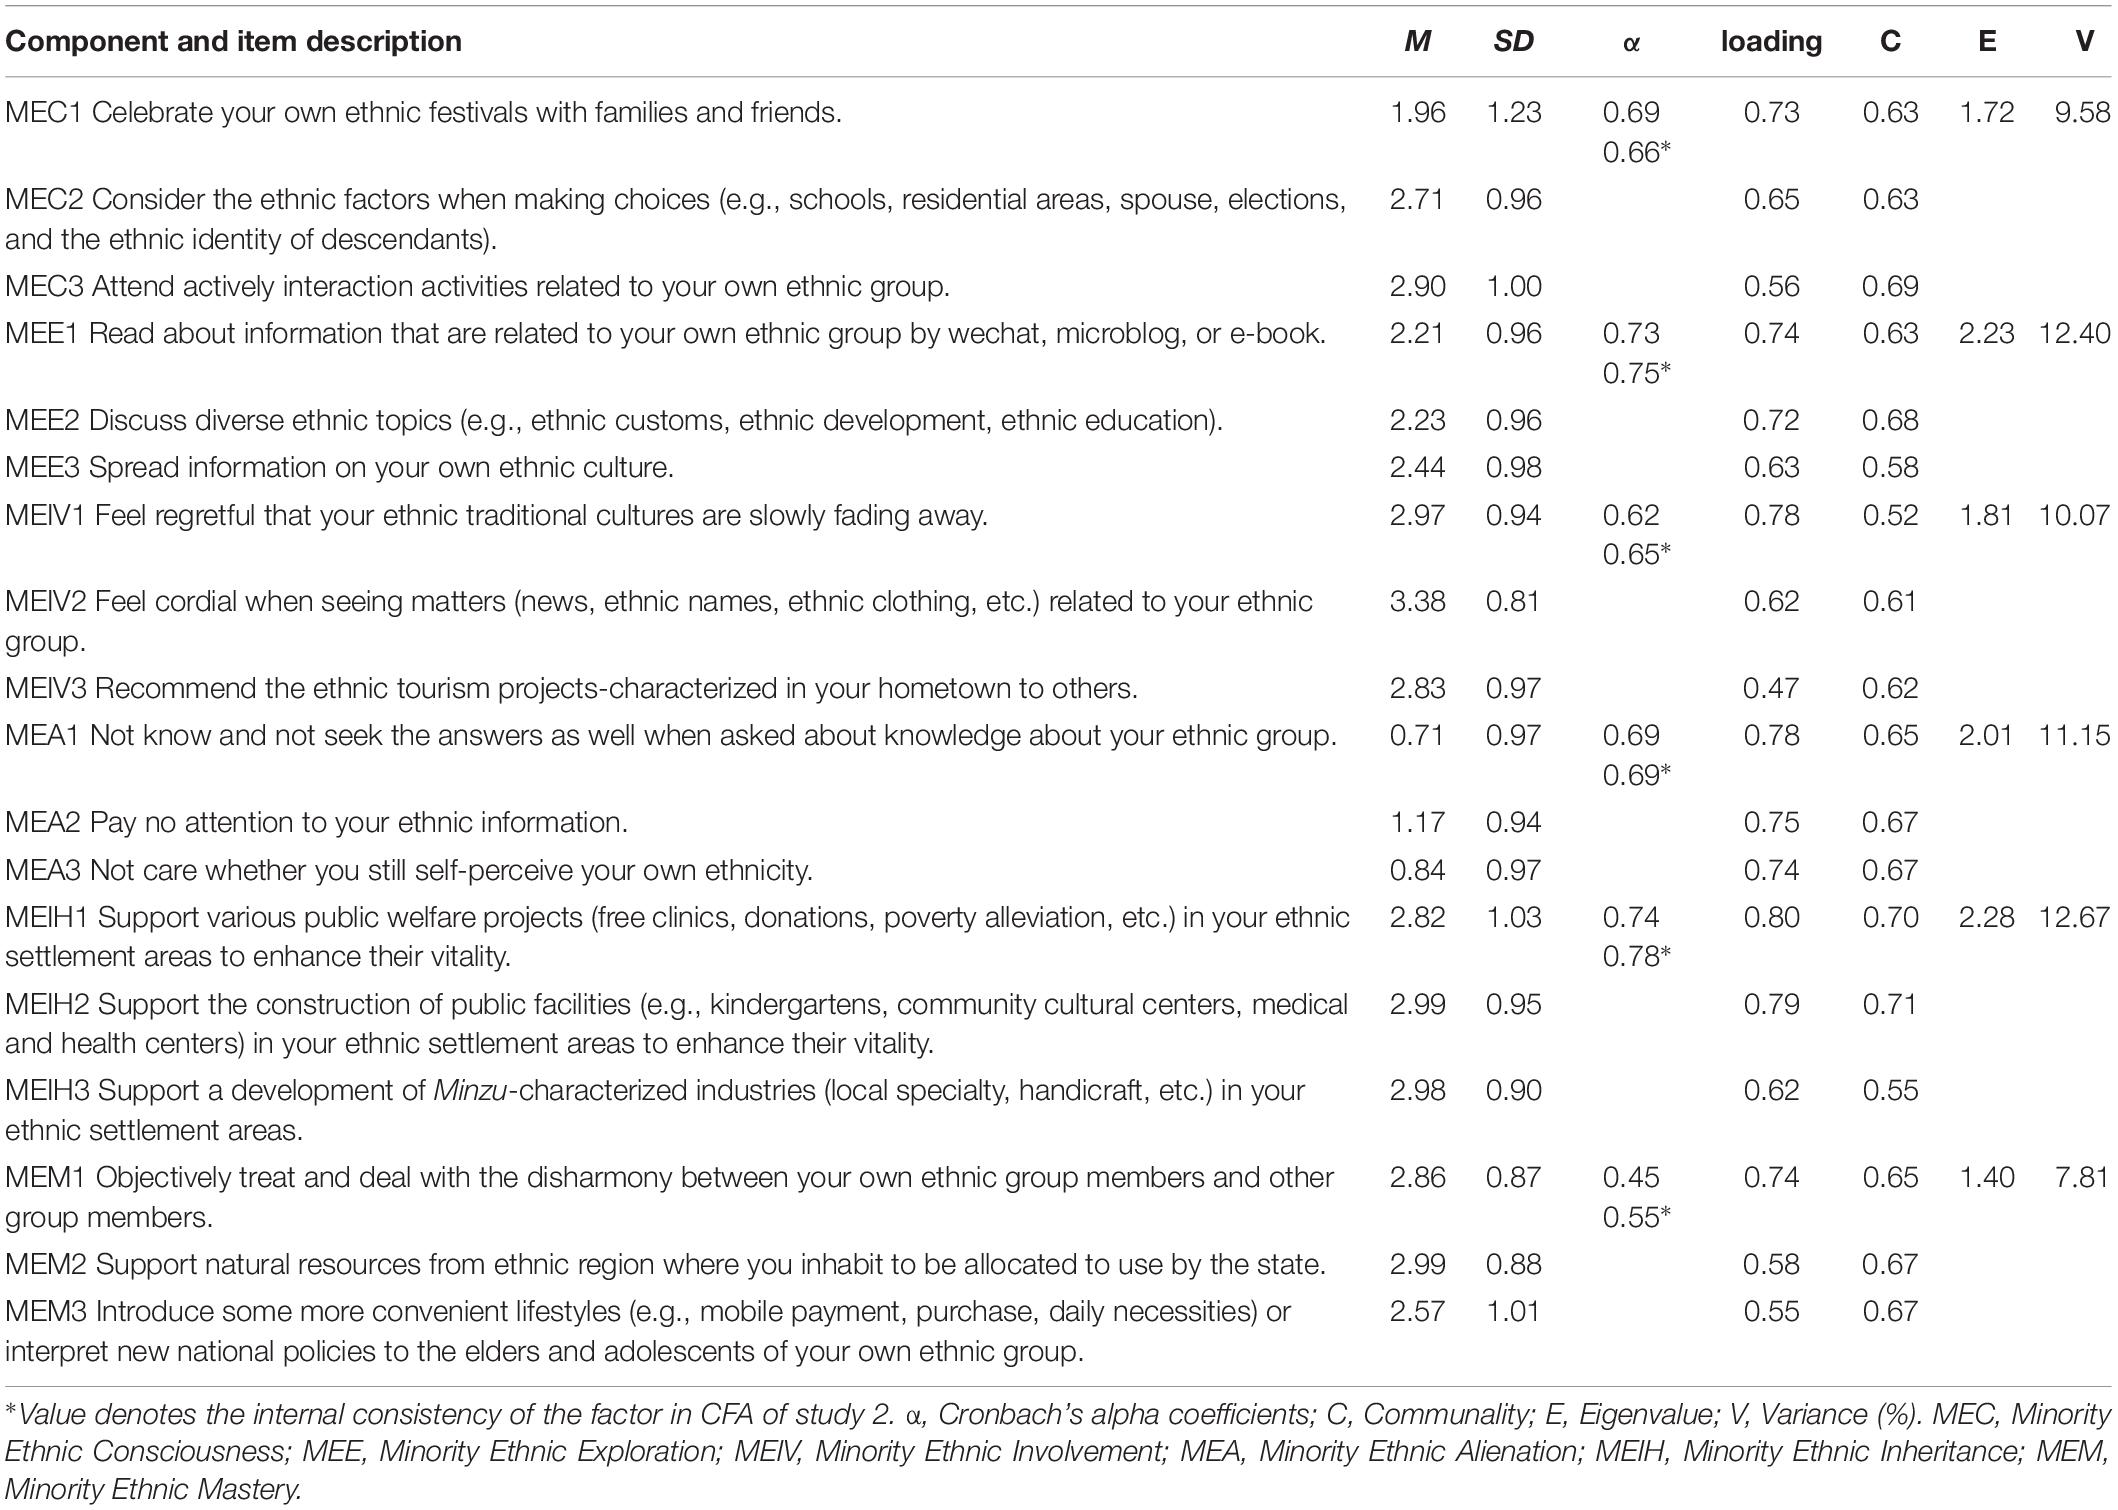
Table 4. First-order factor structure of the Chinese Minority Ethnic Value-expressive Behavior Questionnaire.
Following an inspection of the item contents of each facet, combined with Verkuyten’s four “ways of ethnicity” and other authors’ specific content descriptions of those ways, we defined the meaning of each postulated facet. MEC refers to minority ethnic self-awareness of own ethnic affiliation and of matters related to own ethnic group. MEE refers to the process of minority ethnic members seeking or being exposed to own ethnic group related knowledge. MEIV refers to the degree of ethnic minorities’ emotional cognition of own ethnic groups and ethnic affiliation. MEIH refers to the important aspects that can secure the longevity of a minority ethnic group. MEM refers to the relationship between an ethnic minority and society and nature. As a facet of the cognitive unimportance of ethnicity in the values and behavior questionnaire, MEA refers to the degree minority ethnic members’ self-perceived alienation from their own ethnic group and was assumed to be opposite to the other five facets from the standpoint of ethnicity.
The composite reliability was computed to test the internal consistency or suitability of each latent variable. In the CMEVQ and CMEVEBQ, MEC = 0.61 and 0.72, MEE = 0.82 and 0.74, MEIV = 0.82 and 0.69, MEA = 0.59 and 0.69, MEIH = 0.74 and 0.77, and MEM = 0.71 and 0.59. Most values exceeded the critical level of 0.60 and were above 0.70, while only two values approached 0.60, demonstrating reasonable internal fit indices for all latent factors (Bagozzi and Yi, 1988).
Measurement Invariance of Ethnic-Minority-Values and Value-Expressive Behaviors
In view of Verkuyter’s four “ways of ethnicity,” we also explored separate four-factor models for CMEVQ and CMEVEBQ, and we obtained the same items as with the six-factor model. Then we conducted an SEM, and the results of fit indices are presented in line 3 of the two panels of Table 5. By comparison, the fit indices of the two four-factor models were poorer than that of the six-factor models, but most were acceptable.
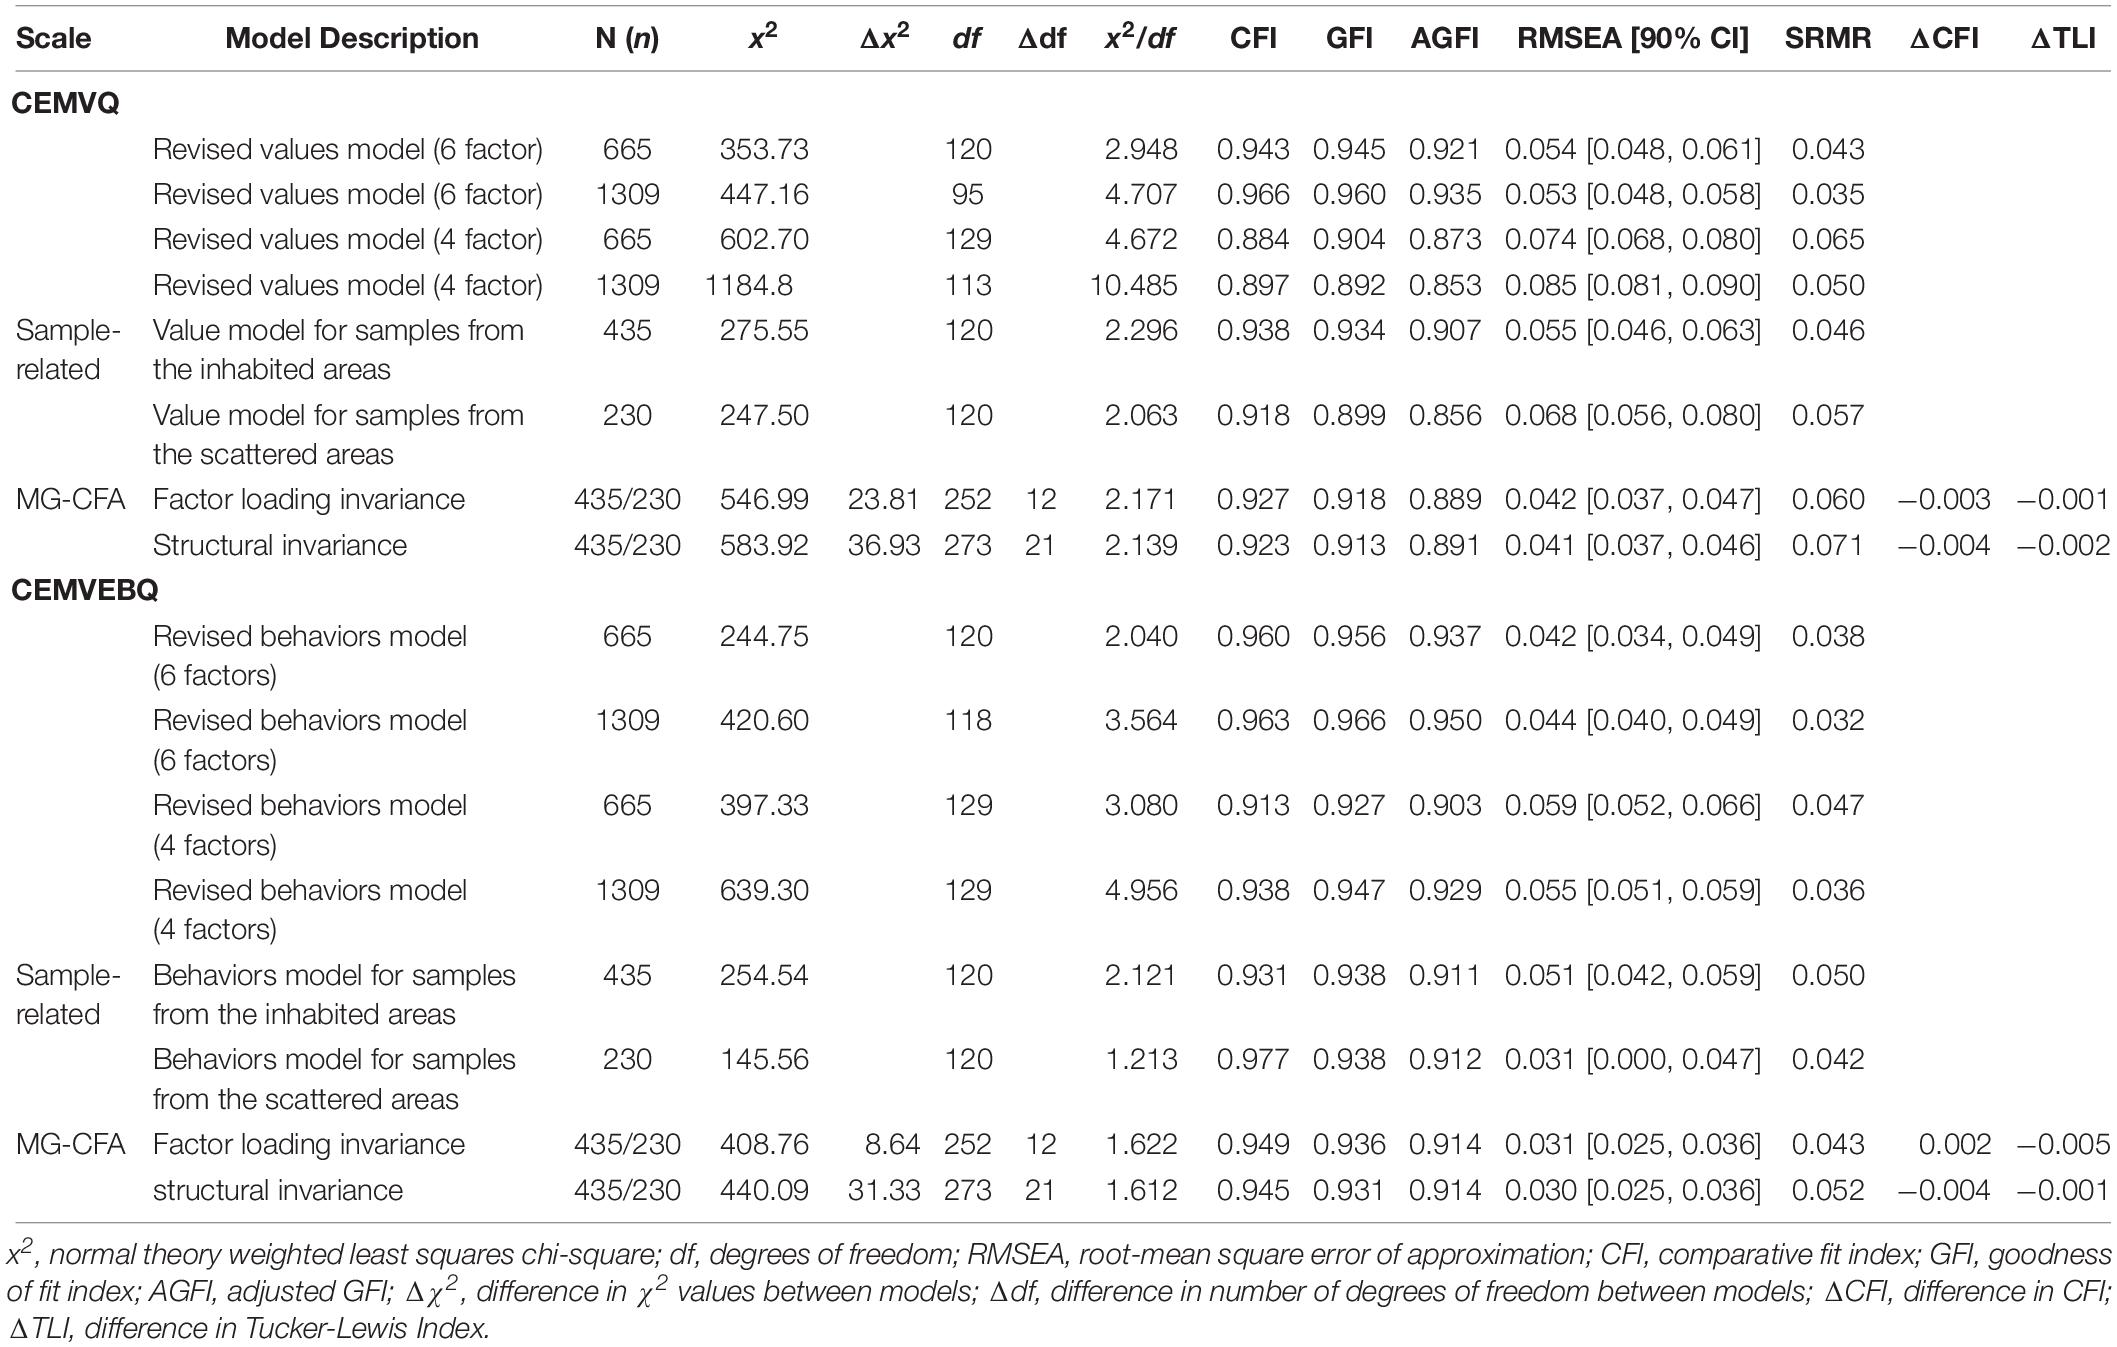
Table 5. Goodness-of-fit statistics for the confirmatory factor analysis of CMEVQ and CEMVEBQ: A summary.
Furthermore, a multiple-group comparison was conducted between the minority groups from the minority-inhabited areas and minority-scattered areas to test measurement invariance of the internal structure of ethnic-minority-values and behaviors models by the multiple-group confirmatory factor analysis (MG-CFA). Lines 2 and 3, in the top and bottom panels of Table 5 respectively, presented the fit indexes of sample models across settlement areas. The final two lines of the two panels respectively presented Goodness-of-fit results of invariant factor loadings and structural invariance. Although the χ2 from both the factor-loading and configural model of values were statistically significant [Δχ2(12) = 23.808, p = 0.022; Δχ2(21) = 36.927, p = 0.017], the differences between the CFI values met the recommended cutoff criterion of 0.01 (ΔCFI = −0.003 and −0.004; Cheung and Rensvold, 2002), and the differences between Tucker-Lewis Index (TLI) values also met the critical level of 0.5 (ΔTLI = −0.001 and −0.002; Little, 1997).
Discussion
These results provided preliminary support for our view that ethnic-minority-values could be conceptualized and represented by ways of ethnicity. As expected, both initial questionnaire data indicated the multidimensional constructs that represented six correlated first-order specific factors. Although values are generally considered to comprise what is important to people in life, there appear to be distinct manifestations of ethnicity-related views and behaviors. The test results of measurement invariance provided evidences of two better-fitting models of the CMEVQ and CMEVEBQ; combining the conceptual contents of ethnic-minority-value and value-expressive behavior, both six-factor models were appropriate and parsimonious for use in Study 2. As for the lower internal consistency of the MEM value subscale, this may be related to small items or its poor domain representation, and requires further verification.
Study 2
Study 2 aimed to check the internal consistency reliability of the newly developed CMEVQ and CMEVEBQ for Chinese multiethnic minorities, as well as to validate their construct, criterion-related, discriminant, and ecological validity. It was hypothesized that the CMEVQ and CMEVEBQ would demonstrate adequate psychometric properties and be useful in expressing ethnicity from the minority ethnic “inside.” Furthermore, much of the evidence on value-behavior associations has provided reason to believe that values have at least some causal influence on behavior. In particular, studies that value manipulations affect subsequent behaviors in value-consistent directions (e.g., Verplanken and Holland, 2002; Maio, 2015). This study did not assess causality, but did statistically test the relationship between ethnic values and their postulated behaviors. We expected that ethnic behaviors would be more strongly correlated with their related ethnic values than with other values.
Method
Participants
In the final analyses, there were 1309 surveys covering 39 Chinese ethnic minorities (Lisu, Pumi, Blang, Dongxiang, Jingpo, Salar, She, Wa, Achang, Daur, Maonan, Nu, Tatar, and the 26 minorities of the second group in the pilot study) ranging in age from 15 to 26 years, Mage = 20.69 year (SD = 2.14). In the sample, 788 (60.2%) were women and 521 (39.8%) were men, 809 (61.8%) were from minority-inhabited areas, and 974 (74.4%) were non-religious. Regarding respondents’ homeplace, 548 (41.9%) were from rural areas, 383 (29.3%) were from towns, and 378 (28.9) were from urban areas. The parents of 61.5% (n = 805) of participants were of the same minority ethnic group, while those of 504 (38.5%) were of two ethnic groups, of which 468 were descendants of an ethnic minority and ethnic Han.
Design
Participants responded to a series of scales online: the CMEVQ and CMEVEBQ scales developed in Study 1; the Inclusion of Ingroup in the Self (IIS; Tropp and Wright, 2001); the Chinese Multiethnic Adolescent Cultural Identity Questionnaire (CMACIQ; Hu et al., 2014); the Ethnic Self-Categorization (ESC; Verkuyten and De Wolf, 2002); the Collective Self-Esteem Scale (CSE); and demographic questions.
Measures
The IIS consisted of seven Venn-like diagrams, with pairs of circles varying in their degree of overlap. As a single-item measure, the IIS proved to be a valid and reliable measure to assess ingroup identification. We used it to quickly measure the level of identification for ethnic minority members to their own minority ingroup. It was also particularly suitable for multi-minority ethnic group memberships. The word “group” here was labeled as “Your own ethnic group.”
The CMACIQ consisted of two higher-order factors, six first-order factors, and 34 items, and was rated on a 5-point scale ranging from 1 (strongly disagree) to 5 (strongly agree). We only used three of the first-order factors, Preference for Ethnic Things (e.g., “Prefer to eat your own ethnic traditional foods”), Ethnic Acceptance (e.g., “My ethnic group is honest and trustworthy”), and Social Norms (e.g., “Loyalty and filial piety are the Chinese nation’s fundamental values”). The Spearman-Brown split-half and test-retest correlations exceeded 0.70 over a 2-week interval. The internal reliability of the three facets used in this study were 0.83, 0.81, and 0.84, respectively.
The ESC had three items. In view of the sample’s identity in this study, the word “Chinese” in the original items was replaced and the revised contents read “I see myself as a typical member of my minority,” “I am very similar to other members of my minority in how I feel about things,” and “I think the same as other members of my minority about important things in life.” Responses were provided on a 5-point scale ranging from 1 (complete disagreement) to 7 (complete agreement). The internal reliability was high in this study, at 0.82.
The CSE was designed to assess the positivity of one’s social or collective identity. It included four subscales and 16 items on a 7-point scale ranging from 1 (strongly disagree) to 7 (strongly agree). Verkuyten and De Wolf (2002) use four items of the CSE’s private subscale to measure ethnic self-esteem (ESE). We adopted three subscales: Membership Esteem (four items, e.g., “I am a worthy member of the social groups I belong to”), in which the item “I am a cooperative participant in the social groups I belong to” was not included in our study due to inappropriate content, Private Collective Self-Esteem (four items, e.g., “I feel good about the social groups I belong to”), and Importance to Identity (four items, e.g., “The social groups I belong to are an important reflection of who I am”). In this study, the original term, “social group” referred to “minority ethnic group,” so we replaced this term with “minority ethnic group” (e.g., “I feel good about the minority ethnic group I belong to”). Reliability analyses revealed substantial alphas of their subscales ranging from 0.73 to 0.80. The three subscale alphas in this study were 0.62 (three items used), 0.70, and 0.75, respectively.
Procedures
To explore the characteristics of ethnic-minority-value and value-expressive behavior in multiethnic contexts, we mainly sampled indigenous ethnic minorities from ethnic communities in Southwest China, the region with the highest minority ethnic population, the most complex ethnic composition, and the richest and most diverse ethnic culture, mainly in Yunnan, Guizhou, Sichuan, and Chongqing. Specifically, according to the Chinese sixth population census data (Chinese National Bureau of Statistics, 2010), there are 25 minority ethnic groups who have lived for generations in Yunnan Province alone, accounting for 13.71% of the total minority ethnic population in the country. To ensure minority ethnic diversity, several Minzu schools, mainly colleges and universities, in Southwest China, were determined as the sampling units. The survey was conducted with the help of school administrators who forwarded our online survey to classes with a more balanced gender ratio of minority ethnic students. It took participants approximately 20 min to complete the set of scales and demographic questions, and they were allowed to pause the surveys and return them within 3 days. We paid 10 Yuan RMB for each completed survey. A total of 1398 surveys were completed, and the effective survey rate was 93.6%.
Results and Discussion
Reliability of the CMEVQ and CMEVEBQ
We dealt with the reverse scoring items in the CSE, and computed the mean scores for each of the subscales of all questionnaires, except for the IIS. As shown in Tables 3, 4, the internal reliability of each subscale with three items in the CMEVQ and CMEVEBQ was acceptable. Reliability coefficients of the total scores were 0.814 for CMEVQ and 0.805 for CMEVEBQ. Despite the internal consistency of several factors being somewhat below the desired level, they were acceptable for subscales with fewer than five items apiece (Nunnally and Bernstein, 1994).
Validity of the CMEVQ and CMEVEBQ
Structure validity
We rechecked the goodness of fit of the two models in Study 1. Prior to analysis, we replaced the missing data, constituting less than 1% in the CMEVEBQ, with Bayesian interpolation (Meng, 1994). The indexes were used to evaluate the goodness of fit as follows: χ2/df ratios (i.e., lower than 3; Kline, 2015), the root mean square error of approximation (RMSEA) values (i.e., lower than 0.06; Thompson, 2004), the comparative fit index (CFI), the goodness of fit index (GFI) and adjusted-goodness-of-fit index (AGI; i.e., higher than 0.90; Bentler, 1990), and the standardized root mean square residual (SRMR) values (i.e., lower than 0.06; Hu and Bentler, 1999). Our results for the CMEVQ and CMEVEBQ are shown in line 2 of the two panels of Table 5. All indices were better except for the Norm Chi-square for the CMEVQ, which was higher than desired but still acceptable at a critical level of 5 (Lomax and Schumacker, 2004).
The fit indexes of the four-factor model for the CMEVQ and CMEVEBQ are presented in line 4 of the two panels of Table 5. Some indexes were lower than those of the six-factor model, but most were acceptable. This suggested that the four-factor models of the two newly developed questionnaires were also applicable in practice. The specific items for each factor are included in the section “Implications of Using the CMEVQ and CMEVEBQ,” for use in future studies.
Criterion-related validity
We conducted Pearson correlations between the existing ethnic variables with equivalent or overlapping conceptual content and 12 new variables to examine the criterion validity. As shown in Table 6, each subscale of the CMEVQ and CMEVEBQ was significantly positively related to all of the criterion variables, except for two MEA subscales, which were negatively related to them. The inter-factor correlations in the CMEVQ ranged from 0.35 to 0.74 and the average correlation was 0.56, which was significantly higher than the average correlation of the five ethnic value factors with the IIS of 0.27, Social Norm of 0.21, Preference for Ethnic Things of 0.41, Ethnic Acceptance of 0.37, ESC of 0.38, Membership Esteem of 0.31, Private Collective Self-Esteem of 0.35, and Importance to Identity of 0.40, χ2(8) = 290.93, p < 0.001, ρ = 0.350 (Edwards, 1984). The inter-factor correlations in the CMEVEBQ ranged from 0.20 to 0.69 with an average correlation of 0.48, which was also significantly higher than the average correlation of five ethnic behavior factors with the criterion variables described above by 0.27, 0.20, 0.41, 0.32, 0.34, 0.31, 0.30, and 0.38, respectively, χ2(8) = 204.9, p < 0.001, ρ = 0.305. This indicated that the subscales of the two minority ethnic questionnaires have observable convergent and discriminant validity. Furthermore, the factor Preference for Ethnic Things presented a stronger correlation with more subscales in the CMEVQ and CMEVEBQ.
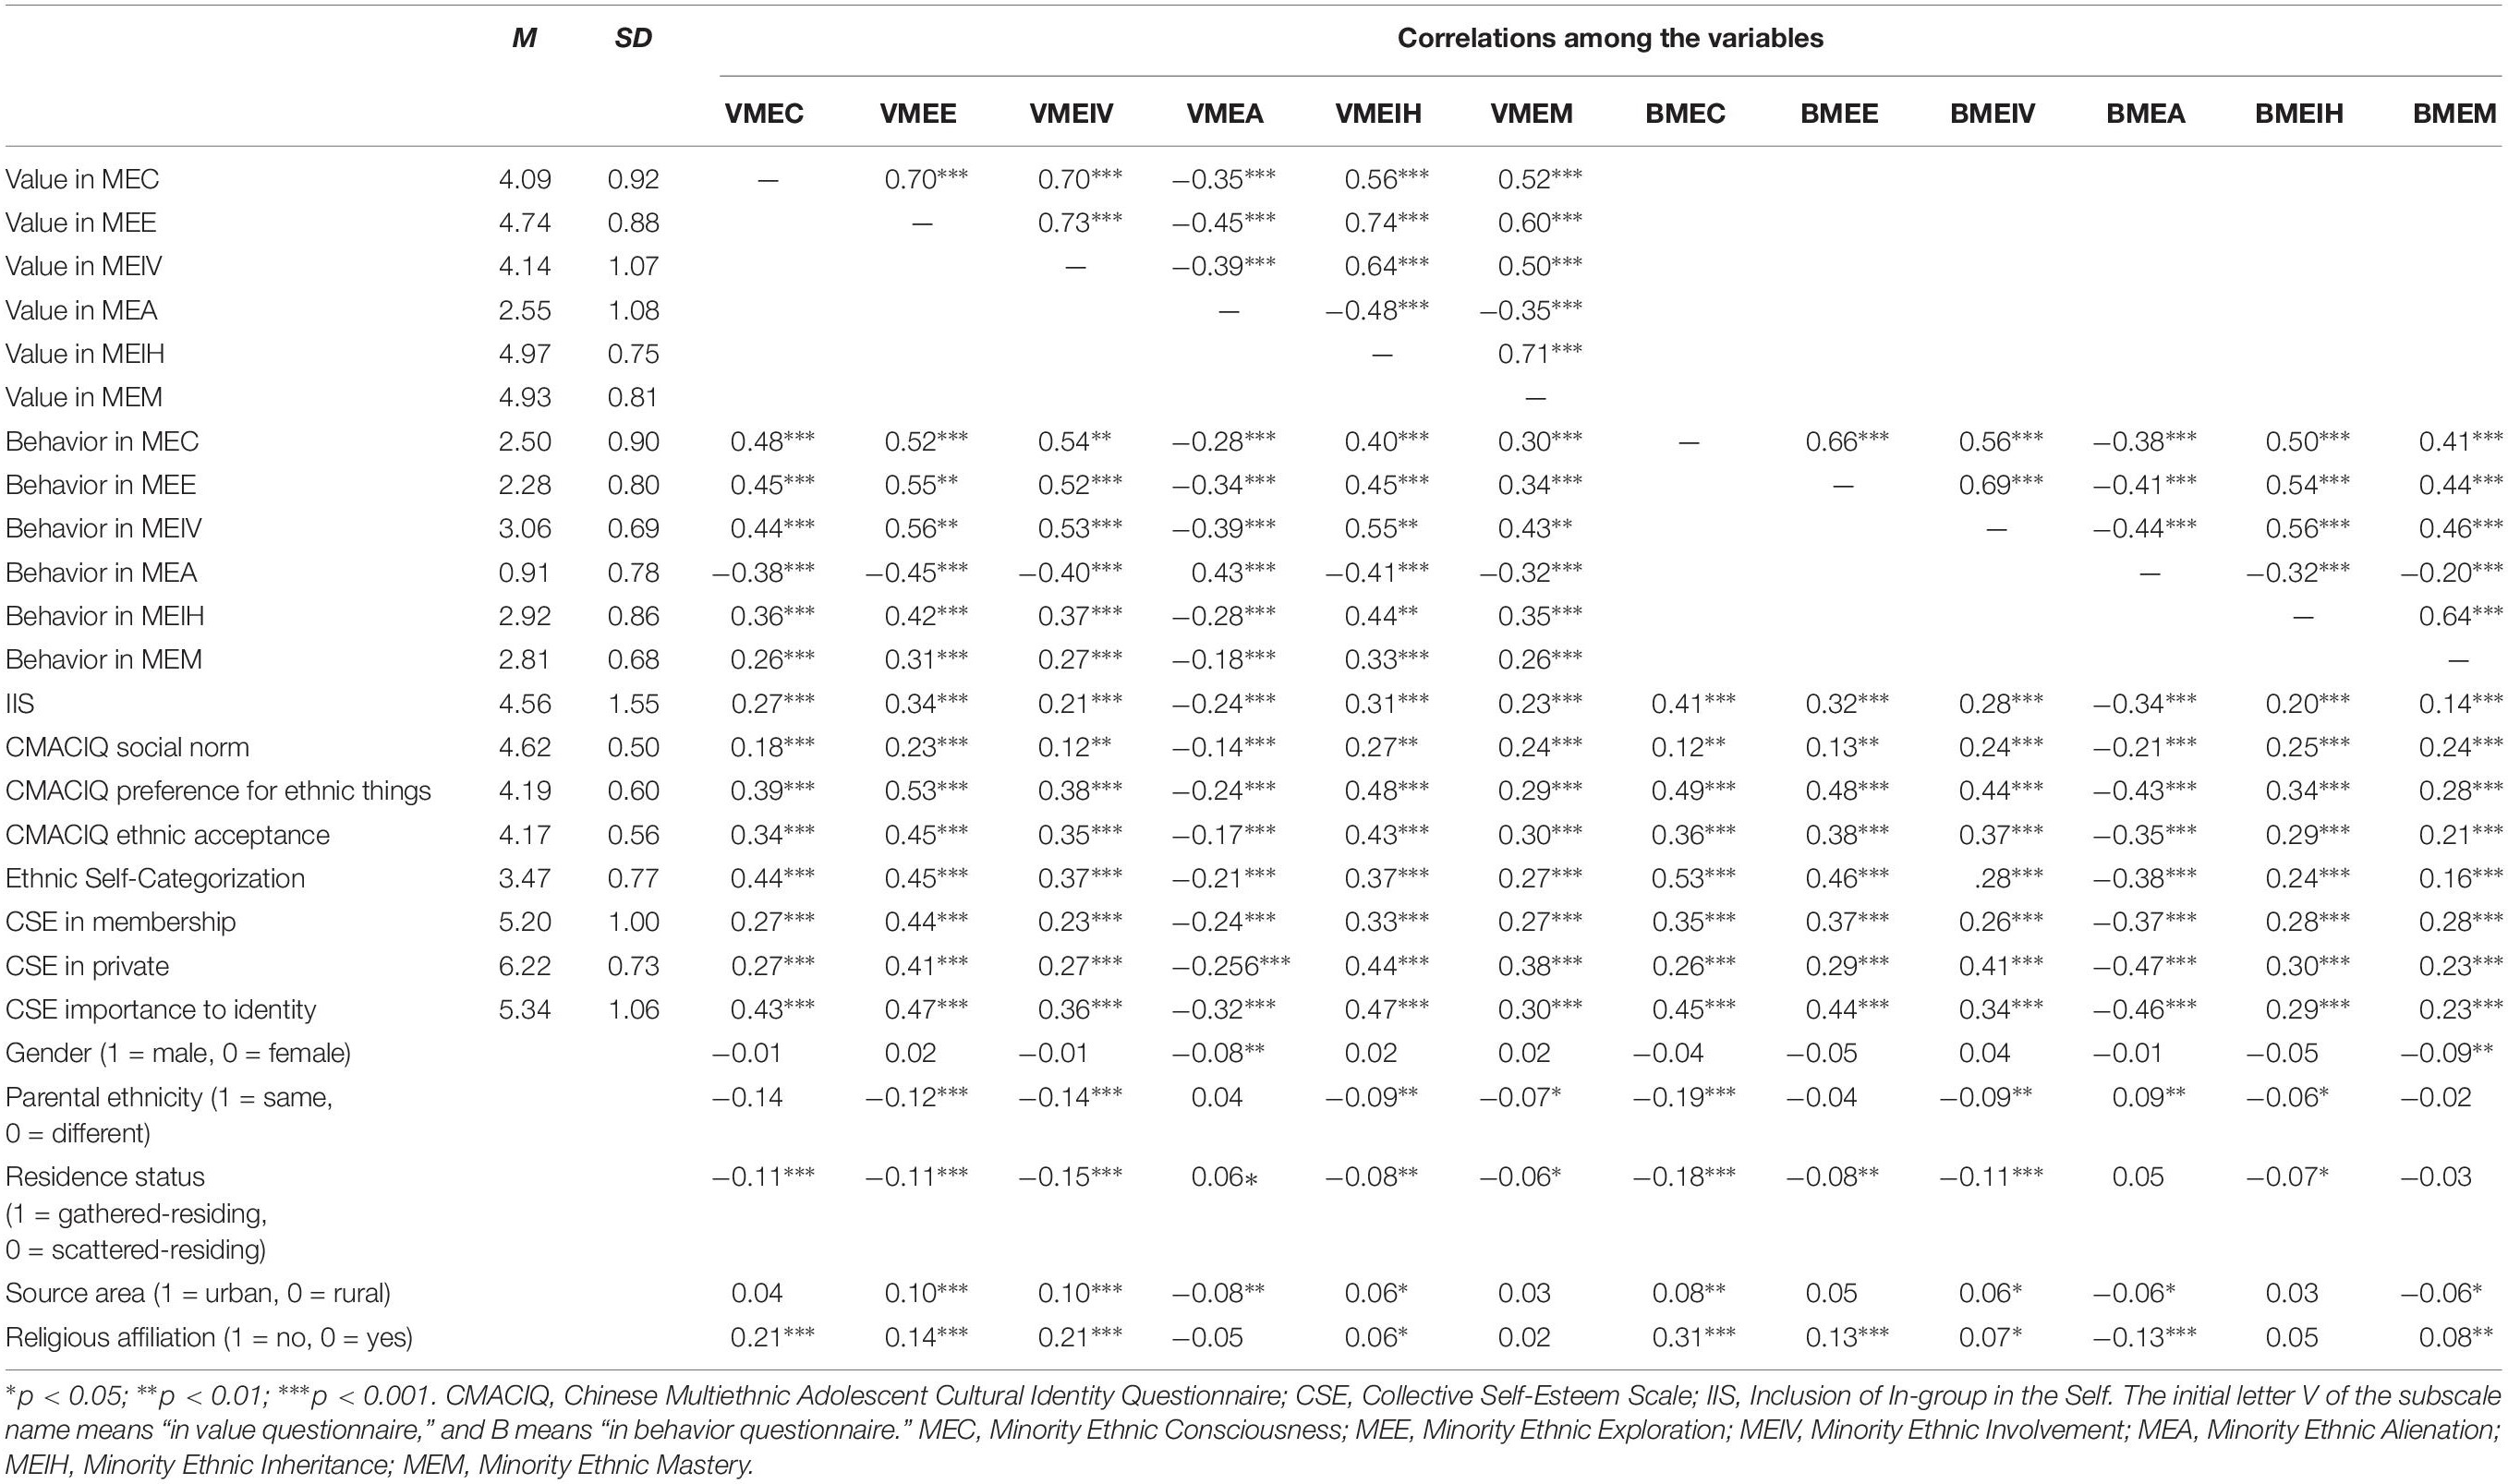
Table 6. Means and standard deviations of the subscales, and Pearson correlations among the scales in Study 2.
Discriminant validity
We further examined the discriminant validity of the two questionnaires with a K-means cluster analysis, using IIS rating as a clustering variable. The participants were divided into three clusters according to the distances between the final cluster centers of 1.78 and 2.26. We conducted an independent sample t-test between the alienation group (n = 190) and closeness group (n = 638), and the former (Ms = 1.51−4.49, SDs = 0.80−1.16) scored significantly lower on five dimensions of the values and behavior scales (all except MEA) than the latter group (Ms = 2.35 − 5.02, SDs = 0.70 −0.99), ts = 6.29 − 15.16, p < 0.001; however, the alienation group scored significantly higher on the MEA dimension (Mv–mea = 2.92 and Mb–mea = 1.55, SDv–mea = 1.04 and SDb–mea = 0.92) than the closeness group (Mv–mea = 2.31 and Mb–mea = 0.92, SDv–mea = 0.99 and SDb–mea = 0.74), ts = 7.43 and 9.62, p < 0.001. This indicated that there was a good discriminant validity in the CMEVQ and CMEVEBQ.
Ecological validity
The results suggest that stronger ethnicity may exist in minority ethnic participants whose parents were of the same minority ethnic group, who were from minority-inhabited areas, or who were born in rural areas (e.g., Deng and Zhang, 2014; Ji and Li, 2016), while ethnicity may differ by gender and religious affiliation (Tu, 2010). Based on the significant correlations between demographic variables and subscales in the CMEVQ and CMEVEBQ (see Table 6), we examined differences using the independent sample t-test (see Table 7).
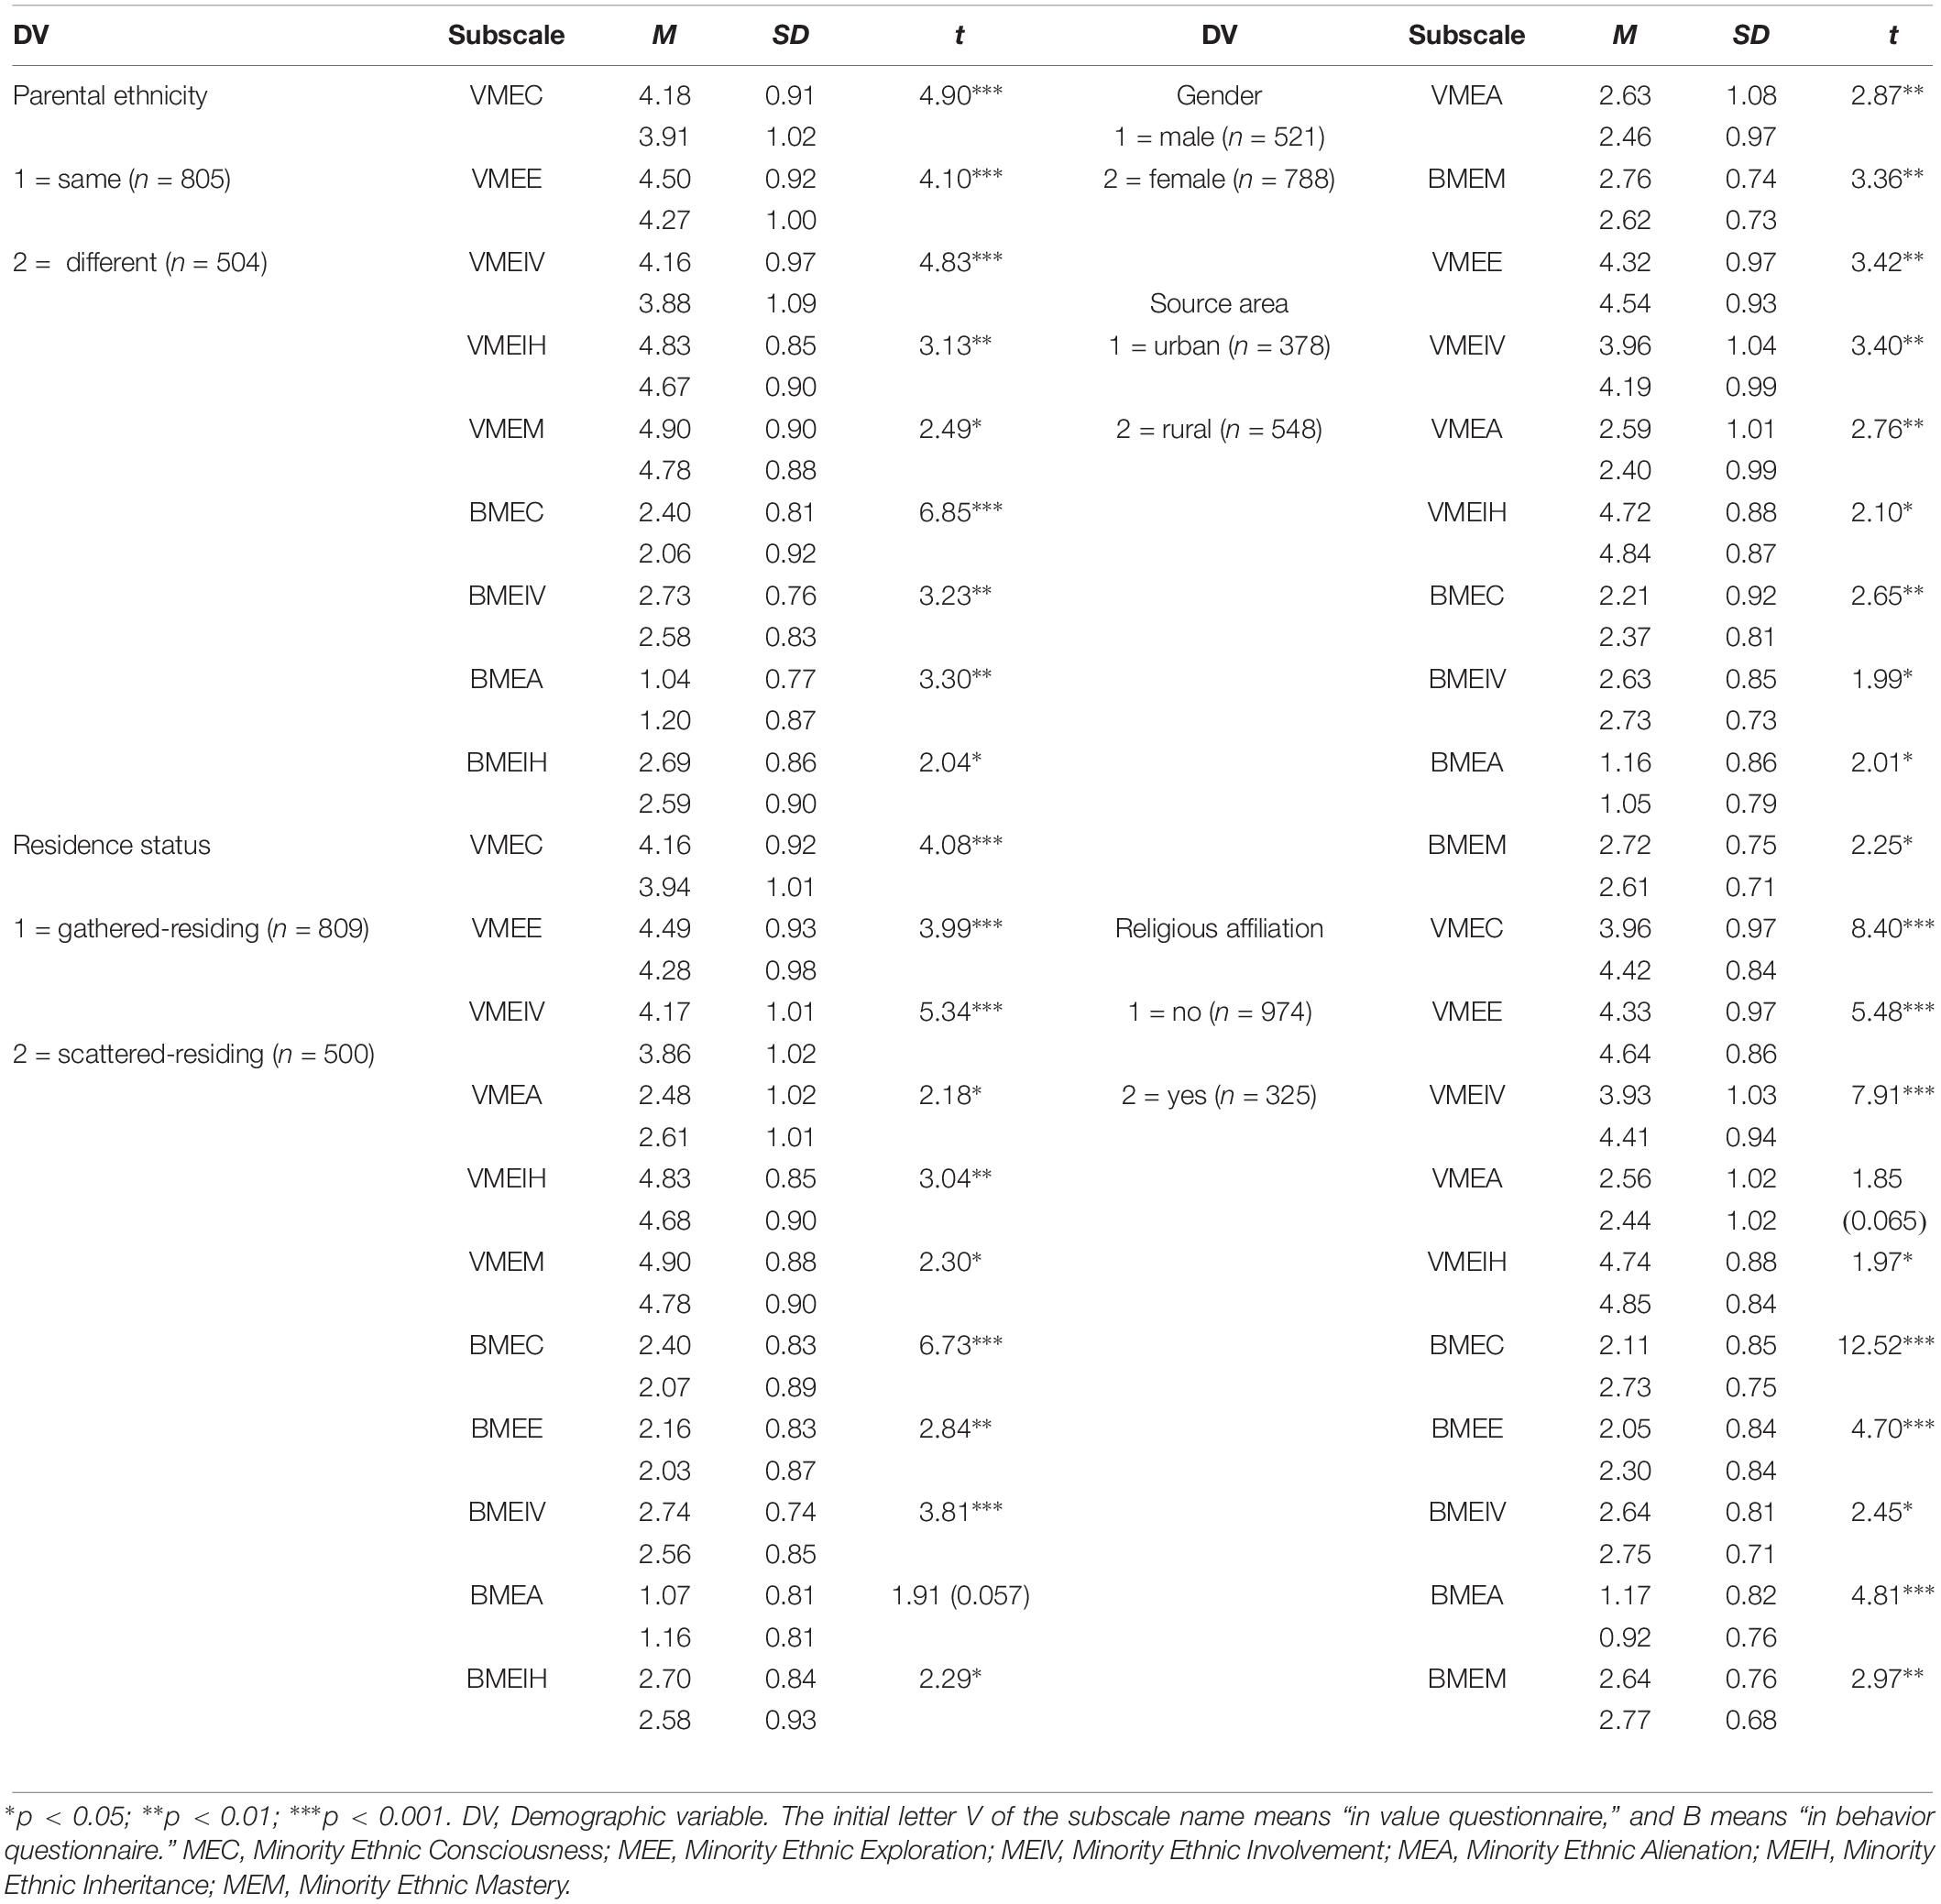
Table 7. Independent samples test of demographic variables among the subscales of CEMVQ and CEMVEBQ in Study 2.
In terms of gender, men scored higher than women on the V-MEA and B-MEM. Generally, men tended to leave their families and original ethnic settlements to find employment, and they had access to more external cultures than their own; women, on the other hand, were more likely to stay at home and to stay in contact with and inherit more indigenous ethnic culture (Phinney, 1990). This may lead to men gradually leaving behind ethnic indigenous context and weakening their ethnic consciousness. Men also tended to think that it was valuable to have good relationships with other ethnic groups (Tu, 2010, p. 20), reflected by MEM.
Parental ethnicity and family residence area (i.e., gathered or scattered, rural or urban) may also influence minority ethnicity (Phinney, 1990; Wan and Wang, 2004; Chen and Chen, 2018). Specifically, there may be stronger ethnicity for ethnic minorities living in rural, ethnic gathered-residence areas, and for families with parents of the same ethnic group, than those living in urban, ethnic scattered-residence areas, and families with parents of different ethnic groups. Parents of the same minority speak the same language, have common customs, and attend shared festivals with their children wearing ethnic clothing. These behaviors as ethnic symbols usually occur more diversely and frequently in minority gathered-residence areas, so ethnicity in such a context is strengthened and passed down from generation to generation. By comparison, parents of different ethnic groups would choose whether or not to follow their own ethnic customs according to the needs of the family, which was also applicable to minority dispersed-residence areas represented by mainstream culture or multicultural values. Ethnic minorities living in dispersed-residence areas perceive the possibility of engaging in ethnic behaviors by a small number of their own ethnic members including themselves in a non-indigenous ethnic context, based on the available resources and opportunities for such behaviors (Theory of Planned Behavior; Tesser and Shaffer, 1990). Furthermore, due to geographical remoteness and slow economic development, minority ethnic culture in rural areas was affected less by mainstream and external culture and remained relatively complete and unique; thus, minorities there have a higher ethnic identity than those living in more modern and multicultural urban areas (Ji and Li, 2016). Accordingly, a family with parents of the same ethnic group, a social context of ethnic gathered-residence, and a closed area away from multicultural influences may be factors that promote enhanced ethnicity. Interestingly, the developed subscales of the CMEVQ and CMEVEBQ presented significant differences in the three demographic variables, which supported the few existing conclusions and provided more accurate descriptions of ethnic-minority-values and behaviors.
Regarding religious affiliation, only 25.6% (n = 335) of respondents reported being religious believers. General speaking, the term “religious believer” refers to those who identify with one of the world’s top three religions, i.e., Islam, Christianity and Buddhism (as reported by interviews in the pilot study). In fact, natural religion exists widely among the ethnic minorities of Southwest China, the source of our study sample, and is closely integrated into the daily lives of minority ethnic people. Furthermore, these ethnic groups still tend to personify natural forces and frequently hold various related activities (Lu, 2006). It may be said that our minority ethnic participants who adhere to the tenets of Islam, Christianity or Buddhism also remain faithful to the natural religions passed down by their own ethnic ancestors. The two types of belief coexist in the same minority ethnic group or even the same ethnic member, and continue for a long time. In determining how ethnicity is presented in such cases, our results found that despite fewer participants reporting to be religious believers, believers scored higher than non-believers on 9 out of 10 positive dimensions, both for ethnic-minority-values and value-expressive behaviors. Thus, religion may contribute to ethnic identity and enhance minority ethnic ethnicity.
As we expected, participants who scored high on the MEC, MEE, MEIV, MEIH, and MEM subscales scored low on the MEA subscale, and MEA scored higher on demographic factors that have been suggested to weaken ethnicity, compared to those that may promote ethnicity. These findings also confirmed the construct and external validity of the two newly developed questionnaires and increased our confidence in using this dimension alone to check the ethnicity of ethnic members.
Associations Between Values and Value-Expressive Behaviors of Ethnic Minorities
Regarding ethnic-minority-value–behavior correlations, as shown in Table 6, all Pearson correlations on the diagonal axis were significant. Two (MEE and MEIH) of six minority ethnic-minority-values correlated most strongly with their corresponding ethnic-minority-behaviors than with the other five sets of behavior. MEC, MEIV, and MEA value correlated more strongly with its postulated behaviors than with the other five behavior sets. Only MEM value had a low correlation with its postulated behaviors set (r = 0.26).
Table 6 also shows that the MEA dimension is significantly negatively correlated with five other facets both in the CMEVQ and CMEVEBQ. This suggests that minority ethnic individuals who are psychologically or practically distant from their own minority ethnic groups have lower self-perception as members of those groups, seldom seek opportunities to explore their ethnic knowledge subjectively, and are indifferent as to care whether their own ethnicity is passed down through the generations. This supports the result in Wan and Wang (2004) that negative ethnic identity was positively correlated with cultural separation of groups. Moreover, such ethnic members themselves have been almost integrated into mainstream culture, as well having no self-perceived differences between their own ethnic group and others, which was also what the MEM facet meant. Thus, MEA has all the lowest correlations with MEM within value facets, behavior facets, and between two value-behavior correlations: −0.35, −0.20, −0.18, and −0.32, respectively.
To further verify their relationship, we also checked the predictive roles of ethnic values to its corresponding ethnic behaviors (see Table 8). Separately, with each of the six behavior subscales as the target variable, the predictors entered in the multiple regression comprised the six value subscales. Four of the six predictors, that is MEE, MEIV, MEA, and MEIH, explained the most variance of its postulated behavior and this added new statistical evidence that value is correlated most strongly with behavior in value-consistent directions, just as Schwartz and Butenko (2014) validated in the Russian context and Schwartz et al. (2017) in four countries. In contrast, with the behavior in minority ethnic consciousness (B-MEC) as the target variable, its most variance (β = 0.30) was explained by the predictor of value in minority ethnic involvement (V-MEIV) rather than its postulated ethnic value, which was consistent with the results of Pearson correlations, demonstrating that B-MEC correlated more strongly with V-MEIV than with the other five ethnic values; this suggested that the higher the emotional involvement of ethnic minorities in their own ethnic groups, the more strongly they self-perceived their ethnicity in daily behavior. This is consistent with the literature stating that respondents with higher IIS scores tended to report that their behaviors are more influenced by ingroup members than those with lower IIS scores (Tropp and Wright, 2001). Another potential coincidence was that the IIS correlated most strongly with B-MEC in this study.
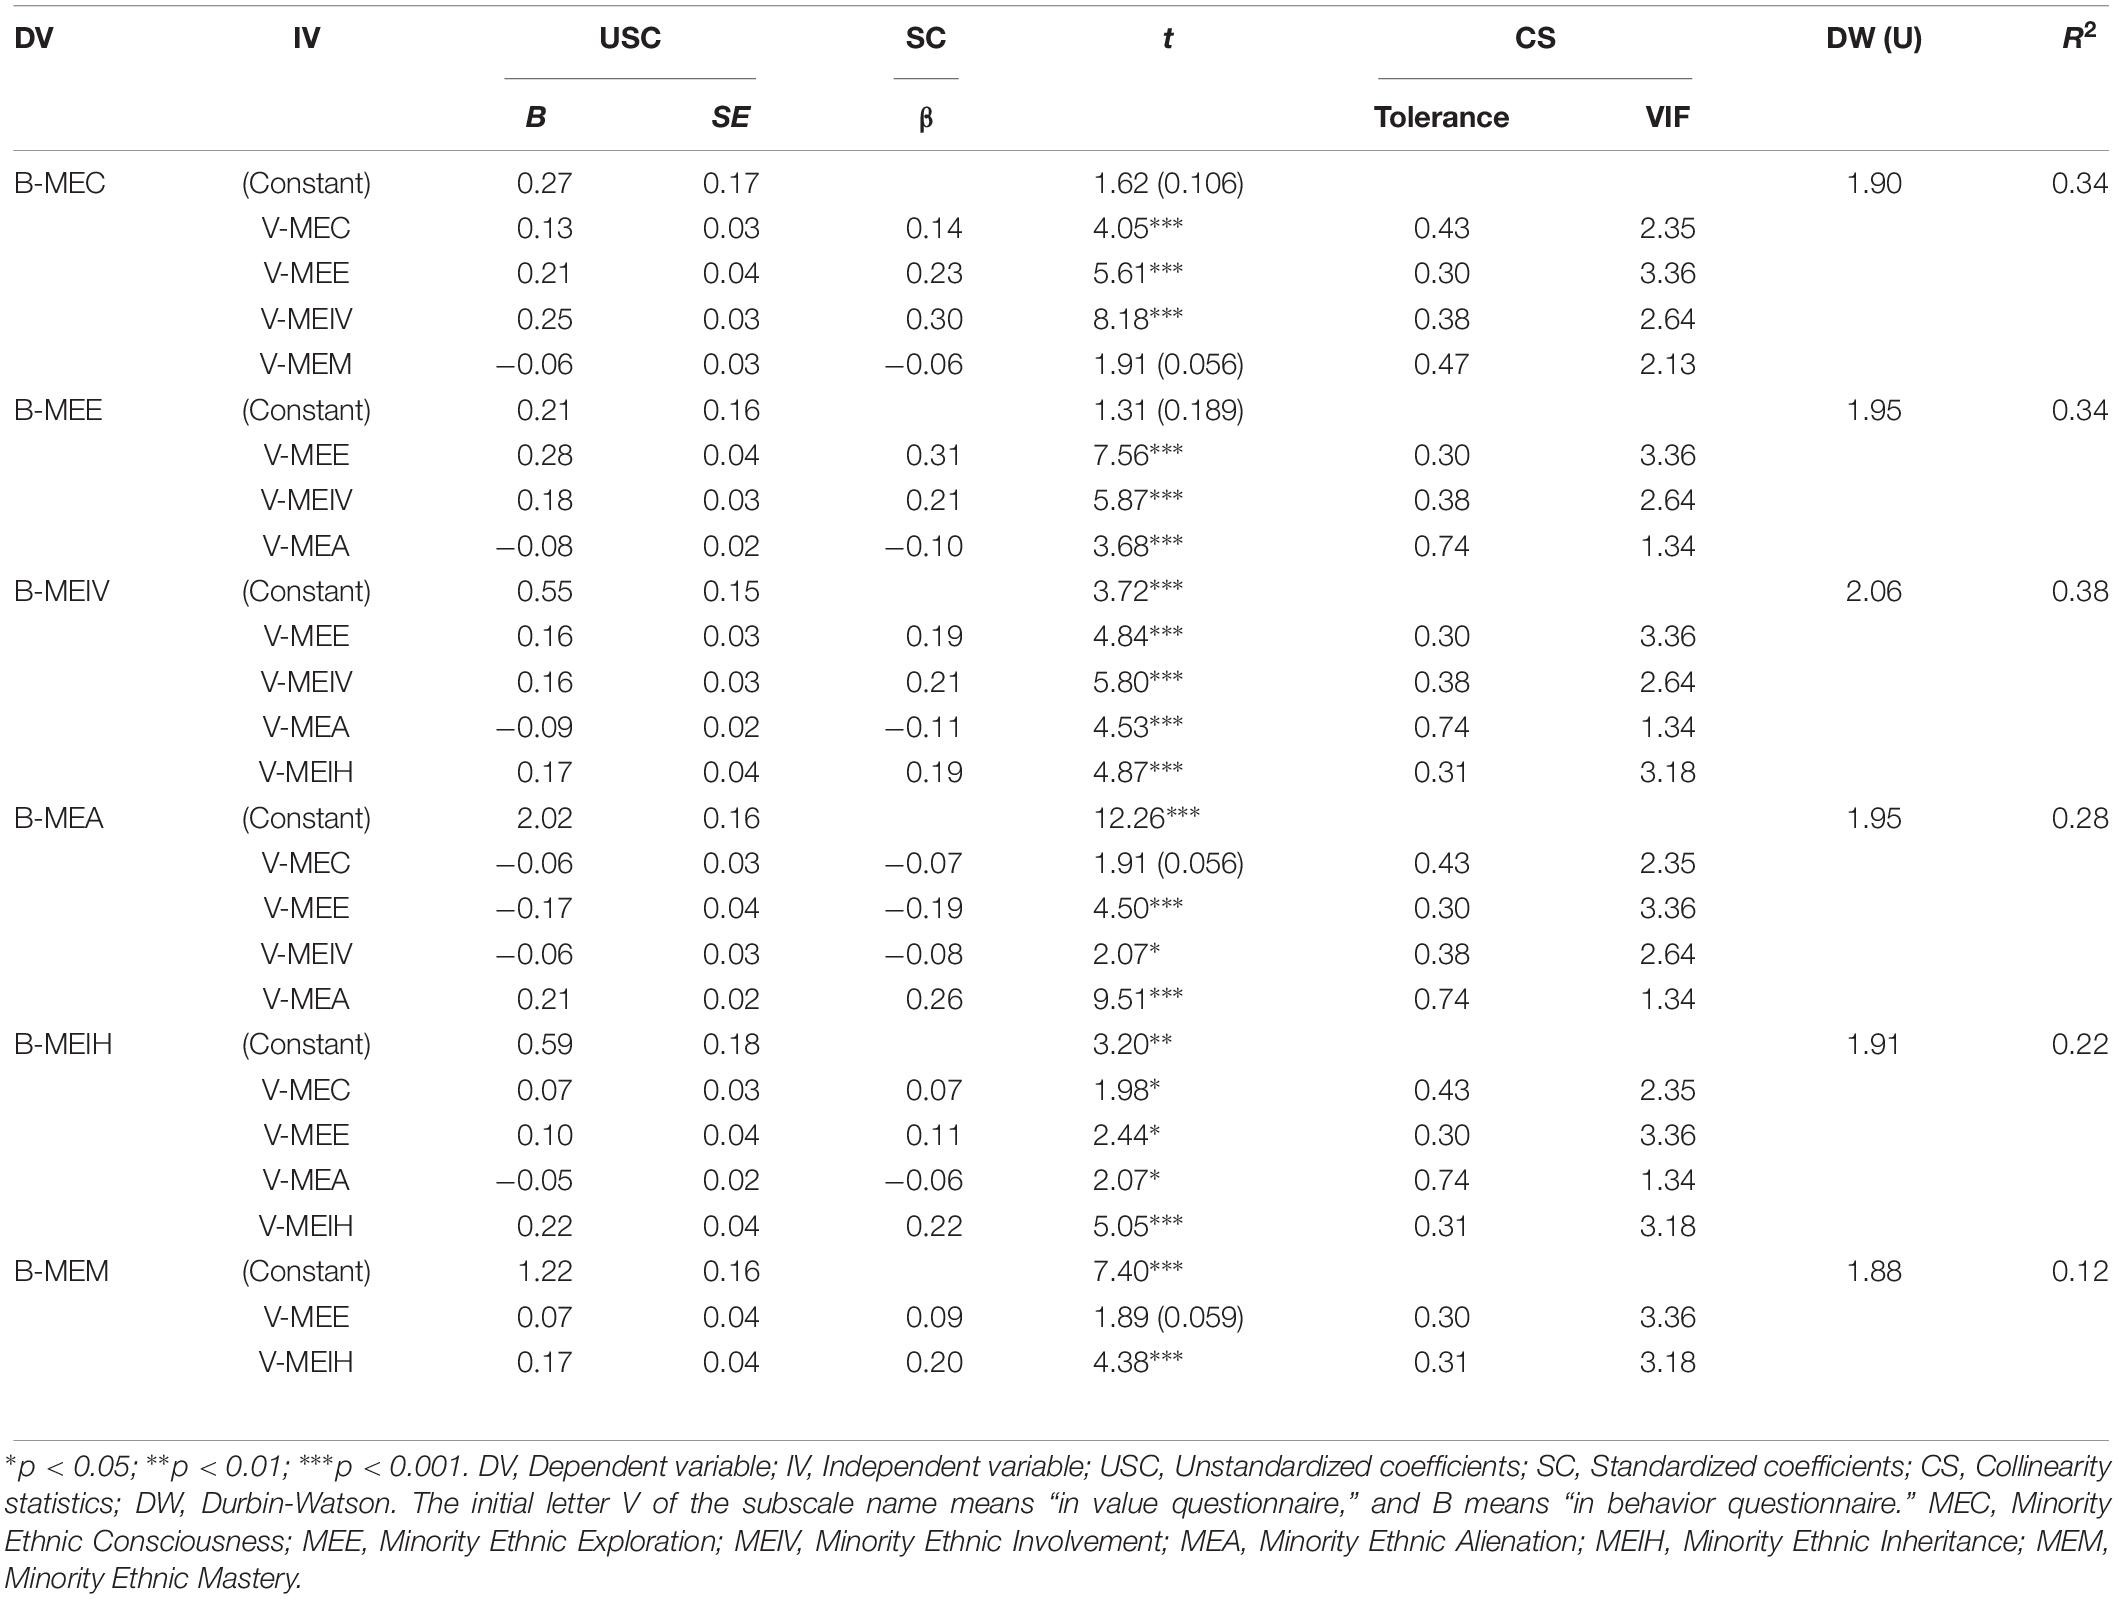
Table 8. Regression of ethnic minority value factors on minority value-expression behavior (only predictive independent variables that are significant or marginally significant).
Most ethnic values may predict ethnic behaviors either together or separately, suggesting that the two new questionnaires are well-matched and can even be mutually validated variables. However, the values MEM did not present the expected strong correlation with its postulated MEM behavior (r = 0.26, p < 0.001); there was no predictive role for the former on the latter, and the internal consistency of V-MEM was particularly low. There may be several reasons for this. Mastery as a cultural value orientation is the correlated polar dimension of harmony. In contrast to harmony, which emphasizes fitting into the social and natural world or acceptance rather than change, mastery encourages active self-assertion to attain group or personal goals (Schwartz, 2014). Ethnicity for minority ethnic groups requires changing to adapt to social development in order to achieve ethnic inheritance, rather than fitting into it (Verkuyten, 2005). The MEM dimension in this study aimed to assess how to deal with the relationship between a minority ethnic group and the external world through ethnic values and value-expressive behaviors. However, ethnic mastery is difficult to represent with only a few value items and typical behavioral instantiation, as the concept is too broad (e.g., Maio, 2010; Hanel et al., 2018). Furthermore, the harmonious and reciprocal relations among Chinese ethnic groups have not positioned this as a necessary issue among minority ethnic populations, suggesting that this needs to be examined in more empirical ethnic studies. Another reason may be poor content representation of the MEM facet. Individuals can have a strong sense of belonging to a group and yet not necessarily be engaged in daily ethnic activities (Phinney and Ong, 2007). Finally, individuals and groups have different value priorities or hierarchies, and will differ in their use of the response scales, especially among cross-cultural samples (Schwartz, 2006). This is also a possible explanation for the low alpha reliabilities obtained in the current study, as the participants in the Study 2 represented nearly 40 Chinese ethnic minorities. The low reliabilities of values scales also appeared in Schwartz’s values researches (e.g., Schwartz et al., 2001; Devos et al., 2002; Schwartz and Rubel, 2005).
Limitations and Future Directions
Several limitations to the current research need to be noted, and addressed in future studies. First, our participants required at least primary education to complete this survey independently, and this excluded some ethnic minorities who have poor education levels but may have many contacts with their ethnic cultures and have strong ethnicity. In addition, this study was mainly limited to college students without consideration of age and professional factors; thus, future studies should examine the ethnic values and ethnic behavior model and their metric properties in other minority ethnic populations. Second, in view of smaller samples for particular groups or totally unequal population ratio for diverse groups, the validity of the new questionnaires cannot be verified between minority ethnic groups. In future work, we plan to adopt a stratified sampling procedure to predetermine the size of each minority ethnic group to try to balance the population number between groups. Third, the current study investigated the statistical relationship between ethnic values and its corresponding behaviors. In future studies, it is necessary to test its causal relationship through the priming approach. Fourth, B-MEM had a lower internal consistency in newly developed scales than the generally agreed criteria, and several higher inter-factor correlations appeared in the CMEVQ. In view of the need for the external validity of the two newly developed scales, we retained the factors to further explore their content in future studies. Finally, this survey was limited by its exclusive use of self-reported data, which may have been affected by individuals’ incomplete memory and self-identification, and is also motivated by consistency seeking or social desirability. Rating from other observers on ethnic-minority-values and value-expressive behaviors may further our understanding of this domain; therefore, future studies may build the relation of self-rating to other-rating to reduce the response bias of participants as much as possible.
Conclusion
Based on Verkuyten’s (2005) four “ways of ethnicity,” value theory, and an operational definition of ethnic-minority-values, we developed the CMEVQ and CMEVEBQ to systematically examine the psychological structure of ethnic-minority-values and value-expressive behavior in the Chinese multiethnic population. CMEVEBQ as a behavioral measure was generated specifically to match the value dimensions. The two new questionnaires from the ethnic “inside” measured “being,” “feeling,” “knowing,” and “doing” with minority ethnic consciousness, exploration, involvement, alienation, inheritance, and mastery. The questionnaires advance previous measures by separately including the values and behavioral descriptions expressing the importance of ethnicity as covered by their six shared subscales within two focused and practical instruments of 18 items each.
In Study 1, the results of EFA, SEM, and MG-CFA indicated that the ethnic-minority-value and value-expressive behavior models were robust and had reasonable psychometric properties across ethnic settlement regions. In Study 2, the relevance examination with criterion scales, K-means cluster analysis, and difference tests across demographic factors offered further support for the convergent, divergent, and ecological validity of the CMEVQ and CMEVEBQ. The results of associations between ethnic-minority-values and value-expressive behavior by Pearson correlation and multiple regression provided further statistical and sample evidence that values serves as a guide of behavioral tendencies. In addition, EMA, as an assumed factor of cognitive unimportance in ethnicity, was negatively correlated with all variables of cognitive importance in ethnicity in this study, which enhanced the credibility of the other five shared factors in measuring ethnic-minority-values and their corresponding behaviors. Therefore, the ethnicity of a minority ethnic member is a significant component of their overall self-construal, and they can automatically categorize themselves and others into different groups in terms of ethnicity. In conclusion, the current research provides statistical support and a method to practically measure the values and value-expressive behaviors of ethnic minorities, as well as develops a new path to represent the importance of ethnicity for ethnic minorities and extends the research field on value theory. All of these have contributed to passing down the cultural uniqueness of ethnic minorities and to further in-depth research by researchers and practitioners in the ethnological field.
Implications of Using the CMEVQ and CMEVEBQ
The current status of the CMEVQ and CMEVEBQ suggests that these measures can be useful tools to facilitate understanding of the importance of ethnicity by ethnic-minority-values and value-expressive behaviors in broad strokes. The two questionnaires can be used alone or together. Our empirical findings on the shared six-factor structure, as well as the interpretability of specific factor scores, indicate that the measures captured a basic understanding of ethnic-minority-value and four “ways of ethnicity” in Chinese culture. Further, the two sets of items were sufficiently heterogeneous to cover the importance and common contents of minority ethnic cultures and behavioral manifestations.
As values and behaviors are concrete concepts that involve specific content, such as tradition, achievement, or power (Schwartz, 2014; Schwartz et al., 2017), rather than a general or common concept that can be presented by the overall mean scores for all subscales, it would be appropriate and meaningful to compute the mean subscale scores. These subscale scores could be used together in the same analyses to represent diverse domains of importance of ethnicity for ethnic minorities.
As for the four-factor model, we named the four factors Ethnic Being (EB), Ethnic Feeling (EF), Ethnic Knowing (EK), and Ethnic Doing (ED), to distinguish them from those of the six-factor model for both questionnaires. For the CMEVQ in Table 3, Values-EB includes MEIV1-3 and MEC1-2 (5 items); Values-EF includes MEA1-3 (3 items); Values-EK includes MEM1-3 (3 items); and Values-ED includes MEE1-3, MEIH1-3 and MEC3 (7 items). For the CMEVEBQ in Table 4, Behavior-EB includes MEC1-3 and MEE1-3 (6 items); Behavior-EF includes MEIV1-3 (3 items); Behavior-EK includes MEA1-3 (3 items); and Behavior-ED includes MEIH-3 and MEM1-3 (6 items).
Attachment
The item content of the newly developed questionnaires in this study are shown in Tables 3, 4, respectively. Their instructions are as follows:
Instruction on the CMEVQ
Here, we briefly describe different people. Please read the following statements carefully and consider how much the person described is or is not like you. Rate the extent to which the person described is like you, using the following scale: 1 (not like me) to 6 (very much like me).
Instruction for the CMEVEBQ
Here, we briefly describe different ethnic behaviors. Please read the following statements carefully and rate the behavior that best describes how often you have engaged in the behavior relative to your opportunities to do so, on the following scale: 0 (never) to 4 (always). If you think you have never had even one opportunity to do the described behavior, mark the behavior with an X.
Data Availability Statement
The datasets generated for this study are available on request to the corresponding author.
Ethics Statement
All studies in this article were recommended and approved by the Ethics Committee of Southwest University. All participants were informed of the survey purpose and told that their responses were voluntary, confidential, and for research purposes only. They provided online informed consent in accordance with the Declaration of Helsinki. After completion, participants were paid for their participation and invited to contact the researcher if they had any further questions about the study.
Author Contributions
YY designed the study, collected and analyzed the data, and drafted the initial manuscript. FL participated in the design of the questionnaires. FQ contributed to the data analyses. GJ and KY participated in issuing and collecting the questionnaires. YZ provided the critical comments and contributed to the revision. All authors approved the final version of the manuscript for submission.
Funding
This work was supported by the MOE Project of Key Research Institute of Humanities and Social Sciences at Universities (15JJDZONGHE022), China.
Conflict of Interest
The authors declare that the research was conducted in the absence of any commercial or financial relationships that could be construed as a potential conflict of interest.
Footnotes
References
Abrams, D. (2015). “Social identity and intergroup relations,” in APA Handbook of Personality and Social Psychology: Vol. 2. Group Processes, eds M. Mikulincer, and P. R. Shaver, (Washington, DC: American Psychological Association), 203–228.
Bagozzi, R., and Yi, Y. (1988). On the evaluation of structural equation models. J. Acad. Mark. Sci. 16, 74–94. doi: 10.1007/BF02723327
Bentler, P. M. (1990). Comparative fit indexes in structural models. Psychol. Bull. 107, 238–246. doi: 10.1037/0033-2909.107.2.238
Buss, D. M., and Craik, K. H. (1983). The act frequency approach to personality. Psychol. Rev. 90, 105–126. doi: 10.1177/0146167289151007
Chen, B. L., and Chen, J. (2018). Ethnic characteristics and student academic performance — based on a survey of tibetan college students in tibetan autonomous region. Think 5, 34–41.
Cheung, G. W., and Rensvold, R. B. (2002). Evaluating goodness-of-fit indexes for testing measurement invariance. Struct. Equ. Modeling 9, 233–255. doi: 10.1207/s15328007sem0902_5
Chinese National Bureau of Statistics, (2010). The Main Data of the Sixth National Population Census Bulletin in 2010 (No. 1). Available at: www.stats.gov.cn/tjsj/tjgb/rkpcgb/qgrkpcgb/201104/t20110428_30327.html (accessed May 5, 2019).
Costello, A. B., and Osborne, J. (2005). Best practices in exploratory factor analysis: four recommendations for getting the most from your analysis. Pract. Assess. Res. Eval. 10, 1–9.
Deng, M., and Zhang, X. F. (2014). Preliminary study on hani and yi undergraduates’ ethnic identity. China J. Health Psychol. 22, 630–631.
Devos, T., Spini, D., and Schwartz, S. H. (2002). Conflicts among human values and trust in institutions. Br. J. Soc. Psychol. 41, 481–494. doi: 10.1177/0022022101032005001
Edwards, A. L. (1984). An introduction to linear regression and correlation. Math. Gazette 69, 1–17.
Fei, X. T. (1999). The Pattern of Diversity in Unity of the Chinese Nation (Revised edition). Beijing: Central University for Nationalities Press.
Fishman, J. (1980). “Social theory and ethnography,” in Ethnic Diversity and Conflict in Eastern Europe, ed. P. Sugar (Santa Barbara, CA: ABC-Clio), 84–97.
Gaines, S. O. Jr., Lefringhausen, K., Charura, D., Kangatharan, J., Singh, J., Tamimi, N., et al. (2016). Ethnic speech and ethnic action as ethnic behavior: part 2. validation of the brunel ethnic behavior inventory. Identity 16, 87–101. doi: 10.1080/15283488.2016.1159962
Hair, J. F., Black, W. C., Babin, B. J., and Anderson, R. E. (2009). Multivariate Data Analysis, 7th Edn, New Jersey, NJ: Prentice Hall.
Hanel, P., Maio, G. R., Soares, A., Vione, K. C., De, G. H. C., Gouveia, V. V., et al. (2018). Cross-cultural differences and similarities in human value instantiation. Front. Psychol. 9:849. doi: 10.3389/fpsyg.2018.00849
Hou, A. B. (2008). The Structure, Characteristics and Change of Ethnic Minorities’ Values. Doctoral Dissertation, Southwest University, Chongqing.
Hu, F. W., Wang, P., and Li, L. J. (2014). Psychometric structure of the chinese multiethnic adolescent cultural identity questionnaire. Psychol. Assess. 26:1356. doi: 10.1037/a0037690
Hu, L., and Bentler, P. M. (1999). Cut-off criteria for fit indexes in covariance structure analysis: conventional criteria versus new alternatives. Struct. Equ. Modeling 6, 1–55. doi: 10.1080/10705519909540118
Ji, Y., and Li, J. W. (2016). Investigation on ethnic identity of minority college students. Minzu Tribune 7, 98–100.
Kline, R. B. (2015). Principles and Practice of Structural Equation Modeling. New York, NY: Guilford publications.
Kluckhohn, C. (1951). “Values and value-orientations in the theory of action: an exploration in definition and classification,” in Toward a General Theory of Action, eds T. Parsons, and E. Shils, (Cambridge, MA: Harvard University Press).
Koh, J. B. K., Shao, Y., and Wang, Q. (2009). Father, mother and me: parental value orientations and child self-identity in Asian American immigrants. Sex Roles 60, 600–610. doi: 10.1007/s11199-008-9550-z
Krippendorff, K. (2007). Computing Krippendorff’s Alpha-Reliability (Annenberg School for Communication Working Paper 43). Available at: http://repository.upenn.edu/asc_papers/43/ (accessed April 23, 2019).
Little, T. D. (1997). Mean and covariance structures (macs) analyses of cross-cultural data: practical and theoretical issues. Multivar. Behav. Res. 32, 53–76. doi: 10.1207/s15327906mbr3201_3
Lomax, R. G., and Schumacker, R. E. (2004). A beginner’s Guide to Structural Equation Modeling. Abingdon: Psychology press.
Lu, Q. (2006). The traits and cultural significance of natural religion: take Southwest minority as an example. Relig. Stud. 2, 129–132. doi: 10.3969/j.issn.1006-1312.2006.02.024
Maio, G. R. (2010). “Mental representations of social values,” in Advances in Experimental Social Psychology, Vol. 42, ed. M. P. Zanna, (San Diego, CA: Academic Press), 1–43. doi: 10.1016/s0065-2601(10)42001-8
Maio, G. R. (2015). The Psychology of Human Values. European Monographs in Social Psychology. London: Psychology Press.
Meng, X. L. (1994). Multiple-imputation inferences with uncongenial sources of input. Stat. Sci. 9, 538–558. doi: 10.1214/ss/1177010269
Nunnally, J. C., and Bernstein, I. H. (1994). Psychometric Theory, 3rd Edn, New York, NY: McGraw-Hill.
Ong, A. D., Fuller-Rowell, T. E., and Phinney, J. S. (2010). Measurement of ethnic identity: recurrent and emergent issues. Identity 10, 39–49. doi: 10.1080/15283481003676226
Phinney, J. S. (1990). Ethnic identity in adolescents and adults: review of research. Psychol. Bull. 108, 499–514. doi: 10.1037/0033-2909.108.3.499
Phinney, J. S. (1992). The multigroup ethnic identity measure: a new scale for use with diverse groups. J. Adoles. Res. 7, 156–176. doi: 10.1177/074355489272003
Phinney, J. S. (1996). When we talk about American ethnic groups, what do we mean? Am. Psychol. 51, 918–927. doi: 10.1037/0003-066X.51.9.918
Phinney, J. S., and Ong, A. D. (2007). Conceptualization and measurement of ethnic identity: current status and future directions. J. Couns. Psychol. 54, 271–281. doi: 10.1037/0022-0167.54.3.271
Qi, Q. F. (2000). On the value structure of the traditional culture of Chinese ethnic minority. Philos. Soc. Sci. 1, 20–29.
Roccas, S., and Sagiv, L. (2010). Personal values and behavior: taking the cultural context into account. Soc. Pers. Compass 4, 31–41. doi: 10.1111/j1751-9004.2009.00234.x
Schwartz, S. H. (1992). Universals in the content and structure of values: theoretical advances and empirical tests in 20 countries. Adv. Exp. Soc. Psychol. 25, 1–65. doi: 10.1016/S0065-2601(08)60281-6
Schwartz, S. H. (2006). Les valeurs de base de la personne: théorie, measures et applications [Basic human values: theory, measurement, and applications]. Rev. Fr. Sociol. 42, 249–288. doi: 10.3917/rfs.474.0929
Schwartz, S. H. (2014). National culture as value orientations: consequences of value differences and cultural distance. Handb. Econ. Art Cult. 2, 547–586. doi: 10.1016/B978-0-444-53776-8.00020-9
Schwartz, S. H., and Butenko, T. (2014). Values and behavior: validating the refined value theory in Russia. Eur. J. Soc. Psychol. 44, 799–813. doi: 10.1002/ejsp.2053
Schwartz, S. H., Cieciuch, J., Vecchione, M., Davidov, E., Fischer, R., Beierlein, C., et al. (2012). Refining the theory of basic individual values. J. Pers. Soc. Psychol. 103, 663–688. doi: 10.1037/a0029393
Schwartz, S. H., Cieciuch, J., Vecchione, M., Torres, C., Dirilem-Gumus, O., and Butenko, T. (2017). Value tradeoffs propel and inhibit behavior: validating the 19 refined values in four countries. Eur. J. Soc. Psychol. 47, 241–258. doi: 10.1002/ejsp.2228
Schwartz, S. H., Melech, G., Lehmann, A., Burgess, S., Harris, M., and Owens, V. (2001). Extending the cross-cultural validity of the theory of basic human values with a different method of measurement. J. Cross Cult. Psychol. 32, 519–542. doi: 10.1177/0022022101032005001
Schwartz, S. H., and Rubel, T. (2005). Sex differences in value priorities: cross-cultural and multimethod studies. J. Pers. Soc. Psychol. 89:1010. doi: 10.1037/0022-3514.89.6.1010
Swann, W. B. Jr., and Bosson, J. K. (2010). “Self and identity,” in Handbook of Social Psychology, 5th Edn, Vol. 1, eds S. T. Fiske, D. T. Gilbert, and G. Lindzey, (Hoboken, NJ: Wiley), 589–628.
Tajfel, H., and Turner, J. (1986). “The social identity theory of intergroup behavior,” in Psychology of Intergroup Relations, eds S. Worchel, and W. Austin, (Chicago: Nelson-Hall), 7–24.
Tesser, A., and Shaffer, D. R. (1990). Attitudes and attitudes change. Annu. Rev. Psychol. 41, 179–523. doi: 10.1146/annurev.ps.41.020190.002403
Thompson, B. (2004). Exploratory and Confirmatory Factor Analysis: Understanding Concepts and Applications. Washington, DC: American Psychological Association.
Tropp, L. R., and Wright, S. C. (2001). Ingroup identification as the inclusion of ingroup in the self. Pers. Soc. Psychol. Bull. 27, 585–600. doi: 10.1177/0146167201275007
Tu, Y. F. (2010). Research on the Ethnic values and its inheritance in Southwestern ethnic Groups. Master’s Dissertation, Southwest University, Chongqing.
Verkuyten, M. (2005). The Social Psychology of Ethnic Identity. Hove, United Kingdom. London: Psychology Press.
Verkuyten, M. (2006). Multicultural recognition and ethnic minority rights: a social identity perspective. Eur. Rev. Soc. Psychol. 17, 148–184. doi: 10.1080/10463280600937418
Verkuyten, M., and De Wolf, A. (2002). Ethnic minority identity and group context: self-descriptions, acculturation attitudes and group evaluations in an intra- and intergroup situation. Eur. J. Soc. Psychol. 32, 781–800. doi: 10.1002/ejsp.121
Verplanken, B., and Holland, R. W. (2002). Motivated decision making: effects of activation and self-centrality of values on choices and behavior. J. Pers. Soc. Psychol. 82, 434–447. doi: 10.1037/0022-3514.82.3.434
Verplanken, B., Trafimow, D., Khusid, I. K., Holland, R. W., and Steentjes, G. M. (2009). Different selves, different values: effects of self-construals on value activation and use. Eur. J. Soc. Psychol. 39, 909–919. doi: 10.1002/ejsp.587
Wan, M. G., and Wang, Y. P. (2004). Ethnic identity of Tibetan undergraduates. Acta Psychol. Sin. 1, 83–88.
Williams, R. M. Jr. (1968). “Values,” in International Encyclopedia of the Social Sciences, ed. E. Sills, (New York, NY: Macmillan).
Keywords: way of ethnicity, ethnic-minority-value, ethnic value-expressive behavior, validity, ethnic value-behavior relations
Citation: Yang Y, Liang F, Quan F, Jiang G, Yu K and Zheng Y (2019) The Importance of Ethnicity: Developing a Measure of Minority Ethnic Value and Value-Expressive Behavior Among Chinese Ethnic Minorities. Front. Psychol. 10:2603. doi: 10.3389/fpsyg.2019.02603
Received: 20 June 2019; Accepted: 04 November 2019;
Published: 19 November 2019.
Edited by:
Jin Eun Yoo, Korea National University of Education, South KoreaReviewed by:
Gustavo Gonzalez-Cuevas, Idaho State University, United StatesFabian Gander, University of Zurich, Switzerland
Copyright © 2019 Yang, Liang, Quan, Jiang, Yu and Zheng. This is an open-access article distributed under the terms of the Creative Commons Attribution License (CC BY). The use, distribution or reproduction in other forums is permitted, provided the original author(s) and the copyright owner(s) are credited and that the original publication in this journal is cited, in accordance with accepted academic practice. No use, distribution or reproduction is permitted which does not comply with these terms.
*Correspondence: Yong Zheng, zhengy@swu.edu.cn