 Ruizhi Zhang
- School of Arts, Hunan City University, Yiyang, China
As a product of the tourism performing arts industry in culture–tourism integration development, to develop a featured culture–tourism town is a new trend for tourism development in the new era. To analyze the social benefit of the culture–tourism industry, in this study, an artificial intelligence model for social benefit evaluation is constructed based on backpropagation (BP) neural network and fuzzy comprehensive analysis, with Yiyang Town taken as an example. The criterion layer in the model includes three indexes (life benefit G1, environmental benefit G2, and economic benefit G3), and the index layer contains 11 indexes (H1–H11). The weight values of cultural inheritance and protection, ecological environment improvement, and commercial economy development to the social benefit of the town are 0.522, 0.570, and 0.424, respectively. For G1, 41.20% is excellent; for G2, 39.5% is excellent; and for G3, 40.5% is good. In general, 30.76% of the total social benefit is excellent, with 37.69% being good, 21.48% being qualified, and 10.07% being unqualified. It is inferred that the total social benefit level of Yiyang Town is good according to the constructed model. Therefore, the culture inheritance and protection, the ecological environment improvement, and the commercial economy development are the key evaluation factors of social benefit.
Introduction
As time goes by, Chinese tourists can no longer be attracted by purely scenic spots. Industry integration, as a more advanced mode for the vigorous development of the industry, has become an inevitable trend (Kim et al., 2019; Urien-Lefranc, 2020; Yang and Wang, 2020). Tourism performing arts is one of the typical forms in culture–tourism integration development in recent years. Being an important carrier of cultural heritage, it carries forward Chinese culture during tourism (Samora-Arvela et al., 2020). In recent years, the tourism performing arts is increasingly energetic. According to relevant data from 2013 to 2017, the domestic number of channels for the tourism performing arts program increased from 187 to 268, up by 43%. The number of tourism performing arts programs increased from 53,336 to 85,753, with an increase of 61%. Audience of tourism performing arts increased from 27.89 million to 68.21 million, up by 145%. The box-office revenue of tourism performing arts increased from 2.26 billion yuan to 5.15 billion yuan, with an increase of 128% (Ranasinghe and Cheng, 2018). Especially in the past 2 years, with the market being more mature, tourism performing arts projects have seen faster development. The culture–tourism town is a new tourism product with the integration of cultural and performing industries (Zhang et al., 2020). As one of the culture–tourism towns in Hunan Province, the transportation infrastructure in Yiyang has experienced vigorous progression in recent years, which further highlights its regional advantages. In addition, many culture–tourism projects of Yiyang characteristics have been constructed, such as Tianyi Muguo (a resort characterized by the things made of wood), tea-horse ancient road, tea-scented flower sea (a place characterized by all kinds of flowers), and Anhua Meishan Cultural Ecological Park, which makes Yiyang more popular in tourists (Wu and Wu, 2017; Drius et al., 2019). Therefore, the Yiyang Town in Yiyang region is taken as an example in the study.
Fuzzy comprehensive evaluation based on fuzzy mathematics is a comprehensive evaluation method which adopts fuzzy relation synthesis to quantify some factors with unclear boundaries (Wu and Wu, 2017; Chen, 2019; Yuan and Wu, 2020). This method is mainly applicable to evaluation objectives with multiple variables and fuzziness. Through the construction of a reasonable evaluation system, the evaluation factor is assigned a certain value according to the score given by the expert, and then reliable results are obtained through analysis (Su et al., 2016; Obschonka et al., 2018). Traditional artificial intelligence mainly contains pattern analysis, machine learning, and data mining. As a hot topic in the field of artificial intelligence, deep learning has made breakthroughs in such fields as large-scale speech recognition and large-scale image retrieval (Li and Cao, 2018). The BP neural network is one of the most effective multilayer deep learning methods among them, which has complex pattern classification capability and excellent multidimensional function mapping capability, and can solve different problems that simple perceptron cannot solve. Further, it can also continuously adjust the network weight value to make the final output of the network as close as possible to the expected output (Rogoza et al., 2018; Li et al., 2019). From the perspective of inbound tourism demand, Shi (2020) used deep learning BP neural network to extract 7 influence factors to construct the eigenvector and predicted the number of inbound tourists in Yangjiang in 2018–2019. The results showed that the mean square error and R2 coefficient were 0.011695 and 0.94744, respectively, which were acceptable. Based on the deep learning BP neural network, Li (2020) constructed an artificial intelligence prediction model for the temporal and spatial distribution of tourists and collected the spatial and temporal distribution data from five aspects: the probability distribution of tourists' destinations, the transfer probability between tourist attractions, the scenic spot time distribution, the moving time between scenic spots, and the scenic spot area. It is found that this artificial intelligence model had high prediction accuracy and is suggested in the temporal and spatial distribution prediction of tourists. Therefore, in the study, deep learning BP is combined with the fuzzy comprehensive evaluation method to design an artificial intelligence model for social benefit evaluation.
Materials and Methods
The Selection of the Research Subject
In this study, the Yiyang culture–tourism town in Yiyang region is selected as the research subject. The function zones of this town include health and health community (F1), agricultural sightseeing and leisure zone (F2), outdoor ecological experience zone (F3), waterfront leisure zone (F4), and folk performing arts culture experience zone (F5). As shown in Figure 1, the healthcare community covers a floor space of 789,167m2 and a building area of 453,717m2, respectively; the agricultural sightseeing and leisure zone covers a floor space of 568,807m2 and a building area of 334,107m2, respectively; the outdoor ecological experience zone covers a floor space of 227,362 square meters and a building area of 43,189m2, respectively; the waterfront leisure area covers a floor space of 164,911m2 and a building area of 105,726m2, respectively; and the folk performing arts cultural experience covers a floor space and a building area of 257,737 and 86,081m2, respectively.
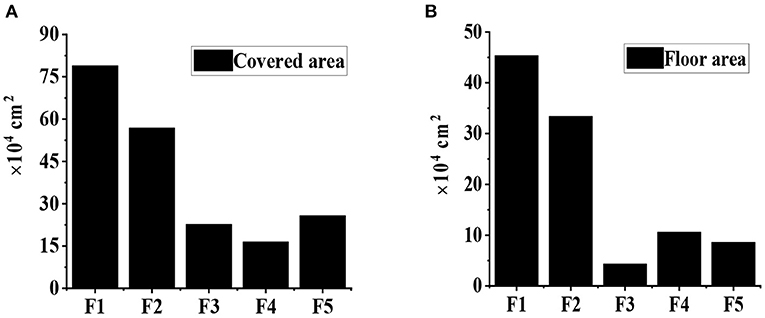
Figure 1. The floor space and building area of function zones in Yiyang culture–tourism town. (A) The floor space; (B) is the building area.
Definition of Relevant Concepts
The Culture-Tourism Town
A culture-tourism town refers to a town with clear industrial orientation, cultural characteristics, tourism characteristics, and certain community functions, which is different from an administrative town. It can turn the idle resources of rural areas, such as green mountains and clear waters, pastoral lifestyle, and traditional culture, into economic advantages. Besides, it can also drive the flow of urban capital to the countryside, thus improving rural infrastructure, public services, and environmental health. Furthermore, it also creates new jobs for farmers (Yi et al., 2019). In general, the culture–tourism town is a town involving culture inheritance in tourism development, which combines various elements such as food, clothing, housing, and transportation. Nowadays, there has been a preliminary industrial chain for culture–tourism town development, as shown in Figure 2, including three stages which are upstream development and investment, midstream planning and operation, and downstream product distribution. The upstream development investment includes investors and developers, the midstream planning and operation includes service providers and operators, and the downstream product distribution includes product distributors and distribution channels, and at the end are the users.
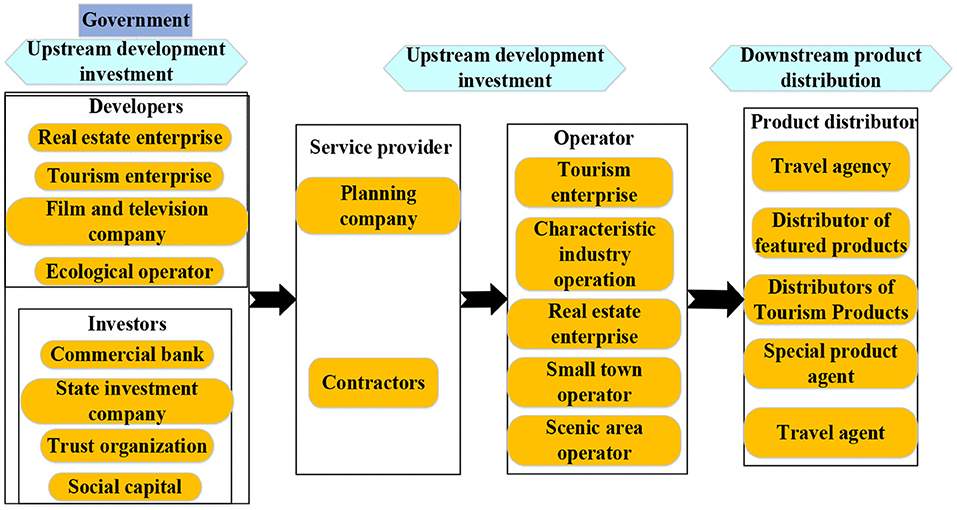
Figure 2. The industry chain of the culture–tourism town.
Social Benefit of Small Towns With Culture–Tourism Characteristics
Social benefit refers to the maximum use of limited resources, which aims to satisfy growing material and cultural needs of people in society. To be specific, it is the total contributions of a certain project to employment, living standard, and social welfare. The construction of the culture–tourism town improves local employment, living standard, and regulation system (Kim et al., 2020). What is more, the coordination and cooperation between government supervision and market economy is realized during the process.
Evaluation Indexes of Social Benefit of the Culture–Tourism Town
At present, although there are an increasing number of scholars analyzing the benefit of the culture–tourism town, with some relevant index systems established, there are few studies on the social benefit of the culture–tourism town. Most of the literature focuses on the economic benefit (Ramsey and Malcolm, 2018; Yousif, 2018). Therefore, with China's national conditions and policy development taken into account, the social benefit evaluation indexes are selected by referring to previous literature. The results are shown in Table 1. According to these indexes, the social benefit evaluation index system of the culture–tourism town is constructed, as shown in Figure 3.
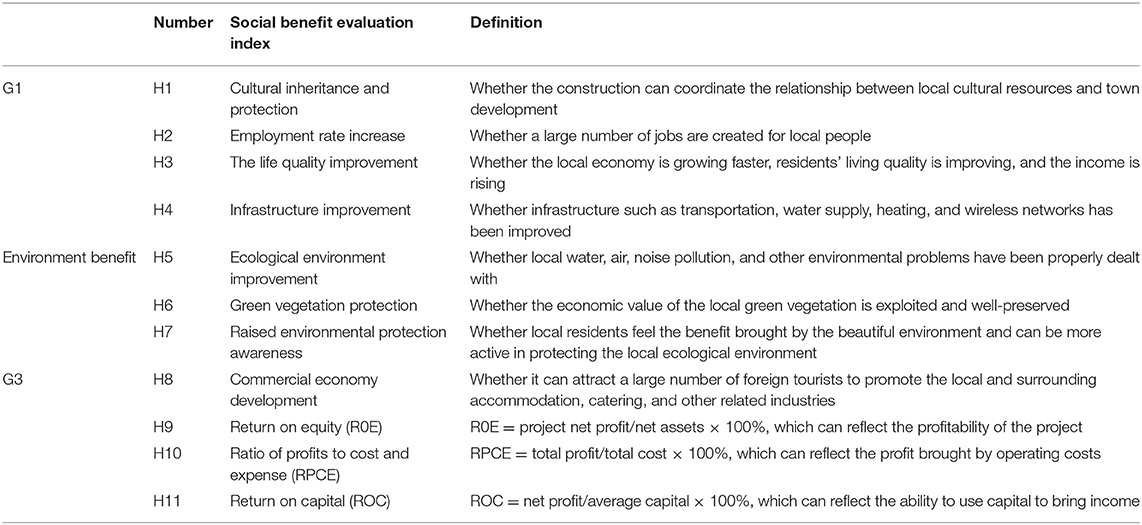
Table 1. Evaluation index of social benefit of small towns with culture–tourism characteristics.
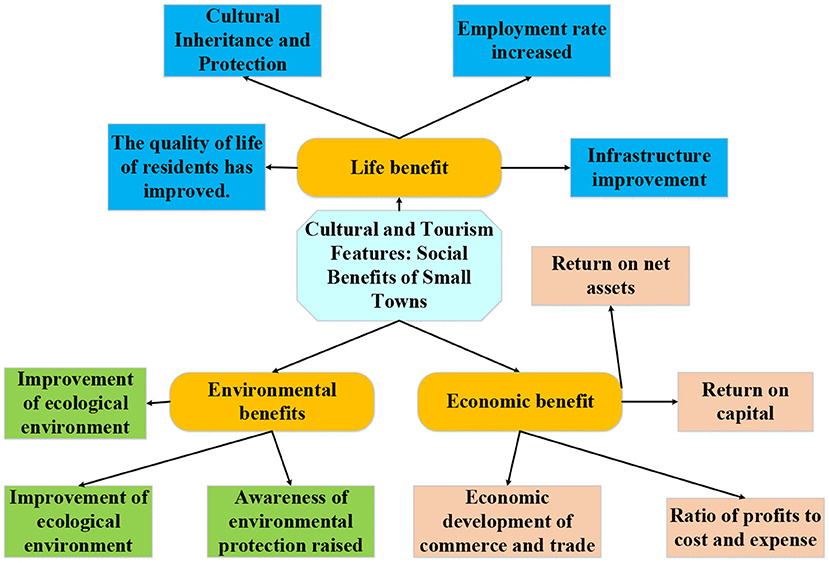
Figure 3. The evaluation indexes of social benefit of the culture–tourism town.
Artificial Intelligence Evaluation Model Based on BP-Fuzzy Comprehensive Analysis
Many evaluation indexes are selected in this study, all of which are qualitative factors with fuzziness. In addition, there are differences in the influence degree of each index on the social benefit of the culture–tourism town. Therefore, the fuzzy processing on each index is carried out. Then, the fuzzy factors are quantitatively analyzed to determine the expected output value of the deep learning BP neural network (Wu et al., 2020). Finally, the model is constructed through sample training and learning. The specific process is as follows.
First, the fuzzy comprehensive evaluation method is used to deal with the evaluation indexes.
Step 1: Establishment of a set of evaluation indexes. After the evaluation indexes are selected, they are all put into a factor set U, which can be expressed as follows.
where ui(i = 1, 2, 3, ⋯ , n) is the evaluation index factor and n represents the number of evaluation factors at the same level.
Step 2: Establishment of a comment set. According to the evaluation results of the evaluation system, the evaluation set V can be expressed as follows.
where vj(j = 1, 2, 3, ⋯ , m) represents the evaluation result of the jth type and m represents the number of evaluation grades.
Step 3: Establishment of the weight coefficient of the evaluation index. The analytic hierarchy process is used to classify the evaluation indexes. The first layer is the evaluation target layer, and the second layer is the criterion layer, which can be expressed as follows.
The third layer is the quantification of evaluation indexes.
Then, the index weight of each layer is obtained by building a judgment matrix and normalization. In this study, the weight of the second layer is set as G, which can be expressed as follows.
The weight of the index of the third layer is set as follows.
where Gi ≥ 0, Gij ≤ 1, and Gi + Gij = 1.
Step 4: First-level fuzzy comprehensive evaluation. In this study, the single-level evaluation method (Wang, 2020) is used to obtain the membership matrix of each evaluation index, which can be as follows.
where i = 1, 2, ⋯ , k, q represents the number of evaluation criteria, and n represents the number of evaluation factors. Through the combination of the weight coefficient of each evaluation index with the membership degree matrix, the evaluation result vector of the index factor can be expressed as follows.
Step 5: Second-level fuzzy comprehensive evaluation. Based on the first-level fuzzy comprehensive evaluation results, there is also a corresponding relationship between each evaluation index, so the evaluation results of each index are integrated using fuzzy mathematics calculation. Then, the final evaluation result vector obtained is as follows.
According to the above steps, the weight value of each index has a great impact on the final evaluation result. Therefore, the BP neural network is used in this study to determine the weight value of the comprehensive evaluation index. First, the structure of the neural network used to determine the weight is constructed, as shown in Figure 4, which is divided into the input layer, the hidden layer, and the output layer.
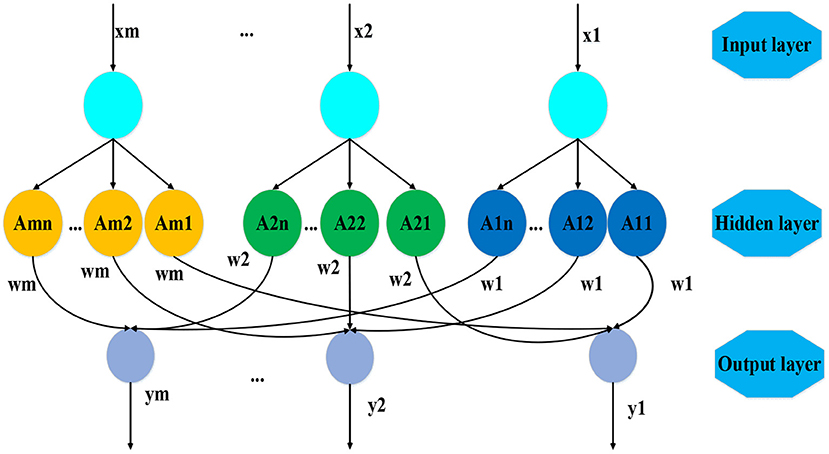
Figure 4. The three-layer BP neural network structure.
Step 6: The input layer. The input element is the value of each evaluation index. The dimensionality of each index is different, so the values of each index are converted into non-dimensional standard values first. There are m neurons in the input layer, and the input and output of the neurons can be expressed as follows.
where i = 1, 2, ⋯ , m, j = 1, 2, ⋯ , n, represents the input, and is the output.
Step 7: The hidden layer. The hidden layer differentiates the input of the input layer and obtains the membership value of each input level according to the membership function. In the constructed BP network, there are n comment levels and a total of m×n neurons. In this study, trigonometric functions (Zhang et al., 2019) are introduced to express membership functions, which can be as {Aij} = {NB, NS, N, PS} = {excellent, good, qualified, unqualified}. Therefore, n = 4, then the evaluation index membership function is calculated as follows.
When j = 1, the corresponding membership function parameters are a1 and a2.
where μ1x represents a membership function. When j = n, the corresponding membership function parameters are an and an−1.
When 1 < j<n, the corresponding membership function parameters are aj, aj−1, and aj+1.
According to the above calculation method, the output of the hidden layer can be obtained as follows.
where Aij(xi) represents the numerical membership function of the jth comment level and represents the membership value of each level.
Step 8: The output layer. The output layer mainly evaluates each input vector and obtains the corresponding evaluation vector according to the value of the evaluation level. Then, the output can be expressed as follows.
where i = 1, 2, 3, ⋯ , m, j = 1, 2, 3, ⋯ , n.
To sum up, the structure of the BP-fuzzy comprehensive evaluation model for social benefit of small towns with culture–tourism characteristics in this study are shown in Figure 5.
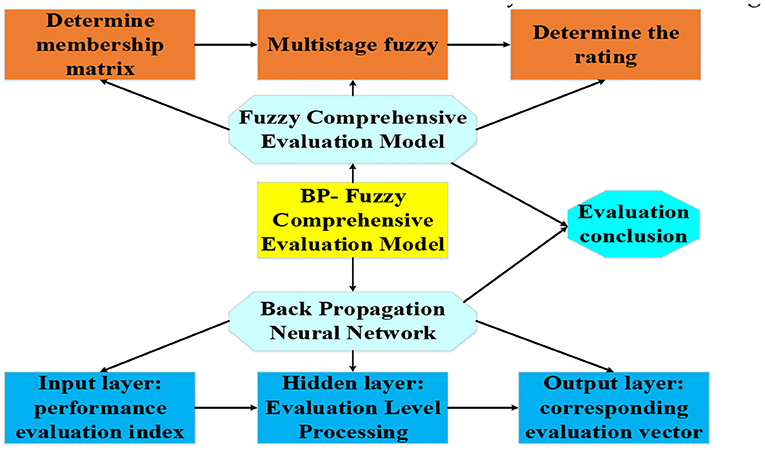
Figure 5. The construction of BP-fuzzy comprehensive model for social benefit evaluation of the culture–tourism town.
Results
Calculation of Each Index Weight
Calculation of the Weight Value of the W–G Judgment Matrix
According to the model constructed in this study, the index system is firstly divided into three layers. The first level is the target layer: social benefit of the culture–tourism town, recorded as W. The second level is the criterion layer: G1, G2, G3. The third level is the index layer which contains indexes of the cultural inheritance and protection H1, the employment rate increase H2, the quality-of-life promotion H3, infrastructure improvement H4, the ecological environment improvement H5, green vegetation protection H6, the environmental awareness improvement H7, the commercial economy development H8, ROE H9, RPCE H10, and ROC H11.
The calculation of the weight value of the W–G judgment matrix is shown in Table 2. After calculation, g1 = 8.333, g2 = 6, and g3 = 1.643. After normalization, the eigenvector can be obtained as follows: . According to the consistency test, CI = 0.074, and CR = 0.052, which are both <0.1. The weight values of G1, G2, and G3 relative to the target layer W are 0.522, 0.376, and 0.103, respectively, as shown in Figure 6.
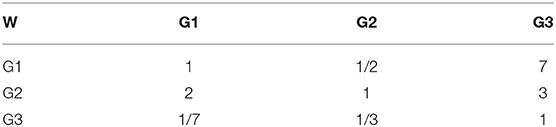
Table 2. Calculation of the weight value of the W-G judgment matrix.
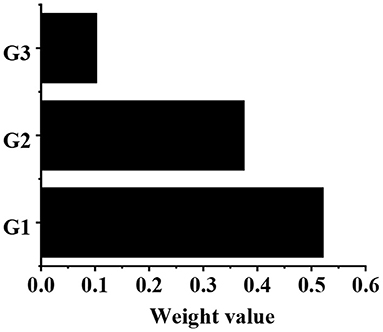
Figure 6. The weight values of G1, G2, and G3 relative to the target layer W.
The Calculation of Weight Value in the G–H Judgment Matrix
The calculation of weight value in the G1–H judgment matrix is shown in Table 3. After calculation, g4 = 16, g5 = 1.676, g6 = 9.333, and g7 = 4.533. After normalization, the eigenvector can be obtained as follows: . According to the consistency test, CI = 0.050, and CR = 0.039, which are both <0.1. Then, the weight values of H1, H2, H3, and H4 relative to G1 are shown in Figure 7, which are 0.507, 0.053, 0.296, and 0.144, respectively. The calculation of weight value in G2-H judgment matrix is shown in Table 4. After calculation, g8 = 9, g9 = 1.450, g10 = 5.333. After normalization, the eigenvector can be obtained as follows. According to the consistency test, CI = 0.047, and CR = 0.062, which are both less than 0.1. Then, the weight values of H5, H6, and H7 relative to G2 are shown in Figure 8, which are 0.570, 0.092 and 0.338, respectively.
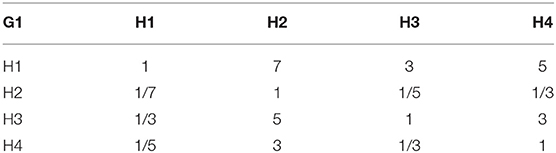
Table 3. Calculation of weight value of the G1–H judgment matrix.
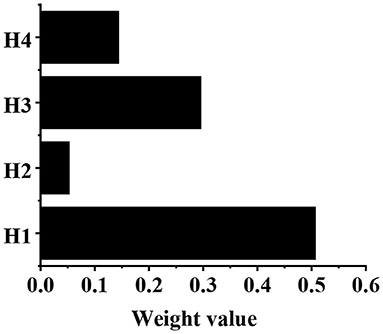
Figure 7. The weight values of H1, H2, H3, and H4 relative to G1.
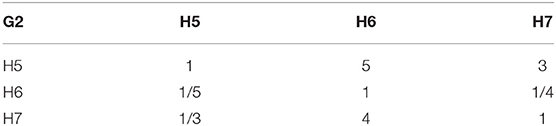
Table 4. Calculation of weight value of the G2–H judgment matrix.
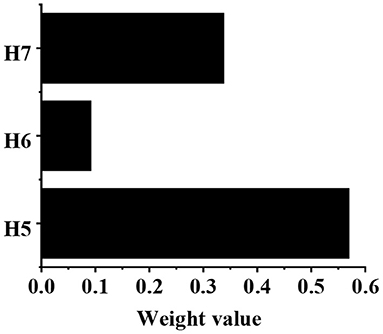
Figure 8. The weight values of H5, H6, and H7 relative to G2.
The calculation of weight value in the G3–H judgment matrix is shown in Table 5. After calculation, g11 = 11, g12 = 4.45, g13 = 5.666, and g14 = 4.833. After normalization, the eigenvector can be obtained as follows: . According to the consistency test, CI = 0.081, and CR = 0.056, which are both <0.1. Then, the weight values of H8, H9, H10, and H11 relative to the G3 are shown in Figure 9, which are 0.424, 0.175, 0.218, and 0.186, respectively.
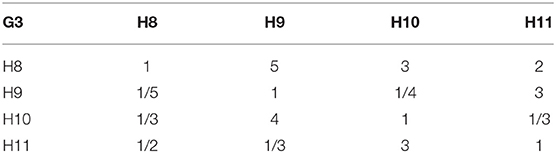
Table 5. Calculation of weight value of the G3–H judgment matrix.

Figure 9. The weight values of H8, H9, H10, and H11 relative to the G3.
The Weight Value of the W–H Index
According to weight values of the W–G and G–H judgment matrices obtained in 3.1.1 and 3.1.2, the weight value of each index in the index layer relative to the target layer W is calculated, as shown in Figure 10. In terms of G1, the weight value of H1 relative to target layer W is the largest (0.311), followed by the H4 index (0.208). In terms of G2, the weight value of the H5 index relative to target layer W is the largest (0.169). In terms of G3, the weight value of the H8 index relative to target layer W is the largest (0.057), followed by the H10 index (0.031).
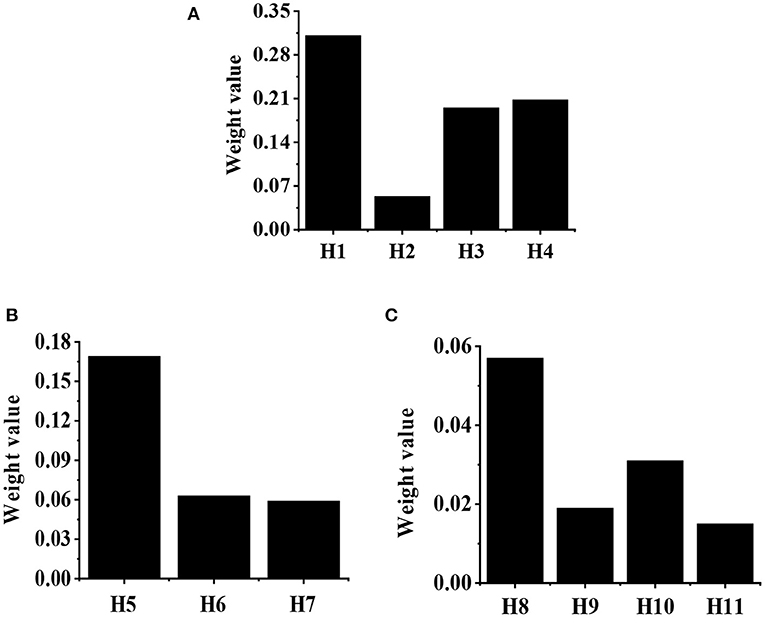
Figure 10. The weight value of each index in the index layer to the target layer W. (A) The index of G1; (B) the index of G2; (C) the G3 index.
The Membership Degree of Each Index
The Membership Matrix of Each Index of G1
As shown in Table 6, the membership degree of H1 of G1 to the comment set is [0.481, 0.362, 0.157, 0], with 48.1% being excellent, 36.2% being good, and 15.7% being qualified. The membership degree of H2 to the comment set is [0.274, 0.405, 0.321, 0], with 27.4% being excellent, 40.5% being good, and 32.1% being qualified. The membership degree of H3 to the comment set is [0.288, 0.526, 0.186, 0], with 28.8% being excellent, 52.6% being good, and 18.6% being qualified. The membership degree of H4 to comment set is [0.433, 0.371, 0.196, 0], with 43.3% being excellent, 37.1% being good, and 19.6% being qualified.
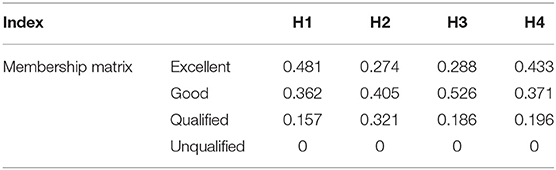
Table 6. The membership matrix of each index of G1.
Membership Matrix of Each Index of G2
As shown in Table 7, the membership degree of H5 in G1 to the comment set is [0.247, 0.431, 0.240, 0.082], with 24.7% being excellent, 43.1% being good, 24% being qualified, and 8.2% being unqualified. The membership degree of H6 to comment set is [0.318, 0.377, 0.305, 0], with 31.8% being excellent, 37.7% being good, and 30.5% being qualified. The membership degree of H7 to comment set is [0.497, 0.311, 0.176, 0.016], with 49.7% being excellent, 31.1% being good, 17.6% being qualified, and 1.6% being unqualified.
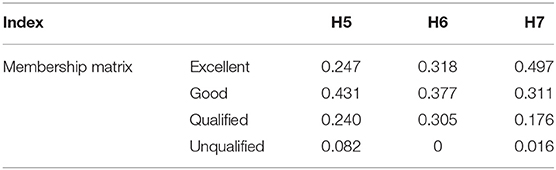
Table 7. Membership matrix of each index of G2.
Membership Matrix of Each Index of G3
As shown in Table 8, the membership degree of H8 of G3 to the comment set is [0.266, 0.608, 0.126, 0], with 26.6% being excellent, 60.8% being good, and 12.6% being qualified. The membership degree of H9 to the comment set is [0.198, 0.677, 0.128, 0], with 19.8% being excellent, 67.7% being good, and 12.8% being qualified. The membership degree of H10 to the comment set is [0.053, 0.811, 0.136, 0], with 5.3% being excellent, 81.1% being good, and 13.6% being qualified. Furthermore, the membership degree of H10 to the comment set is [0.038, 0.793, 0.169, 0], with 3.8% being excellent, 79.3% being good, and 16.9% being qualified.
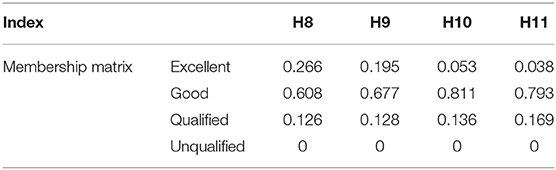
Table 8. Membership matrix of each index of G3.
Multilevel Fuzzy Comprehensive Evaluation Results
The Results of the First-Level Fuzzy Comprehensive Evaluation
As shown in Table 9, according to the first-level fuzzy equation, 41.20% of G1 is excellent, 35.80% is good, and 23% is qualified. For the G2, 39.5% is excellent, 34.7% is good, 15.1% is qualified, and 10.7% is unqualified. For G3, 22.7% is excellent, 40.5% is good, and 35.5% is qualified.
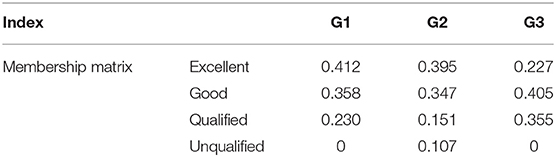
Table 9. Calculation of weight value of the G3–H judgment matrix.
The Results of the Second-Level Fuzzy Comprehensive Evaluation
As shown in Figure 11, according to the relative weight value of each index of the criterion layer to the target layer, the social benefit evaluation of the culture–tourism town is obtained through fuzzy calculation. Specifically, 30.76% of the social benefit of the culture–tourism town is excellent, 37.69% is good, 21.48% is qualified, and 10.07% is unqualified.
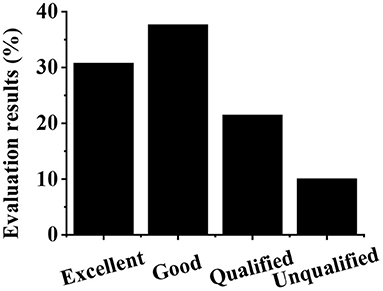
Figure 11. The results of the second-level fuzzy comprehensive evaluation.
Discussion
In recent years, the traditional sightseeing tourism, characterized by natural resources, is far from meeting people's growing demands on tourism. As the product of the tourism performing arts industry in the current culture–tourism integration, the culture–tourism town development is a new trend in tourism development (Law et al., 2019; Li et al., 2019). Based on deep learning BP neural network and fuzzy comprehensive analysis method, an artificial intelligence model for the culture–tourism town social benefit evaluation is constructed in the study. The weight values of G1, G2, and G3 relative to the target layer W are 0.522, 0.376, and 0.103, respectively, which is different from the research results of Saeidi et al. (2017). The development and construction of the culture–tourism town are found to have greatly improved the living standards of local residents, indicating that the weight value of life benefit is the largest, and it is an important factor in the evaluation of social benefit. The weight values of H1, H2, H3, and H4 relative to G1 are 0.507, 0.053, 0.296, and 0.144, respectively, indicating that the cultural inheritance and protection have the greatest influence on the evaluation results of G1 (Kulshrestha et al., 2020). The weight values of H5, H6, and H7 relative to G2 are 0.570, 0.092, and 0.338, respectively, which is consistent with the research results of Lv et al. (2018), indicating that the ecological environment improvement has the greatest influence on the evaluation results of G2. The weight values of H8, H9, H10, and H11 relative to the G3 are 0.424, 0.175, 0.218, and 0.186, respectively, indicating that the commercial economy development has the greatest influence on the evaluation results of G3 (Ma et al., 2018). According to the above analysis, the culture inheritance and protection, the ecological environment improvement, and the commercial economy development are the key factors to evaluate the social benefit of the culture–tourism town.
In addition, according to the first-level fuzzy comprehensive evaluation, for G1, 41.20% is excellent and 35.80% is good. For G2, 39.5% is excellent and 34.7% is good. For G3, 22.7% is excellent and 40.5% is good, which is different from the result obtained by Al Shehhi and Karathanasopoulos (2020). This may be due to the differences in the development priorities of towns with different culture–tourism characteristics. It is evident that G1 and G2 are excellent, while G3 is good. The culture inheritance and protection index has the highest weight value to the social benefit of the target layer, indicating that the construction of the culture–tourism town is conducive to carrying forward the traditional culture and the harmonious development of the society (Hossain and Muhammad, 2019; Wang, 2020). A fine ecological environment is a necessary condition for a culture–tourism town to satisfy tourists' viewing and behavioral psychological demands. G2 is found to be excellent for the subject town, indicating that the construction of a culture–tourism town causes little damage to the local environment (Farmaki, 2018). According to the second-level fuzzy evaluation results, 30.76% of the total social benefit of the culture–tourism town is excellent, 37.69% is good, 21.48% is qualified, and 10.07% is unqualified, which is similar to the research results of Cheng et al. (2017). The total social benefit is good, indicating that the development and construction of the culture–tourism town is of great significance.
Conclusions
Based on deep learning BP neural network and fuzzy comprehensive analysis method, an artificial intelligence model is constructed for social benefit evaluation, with Yiyang town taken as the research subject. It is found that the life benefit and environmental benefit in the Yiyang culture–tourism town is excellent, with the economic benefit and the total social benefit being good. The culture inheritance and protection, the ecological environment improvement, and the commercial economy development are found to be the key factors to evaluate the social benefit of the culture–tourism town. However, some shortcomings are noted in this study. There are few previous references cited in this study, and the selection of social benefit factors of the culture–tourism town is subjective to some extent, which may reduce the power and increase the error margin of the results. More objective research is necessary in future. In conclusion, the study provides a theoretical basis for applying deep learning in social benefit evaluation of the culture–tourism integration industry.
Data Availability Statement
The raw data supporting the conclusions of this article will be made available by the authors, without undue reservation.
Ethics Statement
The studies involving human participants were reviewed and approved by Hunan City University Ethics Committee. The patients/participants provided their written informed consent to participate in this study. Written informed consent was obtained from the individual(s) for the publication of any potentially identifiable images or data included in this article.
Author Contributions
The author confirms being the sole contributor of this work and has approved it for publication.
Funding
Teaching Reform Research Project of Hunan Ordinary Universities: Innovation Research on Training Mode of Excellent Dance Talents in Application-oriented Universities under the Background of Professional Certification (Grant No. Hnjg-2020-0789). The key project of Hunan Social Science Achievements Review Committee, Research on the Industrialization of Hunan Tourism Performing Arts in tourism Integration below (Grant No. XSP20ZDI016); Key project of Yiyang Social Science and Technology Federation Research on Nanxian Dihua-Gu Dance from the Perspective of Semiotics. It was also supported by the positioning of “The Belt and Area Initiative” is the research on Hunan tourism industrialization in tourism integration.
Conflict of Interest
The author declares that the research was conducted in the absence of any commercial or financial relationships that could be construed as a potential conflict of interest.
References
Al Shehhi, M., and Karathanasopoulos, A. (2020). Forecasting hotel room prices in selected GCC cities using deep learning. J. Hosp. Tour Manag. 42, 40–50. doi: 10.1016/j.jhtm.2019.11.003
Chen, M. (2019). The impact of expatriates' cross-cultural adjustment on work stress and job involvement in the high-tech industry. Front. Psychol. 10:2228. doi: 10.3389/fpsyg.2019.02228
Cheng, C., Zhenbin, Z., and Yan, H. (2017). Social landscape sensitivity analysis of western tourism community: a case study of Langmusi town in Gannan. Geogr. Res. Aust. 36, 899–912. doi: 10.11821/dlyj201705008
Drius, M., Bongiorni, L., Depellegrin, D., Menegon, S., Pugnetti, A., and Stifter, S. (2019). Tackling challenges for mediterranean sustainable coastal tourism: an ecosystem service perspective. Sci. Total Environ. 652, 1302–1317. doi: 10.1016/j.scitotenv.2018.10.121
Farmaki, A. (2018). Tourism and hospitality internships: a prologue to career intentions? J. Hosp. Leis. Sports Tour. Educ. 23, 50–58. doi: 10.1016/j.jhlste.2018.06.002
Hossain, M. S., and Muhammad, G. (2019). Emotion recognition using deep learning approach from audio–visual emotional big data. Inform. Fusion 49, 69–78. doi: 10.1016/j.inffus.2018.09.008
Kim, D., Kang, Y., Park, Y., Kim, N., and Lee, J. (2020). Understanding tourists' urban images with geotagged photos using convolutional neural networks. Spat. Inf. Res. 28, 241–255. doi: 10.1007/s41324-019-00285-x
Kim, S., Kim, S., and King, B. (2019). Nostalgia film tourism and its potential for destination development. J. Travel Tour Mark 36, 236–252. doi: 10.1080/10548408.2018.1527272
Kulshrestha, A., Krishnaswamy, V., and Sharma, M. (2020). Bayesian BILSTM approach for tourism demand forecasting. Ann. Tour. Res. 83:102925. doi: 10.1016/j.annals.2020.102925
Law, R., Li, G., Fong, D. K. C., and Han, X. (2019). Tourism demand forecasting: a deep learning approach. Ann. Tour. Res. 75, 410–423. doi: 10.1016/j.annals.2019.01.014
Li, K., Lu, W., Liang, C., and Wang, B. (2019). Intelligence in tourism management: a hybrid FOA-BP method on daily tourism demand forecasting with web search data. Mathematics 7:531. doi: 10.3390/math7060531
Li, X. (2020). Space-time distribution model of visitor flow in tourism culture construction via back propagation neural network model. Pers. Ubiquit Comput. 24, 223–235. doi: 10.1007/s00779-019-01342-w
Li, Y., and Cao, H. (2018). Prediction for tourism flow based on LSTM neural network. Proc. Comput. Sci. 129, 277–283. doi: 10.1016/j.procs.2018.03.076
Lv, S. X., Peng, L., and Wang, L. (2018). Stacked autoencoder with echo-state regression for tourism demand forecasting using search query data. Appl. Soft Comput. 73, 119–133. doi: 10.1016/j.asoc.2018.08.024
Ma, Y., Xiang, Z., Du, Q., and Fan, W. (2018). Effects of user-provided photos on hotel review helpfulness: an analytical approach with deep leaning. Int. J. Hosp. Manage. 71, 120–131. doi: 10.1016/j.ijhm.2017.12.008
Obschonka, M., Moeller, J., and Goethner, M. (2018). Entrepreneurial passion and personality: the case of academic entrepreneurship. Front. Psychol. 9:2697. doi: 10.3389/fpsyg.2018.02697
Ramsey, D., and Malcolm, C. D. (2018). The importance of location and scale in rural and small town tourism product development: the case of the canadian fossil discovery centre, Manitoba, Canada. Can. Geogr. 62, 250–265. doi: 10.1111/cag.12409
Ranasinghe, R., and Cheng, L. (2018). Tourism-induced mobilities and transformation of indigenous cultures: where is the Vedda community in Sri Lanka heading to? J. Tour Cult. Change 16, 521–538. doi: 10.1080/14766825.2017.1393081
Rogoza, R., Zemojtel-Piotrowska, M., Kwiatkowska, M. M., and Kwiatkowska, K. (2018). The bright, the dark, and the blue face of narcissism: the spectrum of narcissism in its relations to the metatraits of personality, self-esteem, and the nomological network of shyness, loneliness, and empathy. Front. Psychol. 9:343. doi: 10.3389/fpsyg.2018.00343
Saeidi, S., Mohammadzadeh, M., Salmanmahiny, A., and Mirkarimi, S. H. (2017). Performance evaluation of multiple methods for landscape aesthetic suitability mapping: a comparative study between multi-criteria evaluation, logistic regression and multi-layer perceptron neural network. Land Policy 67, 1–12. doi: 10.1016/j.landusepol.2017.05.014
Samora-Arvela, A., Ferreira, J., Vaz, E., and Panagopoulos, T. (2020). Modeling nature-based and cultural recreation preferences in mediterranean regions as opportunities for smart tourism and diversification. Sustainability 12:433. doi: 10.3390/su12010433
Shi, X. (2020). Tourism culture and demand forecasting based on BP neural network mining algorithms. Pers. Ubiquit Comput. 24, 299–308. doi: 10.1007/s00779-019-01325-x
Su, M. M., Wall, G., and Xu, K. (2016). Tourism-induced livelihood changes at mount Sanqingshan world heritage site, China. Environ. Manage. 57, 1024–1040. doi: 10.1007/s00267-016-0672-8
Urien-Lefranc, F. (2020). From religious to cultural and back again: tourism development, heritage revitalization, and religious transnationalizations among the samaritans. Religions 11:86. doi: 10.3390/rel11020086
Wang, M. (2020). Applying Internet information technology combined with deep learning to tourism collaborative recommendation system. PLoS ONE 15:e0240656. doi: 10.1371/journal.pone.0240656
Wu, Y., and Wu, T. (2017). A decade of entrepreneurship education in the Asia Pacific for future directions in theory and practice. Manage. Decis. 55, 1333–1350. doi: 10.1108/MD-05-2017-0518
Wu, Y. J., Liu, W. J., and Yuan, C. H. (2020). A mobile-based barrier-free service transportation platform for people with disabilities. Comput. Hum. Behav. 107:105776. doi: 10.1016/j.chb.2018.11.005
Yang, X., and Wang, Z. J. (2020). Intuitionistic fuzzy hierarchical multi-criteria decision making for evaluating performances of low-carbon tourism scenic spots. Int. J. Environ. Res. Public Health. 17:6259. doi: 10.3390/ijerph17176259
Yi, Y., Zhao, C., and Fu, J. (2019). Research on the integration and development of modern agriculture and rural tourism based on AHP—take Yangjia town in Mianyang city as an example. JSS 7, 76–87. doi: 10.4236/jss.2019.77008
Yousif, A. (2018). Culture-nature journey knowledge cafe. The double-edged sword of culture-tourism and the conservation of natural and cultural assets: case studies from the Eastern Adriatic. His. Environ. 30:34.
Yuan, C. H., and Wu, Y. J. (2020). Mobile instant messaging or face-to-face? Group interactions in cooperative simulations. Comput. Hum. Behav. 113:106508. doi: 10.1016/j.chb.2020.106508
Zhang, C., Wang, S., Sun, S., and Wei, Y. (2020). Knowledge mapping of tourism demand forecasting research. Tour Manag. Perspect. 35:100715. doi: 10.1016/j.tmp.2020.100715
Keywords: social benefit, BP neural network, towns with cultural and tourism characteristics, fuzzy comprehensive analysis method, cultural inheritance and protection
Citation: Zhang R (2021) Exploration of Social Benefits for Tourism Performing Arts Industrialization in Culture–Tourism Integration Based on Deep Learning and Artificial Intelligence Technology. Front. Psychol. 12:592925. doi: 10.3389/fpsyg.2021.592925
Received: 08 August 2020; Accepted: 05 January 2021;
Published: 16 February 2021.
Edited by:
Yenchun Jim Wu, National Taiwan Normal University, TaiwanCopyright © 2021 Zhang. This is an open-access article distributed under the terms of the Creative Commons Attribution License (CC BY). The use, distribution or reproduction in other forums is permitted, provided the original author(s) and the copyright owner(s) are credited and that the original publication in this journal is cited, in accordance with accepted academic practice. No use, distribution or reproduction is permitted which does not comply with these terms.
*Correspondence: Ruizhi Zhang, 13622746@qq.com